- Trang chủ >>
- Khoa Học Tự Nhiên >>
- Vật lý
Phonon assisted tunneling process in amorphous silicon nanostructures and gaas nanowires
Bạn đang xem bản rút gọn của tài liệu. Xem và tải ngay bản đầy đủ của tài liệu tại đây (186.43 KB, 3 trang )
Physica E 40 (2008) 2859–2861
Phonon-assisted tunneling process in amorphous silicon nanostructures
and GaAs nanowires
P. Ohlckers
Ã
, P. Pipinys
Vestfold University College, Raveien 197, Toensberg N-3103, Norway
Received 12 September 2007; accepted 4 January 2008
Available online 14 February 2008
Abstract
Experimental results on the current–voltage (I–V) characteristics of amorphous Si nanostructures reported by Irrera et al. [A. Irrera,
F. Iacona, I. Crupil, C.D. Presti, G. Franzo, C. Bongiorno, D. Sanfilippo, G. Di Stefano, A. Piana, P.G. Fallica, A. Canino, F. Priolo,
Nanotechnology 17 (2006) 1428] are reinterpreted in terms of a phonon-assisted tunneling model. It is shown that temperature dependence
of current can be caused by the temperature dependence of electron tunneling rate from traps in the metal–semiconductor interface to the
conduction band of the semiconductor. A good fit of experimental data with the theory is achieved in all measured temperature range from
30 to 290 K using for calculation the effective mass of 0.5m
e
, and for the phonon energy the value of 12 meV. An advantage of this model
over that of Irrera et al. used model is the possibility of describing the behavior of I–V data measured at both high and low temperatures
with the same set of parameters characterizing this material. The temperature-dependent I–V data by Schricker et al. [A.D. Schricker, F.M.
Davidson III, R.J. Wiacek, B.A. Korgel, Nanotechn. 17 (2006) 2681.] of GaAs nanowires, are also explained on the basis of this model.
r 2008 Elsevier B.V. All rights reserved.
PACS: 73.21.Hb; 78.67.Lt; 72.20.Jv; 73.40.Gk
Keywords: Si; GaAs nanostructures; Electron transport; Phonon-assisted tunneling
1. Introduction
Current densit y–voltage (I–V) charact eristics measured
over a wide range of temperatures (from 30 to 290 K) for a
device containing amorphous Si nanoclusters were pre-
sented in the recently published paper by Irrera et al. [1].
The I–V characteristics exhibited substantial dependence
on a temperature. The strongest temperature dependence
has been observed at low electric field. The authors of
Ref. [1] asserted that none of the known mechanisms based
on tunneling, neither Poole–Frenkel (PF) emission nor
hopping conduction are able to explain fully the observed
peculiarities of the electrical properties of the objects under
investigation. Authors of Ref. [1] itemize tunneling process
like the direct tunneling [2], the Fowler–Nordheim tunnel-
ing mechanism [3] and the trap-assisted tunneling [4].
They all are temperature-independent mechanisms, and,
certainly, cannot explain the strongly temperature-depen-
dent I–V data. We want to note that without above
enumerated tunneling mechanisms phonon-assisted tunnel-
ing (PhAT) is established [5,6], which is essentially a
temperature-dependent process. PhAT has been success-
fully used for explanation of the temperature-dependent
current–voltage data of thin films [7] and Schottky diodes
[8]. In the presented work we apply the phonon-assisted
tunneling model approach for explanat ion of the tempera-
ture peculiarities of the I–V characteristics in the amor-
phous silicon nanostructures and GaAs nanowires recently
published in Refs. [1,9].
2. Theory and a comparison with experimental data
If the current is dominated by the process of charge
carriers emission from traps, then the current’s value I may
be expressed by the relation [10]:
I ¼
1
2
AeNW , (1)
ARTICLE IN PRESS
www.elsevier.com/locate/physe
1386-9477/$ - see front matter r 2008 Elsevier B.V. All rights reserved.
doi:10.1016/j.physe.2008.01.012
Ã
Corresponding author. Tel.: +47 33037718; fax: +47 33031103.
E-mail address: (P. Ohlckers).
where A is the effective generation volume, e is the
electronic charge unit, N is the traps density and W is the
rate of tunneling. Some tunneling theories accounting
the interaction of electrons with phonons are known [5,6],
in which the tunneling is temperature-dependent process.
In the presented paper, we will interpret the experi mental
results of current dependence on applied voltage and
temperature by analyzing the transition rate W(E,T)of
electron/hole from deep center to conduction band and
using in this manner dependences on the field strength and
on temperature, which follows from the quantum-mechan-
ical phonon-assisted tunneling theory. For this purpose, a
relatively simple equation derived for electron tunneling
from deep center to the conduction band derived in Ref. [5]
is used:
W
t
¼
eE
ð8m
n
T
Þ
1=2
½ð1 þ g
2
Þ
1=2
À g
1=2
½1 þ g
2
À1=4
 exp 4
3
ð2m
n
Þ
1=2
eE_
3=2
t
½ð1 þ g
2
Þ
1=2
À g
2
Âð1 þ g
2
Þ
1=2
þ
1
2
g
, (2)
where
g ¼
ð2m
n
Þ
1=2
G
2
8e_E
1=2
T
. (3)
Here G
2
¼ 8 a ð_oÞ
2
ð2n þ 1Þ is the width of the absorption
band of a center, n ¼½expð_o=k
B
TÞÀ1
À1
, where _o
is the phonon energy, e
T
is the energetic depth of the trap, e
is the electronic charge unit, m* is the electron effective
mass, and a is the electron–phonon coupling constant
ða ¼ G
2
0
=8ð_oÞ
2
Þ, where G
0
is the width of center band at
temperature 0 K.
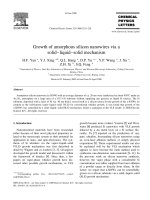
Thus, let us compare the temperature-dependent char-
acteristics extracted from Fig. 2(b) in Ref. [1] with
theoretical W(E,T) dependences calculated using the
Eq. (2). The calculation was performed using the traps
depth value of 0.74 eV. The effective mass of carrier m* was
taken to be equal to 0.5m
e
, and for the phonon energy the
value of 12 meV was taken. The value of the parameter a
was chosen to get the best fit of simulated W(T,E) curves
with a set of experimental data. The theoretical ln W
versus 1/T dependences fitted to the experimental data
are depicted by solid lines in Fig. 1. It is seen that in whole
range of temperatures, the experimental data fit well with
computed dependences, with exception of only low voltage
tails of curves obtained at 230 and 290 K temperatures. The
traps density evaluated from the fit of the experimental
data with the theory was found to be equal to
1.5 Â 10
15
cm
À3
, the thickness of Si layer being 70 nm.
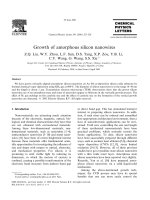
Very similar temperature-dependent I–V data have
been obtained by Schricker et al. for GaAs nanowires [9].
The I–V curves became increasingly nonlinear with
decreasing temperature and followed the scaling relation-
ship J$V
l+1
. In the low bias region, the curves were ohmic
(i.e. l +1 ¼ 1). The authors of Ref. [9] suggested that at
lower temperatures, space charge-limited currents dom-
inate with l increasing as T decreases. We will show that
observed peculiarities of the I–V data can be also described
by PhAT model. In Fig. 2, the experimental results
extracted from Fig. 7a in Ref. [9] are fitted to computed
W(T,E) data.
The calculation of W(T,E) was performed by using the
value of 0.067m
e
for effective mass [11], and by selecting the
value of 13 meV for the phonon energy. The electron–
phonon coupling constant a was chosen so that the best fit
of the experimental data with the calculated dependences
should be received on the assumption that the field strength
at the junction is proportional to the square root of the
applied voltage, i.e. the tunneling occurs in the high field
region of the Schottky barrier. In this case, the source of
charge carriers are traps in the electrode–GaAs nanowire
interface layer from which the electrons emerge to the
conduction band of semiconductor due to the phonon-
assisted tunneling. The electron population in the traps is
assumed to be independent of bias voltage due to the
continuous filling the traps in the interface layer from the
electrode The center depth (activation energy) of e
T
¼ 0.
ARTICLE IN PRESS
3.6
-20
-15
-10
-5
0
5
0
5
10
15
20
25
iln J (A/cm
-2
)
ln E (MV/m)
30K
80
130
180
230
290
Irrera, 2006
Si nano
ln E (MV/m)
ln W (s
-1
)
3.8 4.0 4.2 4.4 4.6 4.8 5.0 5.2 5.4 5.6 5.8
3.6 3.8
4.0
4.2 4.4 4.6 4.8 5.0 5.2 5.4 5.6 5.8
Fig. 1. Current versus E dependences for Si nanostructure at different
temperatures from ([1], Fig. 2b (symbols)) fitted to theoretical W(E,T)
versus E dependences (solid curves), calculated for parameters: a ¼ 20,
e
T
¼ 0.74eV, m* ¼ 0.5m
e
, _o ¼ 12 meV.
P. Ohlckers, P. Pipinys / Physica E 40 (2008) 2859–28612860
15 eV was extracted for this sample from Table 1 in
Ref. [9]. The comparison shows a good agreement of the
experimental data with the calculated ln W(T,E) versus ln E
curves in at all measured temperatures.
3. Conclusion
In conclusion, it has been shown that the phonon-
assisted tunneling model describes well the peculiarities of
the temperature-dependent I–V data in thin films of Si
nanostructures and GaAS nanowires for explanation
elsewhere [1,9] were invoked different mechanisms. The
comparison of experimental data with calculated depen-
dencies allows to estimate the field strength at which the
free charge carriers are generated, and the density of
charged centers. An advantag e of the PhAT model is the
possibility to describe the behavior of I–V data measured at
different temperatures with the same set of parameters
characterizing the material.
Thus, the phonon-assisted tunneling mechanism must
be taken into account in explaining the temperature-
dependent I–V characteristics of devices on the basis of Si
nanostructures and GaAs nanowires.
References
[1] A. Irrera, F. Iacona, I. Crupi1, C.D. Presti, G. Franzo, C. Bongiorno,
D. Sanfilippo, G. Di Stefano, A. Piana, P.G. Fallica, A. Canino,
F. Priolo, Nanotechnology 17 (2006) 1428.
[2] S.M. Sze, Physics of Semiconductor Devices, Wiley, New York, 1981.
[3] R.H. Fowler, L. Nordheim, Proc. R. Soc. A 119 (1928) 181.
[4] B. Ricco, G. Gozzi, M. Lanzoni, IEEE Trans. Electron Devices 45
(1998) 1554.
[5] A. Kiveris, S
ˇ
. Kudzˇ mauskas, P. Pipinys, Phys. Status Solidi (a) 37
(1976) 321.
[6] F.I. Dalidchik, Zh. Eksp. Teor. Fiz. 74 (1978) 472 [Sov. Phys. JETP
47 (1978) 247].
[7] P. Pipinys, A. Rimeika, V. Lapeika, Phys. Status Solidi (b) 242 (2005)
1447.
[8] P. Pipinys, V. Lapeika, J. Appl. Phys. 99 (2006) 093709.
[9] A.D. Schricker, F.M. Davidson III, R.J. Wiacek, B.A. Korgel,
Nanotechnology 17 (2006) 2681.
[10] P. Migliorato, C. Reita, G. Tallarida, M. Quinn, G. Fortunato, Solid-
State Electron. 38 (1995) 2075.
[11] J.S. Blakemore, J. Appl. Phys. 53 (1982) R123.
ARTICLE IN PRESS
-2.5
-9
-8
-7
-6
-5
-4
-3
-2
-1
0
1
2
9
10
11
12
13
14
15
16
17
18
19
ln I (nA)
ln V (V)
260K
220K
190K
160K
Schrick 2006
GaAs nanwr
220
160
260
190
ln W (s
-1
)
ln E (MV/m)
-2.0 -1.5 -1.0
-0.5 0.0 0.5
1.0 1.5
-0.2 0.0 0.2 0.4 0.6 0.8 1.0 1.2 1.4 1.6
Fig. 2. Current versus V dependences for GaAs nanowires at different
temperatures from (Ref. [9], Fig. 7a (symbols)) fitted to theoretical W(E,T)
versus E dependences (solid curves), calculated for parameters: a ¼ 1.7,
e
T
¼ 0.154 eV, m* ¼ 0.067m
e
, _o ¼ 12 meV.
P. Ohlckers, P. Pipinys / Physica E 40 (2008) 2859–2861 2861