Báo cáo khoa học: Kinetic study of the HIV)1 DNA 3¢-end processing Single-turnover property of integrase docx
Bạn đang xem bản rút gọn của tài liệu. Xem và tải ngay bản đầy đủ của tài liệu tại đây (405.8 KB, 15 trang )
Kinetic study of the HIV)1 DNA 3¢-end processing
Single-turnover property of integrase
Maksim Smolov
1
, Marina Gottikh
1
, Vadim Tashlitskii
1
, Sergei Korolev
1
, Ilya Demidyuk
2
,
Jean-Claude Brochon
3
, Jean-Franc¸ois Mouscadet
3
and Eric Deprez
3
1 Belozersky Institute of Physico-Chemical Biology, Moscow State University, Russia
2 Institute of Molecular Genetics, Russian Academy of Science, Moscow, Russia
3 LBPA, UMR 8113 CNRS, IFR121, Ecole Normale Supe
´
rieure de Cachan, France
Integration of a DNA copy of the human immunodefi-
ciency virus (HIV)-1 RNA genome into the human
genome is an essential step in the viral replication
cycle. This process is catalysed by a viral protein,
integrase (IN). The first key reaction in the overall
integration process is the cleavage of a dinucleotide
from each 3¢-end of the viral DNA (substrate DNA), a
reaction termed 3¢-end processing. In the second step,
DNA strand transfer, a pair of processed DNA ends
of the same viral DNA is inserted into the host cellular
DNA (target DNA). The 3¢-end processing reaction
requires a conserved nucleotide sequence at the viral
DNA ends, but the second reaction does not abso-
lutely require specific sequences within the host DNA.
For integration, IN has to bind simultaneously to the
substrate and target DNA, and although the organiza-
tion of the functional ternary complex IN–viral DNA-
target DNA is not yet known, the concerted
integration mechanism very likely involves a multi-
meric active IN [1,2].
Keywords
3¢-processing; fluorescence anisotropy;
integrase; protein–DNA interactions; single-
turnover kinetics
Correspondence
E. Deprez, LBPA, UMR 8113 CNRS,
IFR121, Ecole Normale Supe
´
rieure de
Cachan, 61 avenue du Pre
´
sident Wilson,
94235 Cachan cedex, France
Fax: +33 1 47 40 76 84
Tel: +33 1 47 40 23 94
E-mail:
(Received 17 October 2005, revised 20
December 2005, accepted 16 January 2006)
doi:10.1111/j.1742-4658.2006.05139.x
The 3¢-processing of viral DNA extremities is the first step in the integra-
tion process catalysed by human immunodeficiency virus (HIV)-1 integrase
(IN). This reaction is relatively inefficient and processed DNAs are usually
detected in vitro under conditions of excess enzyme. Despite such experi-
mental conditions, steady-state Michaelis–Menten formalism is often
applied to calculate characteristic equilibrium ⁄ kinetic constants of IN. We
found that the amount of processed product was not significantly affected
under conditions of excess DNA substrate, indicating that IN has a limited
turnover for DNA cleavage. Therefore, IN works principally in a single-
turnover mode and is intrinsically very slow (single-turnover rate con-
stant ¼ 0.004 min
)1
), suggesting that IN activity is mainly limited at the
chemistry step or at a stage that precedes chemistry. Moreover, fluores-
cence experiments showed that IN–DNA product complexes were very sta-
ble over the time-course of the reaction. Binding isotherms of IN to DNA
substrate and product also indicate tight binding of IN to the reaction
product. Therefore, the slow cleavage rate and limited product release pre-
vent or greatly reduce subsequent turnover. Nevertheless, the time-course
of product formation approximates to a straight line for 90 min (apparent
initial velocity), but we show that this linear phase is due to the slow
single-turnover rate constant and does not indicate steady-state multiple
turnover. Finally, our data ruled out the possibility that there were large
amounts of inactive proteins or dead-end complexes in the assay. Most of
complexes initially formed were active although dramatically slow.
Abbreviations
HIV, human immunodeficiency virus; IN, integrase; LTR, long terminal repeat; PIC, preintegration complex; r, anisotropy; RSV, Rous sarcoma
virus.
FEBS Journal 273 (2006) 1137–1151 ª 2006 The Authors Journal compilation ª 2006 FEBS 1137
The 3¢-processing and strand transfer reactions can
be carried out in vitro using purified recombinant IN,
a divalent metal cation such as Mg
2+
or Mn
2+
and an
oligonucleotide duplex that mimics one of the viral
DNA ends. The strand transfer reaction can also be
studied by adding heterologous target DNA. These
simplified in vitro systems have been widely used to
study the biochemical mechanism of DNA integration,
and many IN inhibitors were initially characterized in
such in vitro systems. They include the so-called diketo
acids, which preferentially inhibit strand transfer, and
styrylquinolines, which inhibit 3¢-processing [3,4].
Recently, it was shown that recombinant IN alone is
able to perform the concerted joining reaction (i.e.
complete integration process involving two viral DNA
ends) [5–7]. Nevertheless, in all the reactions men-
tioned above, recombinant IN displays low catalytic
activities and the reasons for such low activities remain
unknown.
There have been significant advances in recent years
regarding the ability of recombinant IN to use Mg
2+
as a cofactor. This divalent cation, which is believed to
be the IN cofactor in vivo, is not equivalent to Mn
2+
in vitro. The specificity of catalysis is greater with
Mg
2+
and the choice by the enzyme of the nucleophile
for the 3¢-processing reaction strongly depends on the
nature of the cationic cofactor [8–11]. Moreover, sev-
eral drugs have different activities in Mn
2+
- and
Mg
2+
-based activity assays, and Mg
2+
-dependent
activities are usually more predictive of physiological
behaviour [12–14]. In addition, some mutations that
confer resistance to inhibitor in vivo may have parallel
effects in vitro in the presence of Mg
2+
, but not Mn
2+
[15]. Recently, we developed a new protocol for IN
preparation, without using detergent during the purifi-
cation, leading to substantial beneficial effects on many
of the properties of IN, including its multimeric state
and the ability to use Mg
2+
as a cofactor [16].
Although Mg
2+
-competent IN seems more specific
and relevant to physiological activity, the Mg
2+
-
dependent activity remains low and does not signifi-
cantly exceed the Mn
2+
-dependent activity. With
either cation, a high enzyme-to-DNA ratio (typically
> 30 : 1) is required in vitro for efficient catalysis,
although the reasons for such a high ratio are unclear.
Despite the abundant literature on IN, very little quan-
titative data on the kinetic properties of this protein
are available. Moreover, in some studies, Michaelis–
Menten equations are applied, despite assays usually
containing a large excess of IN over DNA substrate,
an experimental condition that normally precludes
such analytical treatment. Quantitative evaluation of
IN performances in vitro and the characterization of
Mg
2+
-competent IN at the catalytic level, as well as
the identification of rate-limiting steps in the overall
catalytic process, are thus important, especially for
pharmacological purposes.
Here, we describe a detailed kinetic analysis of
HIV-1 IN under specific Mg
2+
conditions using single-
turnover formalism. We found that IN is intrinsically
very slow (single-turnover rate of DNA cleavage of
0.004 min
)1
) and works in a single-turnover mode even
in the presence of an excess of DNA substrate. Steady-
state multiple turnover cannot be achieved for several
reasons, including low cleavage rate and tight binding
of IN to the processed DNA product. The stability of
IN during the time-course of the reaction and the
influence of protein aggregation are discussed.
Results
General features of the 3¢-end processing kinetics
The kinetics of 3¢-end processing was studied using the
U5-duplex that mimics the U5 long terminal repeat
(LTR) sequence. First, we used experimental condi-
tions typical of those described in the literature, i.e. an
excess of enzyme over DNA substrate (3 nm DNA,
100 nm IN) in the presence of the physiologically rele-
vant Mg
2+
cofactor. The time-course for the 3¢-pro-
cessing reaction displayed three distinct phases
(Fig. 1B, upper). Phase I was a lag phase lasting 15–
20 min (see also Fig. 4B) and was followed by an
apparent linear phase in which product formation ver-
sus time approximated to a straight line (phase II),
although the experimental conditions, involving a high
E : S ratio, were obviously non-Michaelis–Menten.
During phase III, as the substrate became depleted,
the product concentration reached a plateau. This plat-
eau did not correspond to the complete conversion of
DNA substrate to the cleaved product ( 80% of the
substrate was cleaved); this point is discussed further
below. The kinetic characteristics of the two first
phases were then addressed.
Interpretation of the lag phase (phase I)
Phase I may be due to slow binding of IN to DNA, as
suggested by earlier studies [17,18]. Thus, we studied
the DNA-binding step using steady-state fluorescence
anisotropy [17] with Fl–U5B ⁄ U5A duplex under condi-
tions similar to those used in the activity assay. As
shown in Fig. 1C, IN-bound DNA gave a higher
anisotropy value than free DNA and equilibrium was
reached after 20 min of IN incubation with DNA
substrate (the first-order kinetic constant k¢
on
was
Single-turnover kinetics of HIV-1 integrase M. Smolov et al.
1138 FEBS Journal 273 (2006) 1137–1151 ª 2006 The Authors Journal compilation ª 2006 FEBS
0.23 min
)1
), suggesting that the lag phase corresponds
to the DNA-binding step. Indeed, phase I was not
observed when IN was preincubated with DNA and
Mg
2+
for 30 min at 20 °C (permissive temperature for
DNA-binding but nonpermissive for activity) prior to
the incubation at 37 °C (data not shown) or when the
reaction was allowed to proceed by addition of Mg
2+
after preincubation of IN with DNA at 37 °C
(Fig. 1B, lower). Under these two conditions, product
formation was approximately two- to threefold higher
during the first 20 min compared with the experiment
without preincubation (Fig. 1B, upper). However,
except for the absence of phase I, preincubation did
not significantly influence the overall time-course of
product formation (phases II + III). Interestingly, the
DNA-binding step as measured by steady-state anisot-
ropy was not strongly influenced by the DNA
sequence or by the absence of a metal ion cofactor
(data not shown): HIV-specific or random sequences in
the presence or absence of Mg
2+
gave similar DNA-
binding kinetics. However, in the absence of Mg
2+
,a
higher limit anisotropy value (10% higher) was system-
atically obtained, suggesting the presence of high-order
multimeric forms of IN, possibly aggregates, bound to
DNA. Furthermore, under conditions compatible with
the 3¢-processing activity of IN, the steady-state anisot-
ropy value which is related to the fractional saturation
function remained stable throughout the activity
experiment, i.e. 300 min (Fig. 1D), suggesting that the
processed DNA product has a strong affinity for IN
(see also Fig. 5).
Determination of equilibrium and catalytic
constants (phase II)
During phase II ( 90 min), the product concentra-
tion increased linearly with time suggesting that this
0
0.05
0.1
0.15
0.2
0.25
0102030
r
A
0 50 100 150 200 250 300
0.0
0.5
1.0
1.5
2.0
2.5
Time (min)
P[ roduct n(]
M)
I II III
N
1 2
T
S
P
0 10 15 60 90 120 150 180 240 300
5
30
S
P
0 50 100 150
200 250
300
0.0
0.5
1.0
1.5
2.0
2.5
Time (min)
rP[oduct(]n
M
)
C
0
0.05
0.1
0.15
0.2
0.25
0 50 100 150 200 250 300
r
D
Time (min)
Time (min)
B
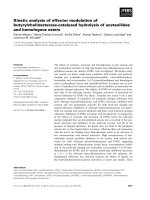
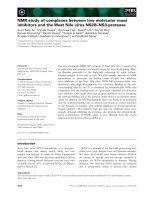
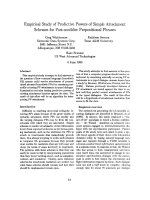
Fig. 1. Kinetic study of the 3¢-processing reaction. (A) Analysis of
reaction products showing the weak nonspecific endonucleolytic
activity of IN under the Mg
2+
condition. S, substrate (21-mer);
P, 3¢-processing product (19-mer); N, nonspecific products (£ 18-
mer). Strand transfer products (T) are estimated to be £ 5% of total
products. Incubation time was 160 (lane 1) or 190 min (lane 2). (B)
Time-course of cleaved product formation. (Upper) DNA substrate
was mixed at t ¼ 0 with IN in the presence of MgCl
2
. Substrate
(21-mer) and product (19-mer) were separated by gel electrophor-
esis (below the curve) and quantified as indicated in Experimental
procedures. (Lower) DNA substrate was first preincubated with IN
for 30 min at 37 °C in the absence of Mg
2+
. MgCl
2
was then added
to the mixture to start the reaction (t ¼ 0). (C) Binding of IN to
DNA at 37 °C as monitored by steady-state fluorescence anisotropy
(r). IN was added to fluorescein-labelled U5-duplex in the reaction
buffer and r-values were recorded at time intervals of 50 s for
30 min. Initial r-value (0.055) corresponds to free DNA. The DNA
binding at 20 °C (not shown) was only slightly slower than
that at 37 °C(k’
on, 20 °C
¼ 0.18 min
)1
; k’
on, 37 °C
¼ 0.23 min
)1
).
(D) IN–DNA complexes are stable throughout the time-course of
3¢-processing. Binding of IN to fluorescein-labelled U5-duplex was
monitored by fluorescence anisotropy for 5 h at 37 °C. In all experi-
ments, DNA and IN concentration were 3 and 100 n
M, respectively.
M. Smolov et al. Single-turnover kinetics of HIV-1 integrase
FEBS Journal 273 (2006) 1137–1151 ª 2006 The Authors Journal compilation ª 2006 FEBS 1139
phase is comparable with the initial velocity (v
i
)ina
Michaelis–Menten enzyme reaction although E S
(single-turnover conditions). As standard Michaelis–
Menten formalism is not applicable in the case of
IN for quantitative analysis of the 3¢-processing kin-
etics, we used a modified formalism corresponding to
concentration conditions in which E S, according
to the enzymatic model presented in the Experimen-
tal Procedures. As the equilibrium and kinetic
parameters were not steady-state parameters, we
called them K
m
¢ and k
cat
¢, respectively. Under condi-
tions of catalyst excess, k
cat
¢ is a single-turnover rate
corresponding to the actual cleavage reaction which
is not affected by subsequent steps such as, for
instance, limited release of product (the cleavage
reaction accounts for all events that precede and
include the chemistry step). Despite the apparent lin-
earity of phase II, the time-course of product forma-
tion (phases II + III) actually corresponds to an
exponential law (see Eqn 11; the reason why phase II
displays apparent linearity is explained below).
(Equations 1 to 13 are given in the Experimental
Procedures below.) The first-order kinetic constant
(called k
obs
in Eqn 9) is obtained by directly fitting
data to a single exponential equivalent to Eqn (11)
[19–21]. The dependence of k
obs
values on [IN]
allows parameters K
m
¢ and k
cat
¢ to be determined
according to Eqns (9) and (10). Directly fitting the
hyperbolic curve (Fig. 2A, k
obs
as the function of
[IN]
0
) according to Eqn (9) gave K
m
¢ and k
cat
¢ values
of 26 nm and 0.004 min
)1
, respectively. The plot of
1 ⁄ k
obs
as a function of 1 ⁄ [IN]
0
gave a straight line
(Fig. 2A, inset) in agreement with Eqn (10) and sim-
ilar K
m
¢ and k
cat
¢ values were derived from this plot
(30 nm and 0.0045 min
)1
, respectively). Comparison
between the first-order kinetic constants for DNA
binding and catalytic steps (0.23 min
)1
, Fig. 1C and
0.004 min
)1
, Fig. 1B, respectively) indicates that the
catalytic reaction was very slow compared with the
DNA-binding step. Moreover, because the k
cat
¢ value
is very low, K
m
¢ is a good estimation of the K
d
value (quasiequilibrium assumption). Indeed, 26–
30 nm is close to values obtained previously in
DNA-binding assays [17]. The IN concentration was
varied between 5 and 200 nm in Fig. 2A because, in
this concentration range, the 3¢-processing activity
increased as the IN concentration increased. In fact,
we found that the activity was maximal at 250 nm
and then decreased dramatically as concentration
increased (Fig. 2B). The low 3¢-processing activities
of IN at protein concentrations > 250 nm can be
ascribed to IN aggregation, as suggested previously
[16,22].
Insights into the linear phase (phase II)
Because the curve in Fig. 1B approximates to a
straight line in phase II, we were interested in under-
standing the apparent Michaelis–Menten behaviour of
IN, despite the enzyme concentration being so much
higher than the DNA substrate concentration. This is
mathematically possible if k
cat
¢ is sufficiently low given
d[product] ⁄ dt ¼ constant even in the absence of a
0 50 100 150 200
0.000
0.001
0.002
0.003
0.004
0.005
k
bos
(m ni
1-
)
[IN] (nM)
[IN] (n
M)
0.00 0.08 0.16 0.24
0
500
1000
1500
2000
/1k
b
o
s
m(ni)
1/[IN] (nM
-1
)
A
0 1000 2000 3000 4000 5000
0.0
0.2
0.4
0.6
0.8
M)n(]tcudorP[
B
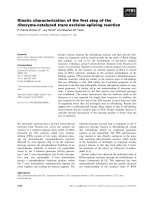
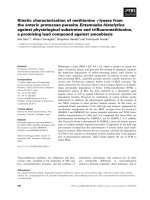
Fig. 2. Influence of the IN concentration on the 3¢-end processing
efficiency. (A) Determination of K
m
¢ and k
cat
¢ parameters by plotting
k
obs
¼ f([IN]). IN concentration was varied between 5 and 200 nM.
The 3¢-processing reaction was allowed to proceed for either
36 min (filled circles) or 60 min (unfilled circles). DNA product con-
centration was measured as described in Experimental Procedures.
K
m
¢ (26 nM)andk
cat
¢ (0.004 min
)1
) were estimated using Eqn (9).
The inset shows 1 ⁄ k
obs
¼ f(1 ⁄ [IN]). This plot was also fitted accord-
ing to Eqn (10) to estimate K
m
¢ (30 nM)andk
cat
¢ (0.0045 min
)1
).
(B) Influence of the IN concentration on the processing activity. IN
(5 n
M to 5 lM) was incubated with 3 nM DNA substrate for 1 h at
37 °C. The linear regression shown in (A) was obtained from the
bell-shaped dose–response, by selecting data from the increasing
phase (corresponding to IN concentrations between 5 and 200 n
M
inclusive).
Single-turnover kinetics of HIV-1 integrase M. Smolov et al.
1140 FEBS Journal 273 (2006) 1137–1151 ª 2006 The Authors Journal compilation ª 2006 FEBS
steady-state (Eqn 13). Therefore, we investigated the
influence of the k
cat
¢ value on the linear phase (pha-
se II) using simulation analysis to determine whether
the experimental k
cat
¢ was compatible with this hypo-
thesis. The dependences of ES (IN*DNA
S
) and prod-
uct (DNA
P
) concentrations on time obey Eqns (7) and
(11), respectively, and were simulated using two differ-
ent k
cat
¢ values (Fig. 3). The k
cat
¢ value used in the first
simulation (light grey) was the value found experiment-
ally (0.004 min
)1
), whereas an arbitrary higher k
cat
¢
value of 0.02 min
)1
was used in the second simulation
(dark grey). All other parameters were identical in
both simulations (see legend to Fig. 3). The first simu-
lation using k
cat
¢ ¼ 0.004 min
)1
shows that the time-
course of product formation approximates to a
straight line during approximately the first hour
(Fig. 3B). This approximation is not valid beyond
80 min (Fig. 3A). Taking into account that the lag
phase was not simulated, this result is consistent with
the experimental duration of phase II (Fig. 1B). The
expected concentration of IN*DNA
S
complex as a
function of time, is shown in Fig. 3C,D. These plots
show that the product concentration increases linearly
with time as long as the ES concentration does not
decrease below 20% of the initial value. For larger
decreases (when ES cannot be considered as constant
with time), the time-course of product formation
becomes strongly nonlinear. We verified that the time
range for which the approximation ES ¼ constant is
valid depends directly on the value of k
cat
¢. In the sec-
ond simulation with k
cat
¢ ¼ 0.02 min
)1
the resulting
product formation over time was clearly nonlinear
(Fig. 3A,B, dark grey), corresponding to more stand-
ard first-order behaviour as expected under single-turn-
over conditions. This nonlinear behaviour is related to
a rapid decrease in the ES concentration which exceeds
20% at t ¼ 10 min (Fig. 3C,D). In conclusion, the
apparent linear phase, as found experimentally under
conditions of enzyme excess, originates in the low sin-
gle-turnover rate constant (k
cat
¢) because ES can be
considered constant in this phase. This is compatible
with the rapid formation of ES (0.23 min
)1
) compared
with the product formation (0.004 min
)1
). The expo-
nential term of Eqn (12) can be neglected when k
cat
¢ is
low and d[DNA
P
] ⁄ dt can be considered constant
according to Eqn (13). The simulations indicate that
simplification of Eqn (12) to Eqn (13) and the phase II
duration are compatible with the experimental k
cat
¢
value. In conclusion, the linear phase does not neces-
sarily indicate a steady-state multiple-turnover mechan-
ism. In the case of IN, it corresponds to a single-
turnover reaction with a slow rate for the chemical
step. This ‘linear’ phase is apparent and actually cor-
responds to an exponential phase.
We verified that under our experimental conditions,
inactive enzymes were not in excess over active
enzymes. In such a case, the situation could become
similar to a standard Michaelis–Menten condition in
which S E. This possibility has been carefully
addressed in Mn
2+
-dependent reactions previously
[23,24]. Here, the presence or otherwise of large
amounts of inactive IN was assessed using the general
Cornish–Bowden relation [25]:
d½DNA
P
dt
¼
k
cat
½IN
0
ð½DNA
0
½DNA
P
Þ
K
m
þ½IN
0
þð½DNA
0
½DNA
P
Þ
ð14Þ
Eqn (14) is valid in two cases: either [IN]
0
[DNA]
0
(single turnover) or [DNA]
0
[IN]
0
(multiple turn-
A
C
B
D
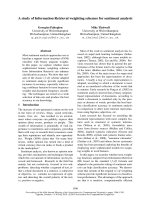
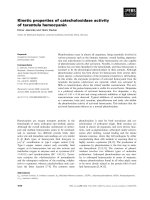
Fig. 3. Simulation analysis of the processed
DNA product formation and of the change in
the IN–DNA substrate complex concentra-
tion during the reaction. Product formation
(A, B) and IN–DNA substrate complex con-
centration (C, D) were simulated using
Eqns (11) and (7), respectively, covering the
time range 0–400 min (A, C) or 0–60 min
(B, D). Kinetic simulations were performed
using either k
cat
¢ as found experimentally
(0.004 min
)1
; light grey) or an arbitrary
higher k
cat
¢ value (0.02 min
)1
; dark grey). All
the other parameters were identical in both
simulations: IN and DNA substrate concen-
trations were 150 and 3 n
M, respectively.
The K
m
¢ value was 30 nM (estimated from
Fig. 2A).
M. Smolov et al. Single-turnover kinetics of HIV-1 integrase
FEBS Journal 273 (2006) 1137–1151 ª 2006 The Authors Journal compilation ª 2006 FEBS 1141
over). Under single-turnover conditions, this expres-
sion leads to the first-order kinetic constant k
obs
as
defined in Eqn (9). In that case, k
obs
depends hyperbol-
ically on enzyme concentration. Nevertheless, one pos-
sibility is that the concentration of active IN (IN
a
)in
reaction mixtures could be much lower than the con-
centration of total IN. Assuming [IN
a
]
0
<< [DNA]
0
,
the observed kinetics of IN could be due to steady-
state multiple turnovers of a small number of active
molecules. Because [IN
a
]
0
¼ c [IN]
0
<< [DNA]
0
<<K
m
(where c represents the fraction of active enzymes),
k
obs
can be simplified:
d½DNA
P
dt
¼ k
obs
ð½DNA
0
½DNA
P
Þ ð15Þ
with
k
obs
¼
k
cat
½IN
a
0
K
m
¼
k
cat
c½IN
0
K
m
¼ cte ½IN
0
First-order behaviour also occurs but k
obs
displays a
linear dependence on IN concentration. As shown in
Fig. 2, k
obs
versus the enzyme concentration clearly
displays nonlinear behaviour, suggesting that inactive
IN is only a minority species in the assay. Different
results have been reported previously under Mn
2+
conditions in which active fraction of enzyme was esti-
mated to be between 5 and 10% of the total enzyme
[23,24]. The discrepancy may originate from the metal-
lic cofactor used or the purification procedures. Our
results ruled out the presence of a constant fraction of
inactive IN but cannot rule out the possibility that the
c factor itself depends on the IN concentration as it
could be the case for aggregation reasons. In order to
discriminate between single- and multiple-turnover
mechanisms, 3¢-processing activity was tested under
conditions of excess DNA substrate.
IN functions in single-turnover mode only
for 3¢-end processing
We addressed the question of whether IN can work in
cycling mode in the presence of an excess of DNA sub-
strate as our results under conditions of excess IN sug-
gested that the low k
cat
¢ value may be intrinsically a
limiting factor for multiple turnover. Formation of
cleaved DNA was monitored over a wide range of sub-
strate concentrations, 0.5–300 nm, in the presence of
100 nm IN (Fig. 4A). Product formation increased
with DNA substrate concentration between 0 and
50 nm and then reached a plateau. Furthermore, an
increase in substrate concentration did not lead to a
significant increase in the formation of processed
DNA. Under all experimental conditions, the product
concentration was consistent with the estimated frac-
tion of complexes using binding isotherm parameters
[17] and the k
cat
¢ value (this study) indicating that most
complexes formed initially were active.
The formalism described above allows prediction of
the product formation kinetics as the substrate concen-
tration increases: in phase II, the exponential term of
Eqn (12) is negligible, and v
i
¢ ¼ d[DNA
P
] ⁄ dt is constant
and simply related to the total DNA concentration by
Eqn (13). A linear relationship is then expected between
v
i
¢ and total DNA concentration. The time-course of the
reaction was then studied (Fig. 4B) using various initial
DNA substrate concentrations (corresponding to the
increasing phase in Fig. 4A). The 3¢-processing rates
(v
i
¢) obtained for DNA substrate concentrations
between 0.5 and 25 nm were then calculated in the
quasi-initial velocity phase using linear regression
(between 20 and 60 min) and plotted against the initial
substrate concentration (Fig. 4C). In agreement with
theory, the activity increased linearly with substrate con-
centration. It obeys Eqn (13) and the slope is compatible
with K
m
¢ and k
cat
¢ values as calculated from Eqns (9) or
(10). Hence, the dependence of product formation on
the initial substrate concentration, up to 25 nm,as
seen in Fig. 4A, is in good agreement with the kinetic
model. The plateau in Fig. 4A indicates that no turn-
over can take place and that an excess concentration of
DNA substrate over enzyme cannot increase the number
of cleaved DNA molecules for a given IN concentration.
Furthermore, the curve reached a plateau at 50 nm
DNA in the presence of 100 nm IN. We conclude that it
is most likely that two IN protomers per DNA substrate
are necessary for 3¢-processing activity.
Taken together, these results indicate that the
Mg
2+
-dependent 3¢-processing reaction characterized
by the hyperbolic response under conditions of excess
enzyme, as shown in Fig. 2A, actually corresponds to
a single-turnover mechanism. Consequently, Michael-
is–Menten analysis is not appropriate for studying the
3¢-processing kinetics and the catalysis kinetics of IN
must be interpreted with caution. It is important to
note that hyperbolic (Eqn 9) and linear (Eqn 10) rela-
tionships as found under single-turnover conditions are
distinct from standard steady-state plots. Conse-
quently, using Lineweaver–Burk plots (1 ⁄ v
i
versus 1 ⁄ S)
to fit single-turnover data may lead to errors in the
estimation of equilibrium and kinetic constants. For
instance, the slope of the single turnover (s-t)
relationship 1 ⁄ v
i¢, s-t
¼ f (1 ⁄ S) derived from Eqn (13) is
equal to k
01
cat
fðK
0
m
½IN
1
0
Þþ1g;which is differ-
ent from the standard Lineweaver–Burk slope
ð¼ K
m
k
1
cat
½IN
1
0
Þ: Assuming small errors in the
Single-turnover kinetics of HIV-1 integrase M. Smolov et al.
1142 FEBS Journal 273 (2006) 1137–1151 ª 2006 The Authors Journal compilation ª 2006 FEBS
determination of the catalytic constant (k
cat
¢ k
cat
),
the K
m
value calculated from a Lineweaver–Burk plot
of single-turnover data is systematically overestimated
by the concentration of total enzyme because K
m
¼
K
m
¢ + [IN]
0
.
Identification of the limiting factors for
steady-state multiple turnover of IN
Taking into account the standard duration of 3¢-pro-
cessing assays, the absence of turnover in the case of
IN originates primarily in the low k
cat
¢ value. The
amount of IN–DNA complex, which did not decrease
significantly during the time-course of the reaction
(Fig. 1D), suggests that subsequent turnovers may
also be limited by tight binding of the enzyme to the
reaction product. Thus, we investigated the binding
properties of IN to DNA substrate and processed
DNA. Binding isotherms for IN–DNA interactions
were studied using steady-state fluorescence anisotropy
with Fl–U5B ⁄ U5A and Fl–U5B-2 ⁄ U5A duplexes
which mimic the U5 viral DNA substrate and proc-
essed product, respectively (Fig. 5). No significant
difference was observed in the affinity of IN for sub-
strate and product: interactions of IN with both DNAs
were characterized by apparent K
d
values of 40–60 nm.
These values were not sensitive to temperatures
between 25 and 37 °C (data not shown). Therefore, the
tight binding of IN to the processed DNA product
also accounts for the single-turnover property of IN
A
B
C
0 50 100 150 200 250 300
0
1
2
3
4
rP[o cudt
M
n(])
[U5] (n
M
)
0102030405060
0.0
0.5
1.0
1.5
[
tcudorP
]
)Mn(
Time (min)
0 5 10 15 20 25
0.00
0.02
0.04
0.06
0.08
sPe aitini-odular)nim/
M
n(et
[U5] (n
M
)
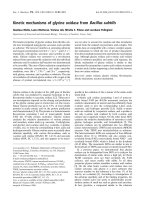
Fig. 4. Dependence of the processed product formation on DNA
substrate concentration. (A) Cleavage activity of IN with various
concentrations of DNA substrate. 0.5–300 n
M of U5-duplex was
incubated for 1 h at 37 °C with 100 n
M IN in the presence of
7.5 m
M MgCl
2
.3¢-processing reactions were stopped and reaction
products were analysed as indicated in Experimental procedures.
Strand transfer products were constant versus substrate concentra-
tion (5% of total product). (B) Time-course analysis of the cleavage
reaction with various concentrations of DNA substrate. The IN con-
centration was 100 n
M. DNA substrate concentrations were 0.5 nM
(filled squares), 1 nM (unfilled squares), 1.5 nM (filled circles), 3 nM
(unfilled circles) or 5 nM (filled triangles). Reactions were quenched
at various times and product formation was quantified. (C) Pseudo
initial rate (v
i
¢) as a function of DNA substrate concentration. v
i
¢ val-
ues were calculated from Fig. 4B in the linear phase (in the 20–
60 min time range).
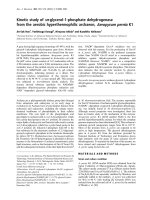
Fig. 5. Binding isotherms for IN–DNA substrate and IN–DNA prod-
uct interactions. Various IN concentrations were preincubated with
3n
M of DNA substrate (black squares) or DNA product (grey cir-
cles) for 20 min at 25 °C to reach equilibrium. Steady-state fluores-
cence anisotropies (r) were then recorded at the same
temperature. Dr ¼ r
function([IN])
) r
free DNA
. The DNA-binding buffer
contained 20 m
M Hepes (pH 7.2), 20 mM NaCl, 1 mM dithiothreitol
and 7.5 m
M MgCl
2
. Oligonucleotide U5A (21-mer) was annealed to
fluorescein-labelled oligonucleotides Fl–U5B (21-mer) or Fl–U5B-2
(19-mer) to give DNA substrate and processed DNA product,
respectively.
M. Smolov et al. Single-turnover kinetics of HIV-1 integrase
FEBS Journal 273 (2006) 1137–1151 ª 2006 The Authors Journal compilation ª 2006 FEBS 1143
when DNA substrate is in excess. This explains why
the total amount of IN–DNA complex measured
experimentally does not decrease while the 3¢-process-
ing reaction occurs (Fig. 1D), whereas the simulation
suggests a significant decrease of ES concentration
(Fig. 3C). The model for the 3¢-processing reaction,
E+S« E*S fi P should then be replaced by the
model: E + S « E*S fi E*P, where S and P are the
DNA substrate and the processed DNA product,
respectively. Indeed, the amount of the IN–DNA
complex determined by anisotropy is constant because
it includes both the complexes of IN with its DNA
substrate and those with the DNA product. Note that
only a small amount of strand transfer product was
detected under our experimental conditions ( 5%, see
Fig. 1A); this was not sufficient to determine if, at
least in vitro, the release of IN for subsequent recycling
can be trigged by the second catalytic step.
Stability of IN during the 3¢-processing reaction
Because the cleavage rate constant is low, one may
reasonably imagine that denaturation of IN might
compete with the 3¢-processing reaction and thus be
another cause of the limited multiple turnover. To
assess the stability of IN during the reaction, IN
was preincubated under different conditions and tes-
ted for activity after varying preincubation times.
Two ligands of IN (DNA substrate and Mg
2+
) were
tested for their ability to protect IN from inactiva-
tion. Three different mixtures were incubated at
37 °C in the buffer used for activity assay: (a) IN
alone, (b) IN in the presence of Mg
2+
but without
U5-duplex, and (c) IN in the presence of U5-duplex
but without Mg
2+
. Aliquots were taken from the
mixtures after various incubation times and the
3¢-end processing was induced by addition of both
the U5-duplex and Mg
2+
in (a), only the U5-duplex
in (b) and only Mg
2+
in (c). The 3¢-processing effi-
ciency depended strongly on the duration of the pre-
incubation, and decreased progressively as this time
increased (Fig. 6). Comparison between the three
different IN mixtures indicates that Mg
2+
strongly
stabilizes IN against inactivation, with a time of
half-inactivation of 222 min compared with 111 min
in the absence of Mg
2+
(Fig. 6A,B). The DNA sub-
strate also had a significant stabilizing effect on IN,
albeit more modest than that of Mg
2+
(Fig. 6C). As
shown in Fig. 6C, IN preincubated in the presence
of DNA substrate was more active in the processing
reaction (2.6-fold higher) than IN preincubated alone
or with Mg
2+
. This is consistent with kinetic studies
(Fig. 1B) and confirms that preincubation of IN with
0 200 400 600 800 1000
0.00
0.04
0.08
0.12
[
tcudorP
]
M
)
n(
Time (min)
T
1/2
= 222 ± 16 min
0 200 400 600 800 1000
0.00
0.04
0.08
0.12
[
tcudorP
]
M
)n(
Time (min)
T
1/2
= 111 ± 15 min
A
B
C
0 200 400 600 800 1000
0.00
0.08
0.16
0.24
0.32
[
tcudorP
]
M
)
n(
Time (min)
T
1/2
= 154 ± 10 min
Fig. 6. Dependence of IN stability upon incubation conditions. IN
(100 n
M) was incubated at 37 °C in a buffer containing 20 mM
Hepes (pH 7.5) and 10 mM dithiothreitol. (A) IN was incubated
alone. After various incubation times, the 3¢-processing reaction
was allowed to proceed by adding U5-duplex (3 n
M final concentra-
tion) and MgCl
2
(7.5 mM final concentration). (B) IN was incubated
in the presence of 7.5 m
M MgCl
2
. After various incubation times,
the U5-duplex (3 n
M final concentration) was added to start 3¢-pro-
cessing. (C) IN was incubated in the presence of 3 n
M U5-duplex.
After various incubation times, MgCl
2
(7.5 mM final concentration)
was added to start 3¢-processing. In all cases, the 3¢-processing
reaction was allowed to proceed for 15 min. Both DNA and Mg
2+
cofactor protected IN from inactivation (T
1 ⁄ 2, IN alone
¼ 111 min;
T
1 ⁄ 2, IN+DNA
¼ 154 min; T
1 ⁄ 2, IN+Mg
¼ 222 min).
Single-turnover kinetics of HIV-1 integrase M. Smolov et al.
1144 FEBS Journal 273 (2006) 1137–1151 ª 2006 The Authors Journal compilation ª 2006 FEBS
DNA allows the DNA-binding step (phase I) to
occur, even in the absence of any divalent cation.
This interpretation seems reasonable as it has previ-
ously been shown that IN did not require a metal
ion cofactor to bind to its DNA substrate [26].
Although it was not possible to directly assess IN
stability under functional conditions, our results sug-
gest that the effects of DNA and Mg
2+
on IN sta-
bility are additive or synergic, allowing most of the
DNA-bound IN to perform one 3¢-processing reac-
tion. Indeed, the complex between IN and one viral
DNA end was stable for 5 h under enzymatic
reaction conditions (Fig. 1D). After this time, the
number of complexes decreases slowly (T
1 ⁄ 2
23 h;
data not shown). This phenomenon is unrelated to
the catalytic activity as similar results were obtained
with nonviral DNA sequences (not shown) and is
probably the result of DNA release due to IN inac-
tivation. Moreover, the fraction of processed product
at the end point (Fig. 1B) was 80%, and taking
into account for the strand transfer products
( 5%), the total activity (3¢-processing + strand
transfer products) is in good agreement with the cal-
culation of the fractional saturation (85–90%) based
on published IN ⁄ DNA-binding isotherm parameters
[17]. Thus the substrate that is not processed origin-
ates mainly from the remaining free DNA substrates.
This indicates that most of the IN*DNA
S
complexes
initially formed are able to support at least one
round of reaction and there were few or no (< 5%)
dead-end complexes, which may be due to the pre-
sence of inactive but DNA-binding forms of IN at
the beginning of the reaction. Figure 1B indicates
that, on average, one IN molecule processes one
DNA substrate in 100 min, which corresponds to
the time required to perform 50% of the total reac-
tion. The stability of IN in the presence of Mg
2+
and the fact that this stability might be further
increased when IN is bound to DNA suggest that
inactivation does not greatly interfere with 3¢-pro-
cessing during the first reaction turnover, although it
may represent a limiting factor for subsequent turn-
overs.
Discussion
The rate of viral DNA cleavage by IN was investigated
under two different conditions: enzyme excess and
DNA substrate excess. IN displayed only limited turn-
over for cleavage of viral DNA, and excess viral DNA
did not improve enzyme performance or the amount
of processed products. Thus IN exhibits intrinsic sin-
gle-turnover properties at least for the 3¢-processing
reaction. The catalytic constant, which represents the
chemical cleavage rate constant as measured in single-
turnover experiments, is very low (0.004 min
)1
). The
single-turnover property of IN at a saturating DNA
substrate concentration originates primarily from this
low value. In addition, analysis of binding isotherms
of IN to both viral DNA substrate and product
strongly suggests that tight binding of the enzyme to
the reaction product is also a limiting factor for subse-
quent turnovers. Finally, our data show that the inacti-
vation process does not significantly influence the first
reaction round although it could be a limiting factor
for multiple turnover.
Our kinetic study shows that an excess of DNA over
IN did not result in more processed products com-
pared with conditions in which IN is in excess over
substrate, this is in agreement with a previous study
[27]. Maximum reaction yield is therefore controlled
only by the initial IN concentration, and the final con-
centration of product is never higher than the catalyst
concentration, showing that IN exhibits limited turn-
over on cleavage of its DNA substrate. Moreover, at
substrate concentrations above K
d
(or K
m
¢), the
maximum activity was reached for E : S ratio of 2 : 1,
suggesting that dimeric IN is the functional unit for
3¢-processing of each viral DNA end. We previously
characterized oligomeric states of IN free in solution
as well as bound to DNA [16,28,29]. Under the typical
experimental conditions used here, DNA-free IN was
found as tetramers and the oligomeric state was shifted
toward a monomer–dimer equilibrium when IN bound
to one viral DNA extremity at 37 °C. Accordingly,
our enzymatic data reflect a reaction stoichiometry of
two protomers per DNA substrate suggesting that a
dimeric form is necessary and sufficient to catalyse the
3¢-processing reaction at one extremity. Most likely, a
dimer of dimers is responsible for the concerted integ-
ration process when two viral DNA extremities are in
close proximity as proposed by Gao et al. [30]. These
results are corroborated by recent findings suggesting
that IN dimers are competent for the 3¢-processing
reaction, whereas tetramers are competent for integra-
tion [31]. For a given initial DNA concentration below
the K
d
value, as usually used in standard 3¢-processing
assays, an IN : DNA
S
ratio > 2 : 1 is required for
optimal activity (Fig. 2B). The increasing phase for
ratio up to 70 : 1 is simply due to the fractional sat-
uration function that increases as the IN concentration
increases. Nevertheless, for very high ratio (> 70), the
activity is lower, most probably due to aggregation
[22]. This is also consistent with previous data showing
that aggregation occurs mainly above an IN concen-
tration of 200–300 nm [16].
M. Smolov et al. Single-turnover kinetics of HIV-1 integrase
FEBS Journal 273 (2006) 1137–1151 ª 2006 The Authors Journal compilation ª 2006 FEBS 1145
Multiple turnover of Rous sarcoma virus (RSV) IN
using Mn
2+
as the cofactor has been described previ-
ously for 3¢-processing [32]. In contrast, in the presence
of Mg
2+
, another study with RSV IN showed that
only 5% of DNA substrates are processed in 1 h using
an excess of enzyme over substrate [10], which is more
consistent with our data. Using our HIV-1 IN prepar-
ation under either Mg
2+
or Mn
2+
conditions, we did
not find any significant quantitative difference in the
time-course of the 3¢-processing product formation,
suggesting similar single-turnover rate constants (data
not shown), although we confirmed that the Mn
2+
-
dependent activity is less specific than the Mg
2+
-
dependent activity. Moreover, the anisotropy study
suggesting the tight binding of IN to DNA product (as
shown in Fig. 1D) displays no difference between
Mg
2+
and Mn
2+
experiments (data not shown).
Therefore, it appears that IN exhibits single-turnover
properties irrespective of the metallic cofactor. How-
ever, catalytic turnover of IN has been described in
several studies of the disintegration reaction using Y
or dumbbell substrates and Mn
2+
[33–35]. The appar-
ent discrepancy may be a consequence of the difference
in the nature of the DNA substrate. Disintegration is
known to be less specific than 3¢-processing because:
(a) single mutants (for instance K156E or K159E) [36]
and truncated proteins, inactive for 3¢-processing or
the joining reaction, remain competent for disintegra-
tion; and (b) a strict requirement of Mn
2+
or a large
preference for Mn
2+
over Mg
2+
is generally observed
in disintegration tests with truncated or full-length
IN, respectively. In addition, Gerton & Brown [37]
have shown that the core domain of IN can turnover
faster than full-length IN in disintegration assays.
Thus, it appears that multiple turnover of IN is
dependent on conditions that disfavour stringency or
reaction specificity.
We now consider the molecular basis for the absence
of steady-state turnover by IN for 3¢-processing. The
steady-state rate constant k
cat
(not measurable in the
case of IN) is a composite constant including binding
and docking of the ES complex, chemistry, product
dissociation and subsequent recycling steps, whereas
the single-turnover rate constant k
cat
¢ monitors only
events that precede and include chemistry. The k
cat
¢
value is therefore independent of the product release,
which is not monitored under single-turnover condi-
tions. The low value of k
cat
¢ (0.004 min
)1
) is compat-
ible with most studies of 3¢-processing activity. In
some cases, faster reaction rates have been reported
(up to 10· faster) and this is generally related to the
presence of cosolvent or detergent in the reaction buf-
fer. There are several possible explanations for such a
slow catalysis rate, which represents, together with the
limited product release, the main limiting step for mul-
tiple turnover. First, it is unlikely that DNA binding is
limiting even if it is slow. This step is responsible for
the sigmoidal shape of the product formation versus
time plot (phase I) but is over after 15–20 min. There-
fore, all the IN–DNA substrate complexes are already
formed at the beginning of the linear phase (phase II).
Indeed, preformation of complexes at a temperature
nonpermissive for activity or at 37 °C in the absence
of Mg
2+
abolished the lag phase without changing sig-
nificantly the k
cat
¢ value calculated from phase II.
Moreover, the anisotropy approach reveals the non-
specific nature of IN–DNA interactions because
DNA-binding kinetics are similar, irrespective of the
sequence and, consequently, cannot discriminate
between specific (or catalytically active) and nonspe-
cific (or catalytically inactive) complexes when IN
binds to the HIV DNA substrate. Taken together,
these results suggest that the DNA-binding step corres-
ponding to phase I accounts for the formation of non-
specific complexes and that, at the beginning of
phase II, the majority of complexes are nonspecific.
The limiting step occurs after the nonspecific DNA
binding and may correspond to a step before the
chemistry or the chemistry itself. It is important to
underline that the single-turnover behaviour of IN (as
shown in Fig. 1B) highlights a distribution of reaction
velocities in which k
cat
¢ represents the average single-
turnover rate constant: Fig. 1B shows that 50% of the
DNA substrate is converted into product before t ¼
100 min and 50% is converted after this time. It is
unlikely that the chemistry step itself (i.e. the nucleo-
philic attack of the phosphodiester bond by a water
molecule) would be responsible for such a distribution.
Most likely, this distribution of velocities corresponds
to an equilibrium displacement ([inactive com-
plex] « [ ] « [active complex]) with the presence of a
minority of active complexes at the beginning of the
reaction (multiple turnovers of the most efficient com-
plexes are then limited by the high stability of the IN–
DNA product complexes). Thus, it is hypothesized
that a step following DNA binding of IN but prior to
cleavage is rate limiting. This step corresponds to a
relaxation step that leads to a specific and catalytically
competent conformation of the IN–DNA complex and
the low single-turnover rate constant (k
cat
¢) may then
originate from the slow conversion from the inactive
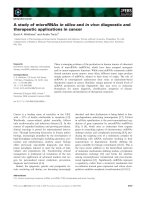
state to the active state. We propose three different
models to explain slow kinetics in one round of cata-
lysis (Fig. 7). Models 1 and 2 are based on the intrinsic
ability of IN to bind DNA in two binding modes, spe-
cific and nonspecific. Model 3 does not address the
Single-turnover kinetics of HIV-1 integrase M. Smolov et al.
1146 FEBS Journal 273 (2006) 1137–1151 ª 2006 The Authors Journal compilation ª 2006 FEBS
problem of nonspecific ⁄ specific partition but, rather,
a slow conformational change of IN or ⁄ and DNA
within the complex that may be rate limiting.
It is well known that there is no sequence specificity
for the DNA-binding step of IN although the 3¢-pro-
cessing reaction requires specific sequences within the
U3 or U5 viral DNA ends [9]. Sequence specificity is
thus strictly required at the catalytic level but not for
the DNA-binding step. Consequently, the nonspecific
binding mode of IN which is essential for the integra-
tion reaction may be detrimental to the 3¢-processing
reaction, at least in vitro. The nonlinear dependence
of k
obs
on IN concentration (Fig. 2A) precludes the
possibility that the assay contains a large proportion
of denaturated forms of IN that originate from the
purification procedure, although this approach cannot
rule out the presence of a binding but catalytically
inactive form of IN [21]. However, our data show that
IN bound in a nonspecific manner is not definitively
trapped as most complexes initially formed, even if
nonproductive on a short timescale, are potentially act-
ive. The search for the cleavage site could be either
slow linear diffusion along the DNA substrate (model
1, Fig. 7A), in a similar manner to that described for
restriction endonucleases and methyltransferases
[38,39] or via a slow relaxation process between two
states (model 2, Fig. 7B), one corresponding to viral
DNA bound at the ‘nonviral’ site (normally occupied
by the target DNA), the other corresponding to viral
DNA bound at the ‘viral’ site (specific site). Several
studies on mutants and chimeric IN strongly support
the existence of these two sites in the catalytic core
domain [40,41]. Using a bifunctional diketo acid deriv-
ative efficiently inhibiting both 3¢-processing and
strand transfer reactions, Pommier and co-workers
have shown that the two sites probably overlap [42] in
agreement with molecular docking studies suggesting
that these sites are close to each other within the cata-
lytic core [43,44]. Hence, they are close enough inside
the active site to allow viral DNA displacement to the
viral site when initially bound to the nonviral site.
Models 1 and 2 are both compatible with the ability of
IN to bind nonspecific sequences of DNA tightly and
are consistent with a previous study suggesting a rapid
and nonspecific DNA binding of IN followed by a
slow and specific catalysis step [45]. Moreover, faster
single-turnover kinetic rates were found for the disin-
tegration reaction than for 3¢-processing (2–3 orders of
magnitude higher) [46], reinforcing the idea that the
limiting step is related to specificity requirements.
However, it seems unlikely that either of these mecha-
nisms occurs in vivo because IN is probably already
positioned at the ends of the viral genome in the
preintegration complex (PIC) context. Model 3
(Fig. 7C) involves a rate-limiting conformational
change within the IN–DNA complex. Such an induced
fit may be strictly required before catalytic cleavage
can proceed. Cross-linking data suggest that complexes
obtained with DNA substrate and those with product
have different conformations [30]. This suggests that a
conformation change may occur within the IN–DNA
complex, although there is no clear evidence that such
nonviral
viral
A
B
CAGT
nonviral
viral
IN
Catalytic
core of IN
inactive
active
C
inactive active
ININ
Fig. 7. Schematic diagram of three models compatible with the for-
mation of the catalytically competent viral IN–DNA complex.
(A) DNA scanning by linear diffusion (model 1). Owing to the ability
of IN to bind nonspecifically but tightly to DNA, the majority of
complexes initially formed are nonspecific and nonproductive; linear
diffusion allows the appropriate positioning of IN onto DNA extrem-
ity for catalysis. (B) Equilibrium between two DNA-bound forms of
IN (model 2). The viral DNA extremity is bound either to the non-
specific site (nonviral) (upper, inactive complex) or the specific site
(viral) (lower, active complex). (C) Induced fit of the IN onto the
DNA substrate that leads to the active complex conformation
(model 3).
M. Smolov et al. Single-turnover kinetics of HIV-1 integrase
FEBS Journal 273 (2006) 1137–1151 ª 2006 The Authors Journal compilation ª 2006 FEBS 1147
a conformational change is a prerequisite or a conse-
quence of the cleavage activity and then actually
occurs when the complex is initially formed with the
DNA substrate. Aggregation properties or the multi-
meric status of IN may be also critical factors that
explain the low k
cat
¢ value found in vitro. In this case,
the rate-limiting step in model 3 may correspond to
any modification in the quaternary structure of IN
prior to catalysis process such as the organization
of the competent dimeric form for the 3¢-processing
reaction.
Our analysis of binding isotherms indicates that IN
binds the viral DNA substrate and the cleaved DNA
product equally well. The strong affinity of IN for its
reaction product also limits enzyme turnover in vitro
although it may be a functional advantage in vivo.
Numerous enzymes are characterized by rate-limiting
product dissociation. Usually, this causes a burst of
product formation (presteady-state phase which
accounts for the first turnover) under multiple-turnover
conditions. Consistently, the discrepancy between k
cat
(multiple turnover) and k
chemistry
(single turnover, also
called k
cat
¢ here) values, where k
chemistry
exceeds k
cat
,
indicates that a step that follows chemistry such as
product release is limiting. For instance, the DNA
repair enzymes Salmonella endonuclease V and
Escherichia coli mismatch uracil glycosylase are able
to support multiple-turnover only to a limited extent
[47,48]. These enzymes possess high affinity for their
reaction products, which strongly restricts any cycling
mode of catalysis. In most cases, the functional reason
for the tight binding of the reaction product to the cat-
alyst is not clear. In the case of IN, tight binding of
the protein to recessed viral DNA ends is obligatory in
the context of the HIV replication cycle: the 3¢-process-
ing of viral DNA ends is only the first reaction of the
overall integration process. In the cell, this reaction
can occur in the cytoplasm, whereas integration is
obviously nuclear. Consequently, for concerted integra-
tion, there must be a ternary complex with IN simulta-
neously bound to both the processed viral DNA
(donor) and the target DNA (acceptor). Thus, the
complex involving IN and viral DNA extremities must
be stable enough for the PIC to enter the nucleus and
subsequently integrate, although the 3¢-processing reac-
tion has already been completed. The fact that the
3¢-processing reaction product is trapped inside the
active site is functionally beneficial, as it optimizes
integration yield. Moreover, in addition to catalysis
and functional considerations, the stable nucleoprotein
complex might protect the DNA from degradation by
nucleases and also minimize the number of free DNA
ends, thereby limiting apoptotic responses.
With its inefficient cleavage and tight binding to
DNA product, IN is similar to other members of the
polynucleotidyl transferase family, including, for exam-
ple, transposases. These enzymes share a common
catalytic property, they have evolved to catalyse mul-
tiple-sequential steps (two in the case of IN and four in
the case of Tn5 transposase) in a single active site. A
multiple-step process implicitly requires tight binding of
reaction product after each chemical step to optimize
the overall process but dramatically limits turnover. The
poor efficiency or velocity of these enzymes is, however,
not detrimental to their function because a single trans-
position or integration event is biologically sufficient.
Experimental procedures
Oligodeoxyribonucleotides and integrase
Complementary oligonucleotides U5B, 5¢-GTGTGGAAAA
TCTCTAGCA
GT-3¢ and U5A, 5¢-ACTGCTAGAGATTT
TCCACAC-3¢, were synthesized using a 380B Applied Bio-
systems synthetizer by the standard cyanoethyl phosphoram-
idite procedure. Oligonucleotides Fl–U5B, Fl)5¢-GTGTGG
AAAATCTCTAGCA
GT-3¢ and Fl–U5B-2 Fl)5¢-GTGTGG
AAAATCTCTAGCA-3¢ (where Fl designates fluorescein)
were purchased from Eurogentec (Liege, Belgium). Terminal
nucleotides removed by IN during the 3¢-processing reaction
are underlined. All oligonucleotides were further purified on
an 18% denaturing acrylamide ⁄ urea gel. The detergent-free
recombinant IN protein was produced and purified as previ-
ously described [16].
32
P-labelling of U5-DNA
Ten picomoles of U5B oligonucleotide was 5¢-end labelled
with
32
P using 25 activity units of T4 polynucleotide kinase
and 50 lCi of [
32
P]ATP[cP] (3000 CiÆ mmol
)1
). T4 poly-
nucleotide kinase was inactivated by EDTA and heating at
65 °C for 5 min followed by enzyme extraction with phe-
nol ⁄ chlorophorm ⁄ isoamyl alcohol (25 : 24 : 1 v ⁄ v ⁄ v). An
equimolar quantity of complementary U5A oligonucleotide
was then added. The mixture was heated to 90 °C for
3 min and the U5-duplexes were annealed by slow cooling
to room temperature. The U5-duplexes were purified on
Micro Bio-Spin columns P-6 (Bio-Rad, Munich, Germany).
3¢-End processing activity
IN activity was studied by mixing IN and
32
P-labelled
U5-duplex in 20 lL of a buffer containing 20 mm Hepes
(pH 7.5), 10 mm dithiothreitol, 7.5 mm MgCl
2
at 37 °C.
Various concentrations of both DNA and IN, and incuba-
tion times were used (see indications in figure legends). The
reaction was stopped with 80 l L of a buffer containing
Single-turnover kinetics of HIV-1 integrase M. Smolov et al.
1148 FEBS Journal 273 (2006) 1137–1151 ª 2006 The Authors Journal compilation ª 2006 FEBS
9mm Tris ⁄ HCl (pH 7.5), 6 mm EDTA, 0.125 mgÆmL
)1
glycogene, 400 mm NaOAc. DNA fragments were precipita-
ted with ethanol, then suspended in loading dye (80% form-
amide, 0.05% bromophenol blue, 0.05% xylene cyanol) and
separated on a 20% polyacrylamide denaturing gel. Gels
were analysed on a STORM 840 PhosphorImager (Molecu-
lar Dynamics, Sunnyvale, CA, USA) and quantified using
image quant 4.1 software.
Analysis of kinetic data and determination
of apparent K
m
and k
cat
values (K
m
¢ and k
cat
¢)
For 3¢-processing kinetic study, the amount of 19-mer reac-
tion products was measured and quantified by gel electro-
phoresis and PhosphoImager scanning as described above.
Only a weak nonspecific endonucleotytic activity of IN was
observed under Mg
2+
conditions and strand transfer prod-
ucts were estimated to be ¼ 5% of total products (Fig. 1A).
Single turnover of the 3¢-end processing reaction with
excess of enzyme over DNA substrate was analysed accord-
ing to the following model:
IN þ DNA
S
()
k
1
k
1
IN DNA
S
!
k
0
cat
DNA
P
ð1Þ
where S and P designate substrate and product, respect-
ively. The conservation relationship for DNA substrate can
be written as:
½DNA
0
¼½DNA
S
þ½IN DNA
S
þ½DNA
P
ð2Þ
where [DNA]
0
represents the total concentration of
DNA. Moreover, vi
0
¼
d½DNA
P
dt
is constant in phase II
(pseudo-initial velocity phase) as observed experimentally
(see Fig. 1 and text). The observation of a linear phase
means that the ES complex can be considered to be con-
stant during this period. Thus,
v
0
i
¼ k
0
cat
½IN DNA
S
ð3Þ
and
d½IN DNA
S
dt
0 ð4Þ
Thus,
ð4Þ k
1
½IN½DNA
S
ðk
1
þ k
0
cat
Þ½IN DNA
S
¼0
and
K
0
m
¼
k
1
þ k
0
cat
k
1
¼
½IN½DNA
S
½IN
DNA
S
ð5Þ
Because [IN]
0
¼ [IN] + [IN*DNA] [IN] (when [IN]
0
[DNA]
0
), Eqn (5) can be rearranged as:
K
0
m
¼
k
1
þ k
0
cat
k
1
¼
½IN
0
½DNA
S
½IN
DNA
S
ð6Þ
From Eqns (2) and (6)
½IN DNA
S
¼
½DNA
0
½DNA
P
K
0
m
½IN
0
þ 1
ð7Þ
Eqn (7) predicts the IN–DNA substrate complex concentra-
tion during phase II. From Eqns (3) and (7),
ln
½DNA
0
½DNA
0
½DNA
P
¼ k
obs
t ð8Þ
with
k
obs
¼
k
0
cat
K
0
m
½IN
0
þ 1
ð9Þ
Eqn (9) is equivalent to
1
k
obs
¼
1
k
0
cat
þ
K
0
m
k
0
cat
1
½IN
0
ð10Þ
According to Eqn (8), the function that predicts product
formation over time is given by:
½DNA
P
¼½DNA
0
ð1 e
k
0
cat
t
K
0
m
½IN
0
þ1
Þð11Þ
Thus,
v
0
i
¼
d½DNA
P
dt
¼
½DNA
0
k
0
cat
K
0
m
½IN
0
þ 1
e
k
0
cat
t
K
0
m
½IN
0
þ1
ð12Þ
when
k
0
cat
! e;
d½DNA
P
dt
¼
½DNA
0
k
0
cat
K
0
m
½IN
0
þ 1
ð13Þ
Eqns (9) and (10) were used to determine K
m
¢ and k
cat
¢
experimentally. The k
obs
values were obtained by fitting
kinetics according to Eqn (11) (with [DNA]
0
¼ [DNA
p
]
+¥
when the reaction is not total). Note that k
obs
approximates
to k
cat
¢ when the IN concentration is high compared with
K
m
¢. The 3¢-processing reaction was performed with various
IN concentrations (5–200 nm) and 3 nm
32
P-labelled DNA
substrate (U5-duplex) for 36 or 60 min.
Steady-state fluorescence anisotropy
Steady-state anisotropy was used to estimate the fractional
saturation function ([IN*DNA] ⁄ [DNA]
0
). The measure-
ments were performed as previously described [17] using
U5-duplexes, Fl–U5B ⁄ U5A or Fl–U5B-2 ⁄ U5A, composed
of U5A oligonucleotide and a 5¢-end fluorescein-labelled
complementary strand, either Fl–U5B or Fl–U5B-2. Fl–
U5B ⁄ U5A and Fl–U5B-2 ⁄ U5A mimic blunt and processed
U5 viral DNA ends, respectively. Pseudo first-order kinetic
constant (k¢
on
) for DNA-binding was determined using an
exponential fit.
Acknowledgements
This work was supported by the TRIoH European
project (FP6 grant 503480), the Russian Foundation
for Basic Research (grants 04-04-22000 and 05-04-
48743), the French National Agency for Research
M. Smolov et al. Single-turnover kinetics of HIV-1 integrase
FEBS Journal 273 (2006) 1137–1151 ª 2006 The Authors Journal compilation ª 2006 FEBS 1149
against AIDS (ANRS) and the PICS program (n°271).
We thank Dr Ge
´
rald Peyroche for critically reading
the manuscript and Franc¸ oise Simon for technical
assistance.
References
1 Craigie R (2001) HIV integrase, a brief overview from
chemistry to therapeutics. J Biol Chem 276, 23213–23216.
2 Chiu TK & Davies DR (2004) Structure and function
of HIV-1 integrase. Curr Top Med Chem 4, 965–977.
3 Hazuda DJ, Felock P, Witmer M, Wolfe A, Stillmock
K, Grobler JA, Espeseth A, Gabryelski L, Schleif W,
Blau C et al. (2000) Inhibitors of strand transfer that
prevent integration and inhibit HIV-1 replication in
cells. Science 287, 646–650.
4 Mekouar K, Mouscadet JF, Desmaele D, Subra F, Leh
H, Savoure D, Auclair C & D’Angelo J (1998) Styryl-
quinoline derivatives: a new class of potent HIV-1 integ-
rase inhibitors that block HIV-1 replication in CEM
cells. J Med Chem 41, 2846–2857.
5 Sinha S, Pursley MH & Grandgenett DP (2002) Effi-
cient concerted integration by recombinant human
immunodeficiency virus type 1 integrase without cellular
or viral cofactors. J Virol 76, 3105–3113.
6 Sinha S & Grandgenett DP (2005) Recombinant human
immunodeficiency virus type 1 integrase exhibits a capa-
city for full-site integration in vitro that is comparable
to that of purified preintegration complexes from virus-
infected cells. J Virol 79, 8208–8216.
7 Li M & Craigie R (2005) Processing of viral DNA ends
channels the HIV-1 integration reaction to concerted
integration. J Biol Chem 280, 29334–29339.
8 Engelman A & Craigie R (1995) Efficient magnesium-
dependent human immunodeficiency virus type 1 inte-
grase activity. J Virol 69, 5908–5911.
9 Esposito D & Craigie R (1998) Sequence specificity of
viral end DNA binding by HIV-1 integrase reveals criti-
cal regions for protein–DNA interaction. EMBO J 17,
5832–5843.
10 Bushman FD & Wang B (1994) Rous sarcoma virus
integrase protein: mapping functions for catalysis and
substrate binding. J Virol 68, 2215–2223.
11 Skinner LM, Sudol M, Harper AL & Katzman M
(2001) Nucleophile selection for the endonuclease activ-
ities of human, ovine, and avian retroviral integrases.
J Biol Chem 276, 114–124.
12 Hazuda D, Felock P, Hastings J, Pramanik B, Wolfe A,
Goodarzi G, Vora A, Brackmann K & Grandgenett D
(1997) Equivalent inhibition of half-site and full-site ret-
roviral strand transfer reactions by structurally diverse
compounds. J Virol 71, 807–811.
13 Neamati N, Lin Z, Karki RG, Orr A, Cowansage K,
Strumberg D, Pais GC, Voigt JH, Nicklaus MC,
Winslow HE et al. (2002) Metal-dependent inhibition of
HIV-1 integrase. J Med Chem 45, 5661–5670.
14 Marchand C, Johnson AA, Karki RG, Pais GC, Zhang
X, Cowansage K, Patel TA, Nicklaus MC, Burke TR Jr
& Pommier Y (2003) Metal-dependent inhibition of
HIV-1 integrase by beta-diketo acids and resistance of
the soluble double-mutant (F185K ⁄ C280S). Mol Phar-
macol 64, 600–609.
15 Grobler JA, Stillmock K, Hu B, Witmer M, Felock P,
Espeseth AS, Wolfe A, Egbertson M, Bourgeois M,
Melamed J et al. (2002) Diketo acid inhibitor mechan-
ism and HIV-1 integrase: implications for metal binding
in the active site of phosphotransferase enzymes. Proc
Natl Acad Sci USA 99, 6661–6666.
16 Leh H, Brodin P, Bischerour J, Deprez E, Tauc P,
Brochon JC, LeCam E, Coulaud D, Auclair C &
Mouscadet JF (2000) Determinants of Mg
2+
-dependent
activities of recombinant human immunodeficiency virus
type 1 integrase. Biochemistry 39, 9285–9294.
17 Deprez E, Barbe S, Kolaski M, Leh H, Zouhiri F,
Auclair C, Brochon JC, Le Bret M & Mouscadet JF
(2004) Mechanism of HIV-1 integrase inhibition by
styrylquinoline derivatives in vitro. Mol Pharmacol 65,
85–98.
18 Pinskaya M, Romanova E, Volkov E, Deprez E, Leh
H, Brochon JC, Mouscadet JF & Gottikh M (2004)
HIV-1 integrase complexes with DNA dissociate in
the presence of short oligonucleotides conjugated to
acridine. Biochemistry 43, 8735–8743.
19 Uter NT & Perona JJ (2004) Long-range intramolecular
signaling in a tRNA synthetase complex revealed by
pre-steady-state kinetics. Proc Natl Acad Sci USA 101,
14396–14401.
20 Etzkorn C & Horton NC (2004) Ca2+ binding in the
active site of HincII: implications for the catalytic mech-
anism. Biochemistry 43, 13256–13270.
21 Brocklehurst K, Resmini M & Topham CM (2001)
Kinetic and titration methods for determination of
active site contents of enzyme and catalytic antibody
preparations. Methods 24, 153–167.
22 Hawkins ME, Pfleiderer W, Mazumder A, Pommier
YG & Balis FM (1995) Incorporation of a fluorescent
guanosine analog into oligonucleotides and its
application to a real time assay for the HIV-1 inte-
grase 3¢-processing reaction. Nucleic Acids Res 23,
2872–2880.
23 Tramontano E, Colla PL & Cheng YC (1998)
Biochemical characterization of the HIV-1 integrase
3¢-processing activity and its inhibition by
phosphorothioate oligonucleotides. Biochemistry 37,
7237–7243.
24 Bugreev DV, Baranova S, Zakharova OD, Parissi V,
Desjobert C, Sottofattori E, Balbi A, Litvak S,
Tarrago-Litvak L & Nevinsky GA (2003) Dynamic,
Single-turnover kinetics of HIV-1 integrase M. Smolov et al.
1150 FEBS Journal 273 (2006) 1137–1151 ª 2006 The Authors Journal compilation ª 2006 FEBS
thermodynamic, and kinetic basis for recognition
and transformation of DNA by human immunodefi-
ciency virus type 1 integrase. Biochemistry 42,
9235–9247.
25 Cornish-Bowden A (1976) Principles of Enzyme Kinetics.
Butterworth, London.
26 Engelman A, Hickman AB & Craigie R (1994) The core
and carboxyl-terminal domains of the integrase protein
of human immunodeficiency virus type 1 each contri-
bute to nonspecific DNA binding. J Virol 68, 5911–
5917.
27 Mazumder A, Gupta M, Perrin DM, Sigman DS,
Rabinovitz M & Pommier Y (1995) Inhibition of
human immunodeficiency virus type 1 integrase by a
hydrophobic cation: the phenanthroline–cuprous
complex. AIDS Res Hum Retroviruses 11,
115–125.
28 Deprez E, Tauc P, Leh H, Mouscadet JF, Auclair C,
Hawkins ME & Brochon JC (2001) DNA binding
induces dissociation of the multimeric form of HIV-1
integrase: a time-resolved fluorescence anisotropy study.
Proc Natl Acad Sci USA 98, 10090–10095.
29 Deprez E, Tauc P, Leh H, Mouscadet JF, Auclair C &
Brochon JC (2000) Oligomeric states of the HIV-1 inte-
grase as measured by time-resolved fluorescence aniso-
tropy. Biochemistry 39, 9275–9284.
30 Gao K, Butler SL & Bushman F (2001) Human
immunodeficiency virus type 1 integrase: arrangement of
protein domains in active cDNA complexes. EMBO J
20, 3565–3576.
31 Faure A, Calmels C, Desjobert C, Castroviejo M, Cau-
mont-Sarcos A, Tarrago-Litvak L, Litvak S & Parissi V
(2005) HIV-1 integrase crosslinked oligomers are active
in vitro. Nucleic Acids Res 33, 977–986.
32 Jones KS, Coleman J, Merkel GW, Laue TM & Skalka
AM (1992) Retroviral integrase functions as a multimer
and can turn over catalytically. J Biol Chem 267,
16037–16040.
33 Reinke RA, Lee DJ, McDougall BR, King PJ, Victoria
J, Mao Y, Lei X, Reinecke MG & Robinson WE Jr
(2004) 1-Chicoric acid inhibits human immunodeficiency
virus type 1 integration in vivo and is a noncompetitive
but reversible inhibitor of HIV-1 integrase in vitro.
Virology 326, 203–219.
34 King PJ, Lee DJ, Reinke RA, Victoria JG, Beale K &
Robinson WE Jr (2003) Human immunodeficiency virus
type-1 integrase containing a glycine to serine mutation
at position 140 is attenuated for catalysis and resistant
to integrase inhibitors. Virology 306, 147–161.
35 Gerton JL, Ohgi S, Olsen M, DeRisi J & Brown PO
(1998) Effects of mutations in residues near the active
site of human immunodeficiency virus type 1 integrase
on specific enzyme–substrate interactions. J Virol 72,
5046–5055.
36 Jenkins TM, Esposito D, Engelman A & Craigie R
(1997) Critical contacts between HIV-1 integrase and
viral DNA identified by structure-based analysis and
photo-crosslinking. EMBO J 16, 6849–6859.
37 Gerton JL & Brown PO (1997) The core domain of
HIV-1 integrase recognizes key features of its DNA sub-
strates. J Biol Chem 272, 25809–25815.
38 Surby MA & Reich NO (1996) Contribution of facili-
tated diffusion and processive catalysis to enzyme effi-
ciency: implications for the EcoRI restriction-
modification system. Biochemistry 35, 2201–2208.
39 Jeltsch A, Wenz C, Stahl F & Pingoud A (1996) Linear
diffusion of the restriction endonuclease EcoRV on
DNA is essential for the in vivo function of the enzyme.
EMBO J 15, 5104–5111.
40 Harper AL, Skinner LM, Sudol M & Katzman M
(2001) Use of patient-derived human immunodefi-
ciency virus type 1 integrases to identify a protein
residue that affects target site selection. J Virol 75,
7756–7762.
41 Appa RS, Shin CG, Lee P & Chow SA (2001) Role of
the nonspecific DNA-binding region and alpha helices
within the core domain of retroviral integrase in select-
ing target DNA sites for integration. J Biol Chem 276,
45848–45855.
42 Marchand C, Zhang X, Pais GC, Cowansage K, Nea-
mati N, Burke TR Jr & Pommier Y (2002) Structural
determinants for HIV-1 integrase inhibition by beta-
diketo acids. J Biol Chem 277, 12596–12603.
43 Perryman AL & McCammon JA (2002) AutoDocking
dinucleotides to the HIV-1 integrase core domain:
exploring possible binding sites for viral and genomic
DNA. J Med Chem 45, 5624–5627.
44 Adesokan AA, Roberts VA, Lee KW, Lins RD
& Briggs JM (2004) Prediction of HIV-1 integrase ⁄
viral DNA interactions in the catalytic domain by fast
molecular docking. J Med Chem 47, 821–828.
45 van Gent DC, Elgersma Y, Bolk MW, Vink C & Plas-
terk RH (1991) DNA binding properties of the integrase
proteins of human immunodeficiency viruses types 1
and 2. Nucleic Acids Res 19, 3821–3827.
46 Bao KK, Wang H, Miller JK, Erie DA, Skalka AM &
Wong I (2003) Functional oligomeric state of avian sar-
coma virus integrase. J Biol Chem 278, 1323–1327.
47 Feng H, Klutz AM & Cao W (2005) Active site plasti-
city of endonuclease V from Salmonella typhimurium.
Biochemistry 44, 675–683.
48 O’Neill RJ, Vorob’eva OV, Shahbakhti H, Zmuda E,
Bhagwat AS & Baldwin GS (2003) Mismatch uracil gly-
cosylase from Escherichia coli: a general mismatch or a
specific DNA glycosylase? J Biol Chem 278, 20526–
20532.
M. Smolov et al. Single-turnover kinetics of HIV-1 integrase
FEBS Journal 273 (2006) 1137–1151 ª 2006 The Authors Journal compilation ª 2006 FEBS 1151