Báo cáo khoa học: A kinetic study of sugarcane sucrose synthase pdf
Bạn đang xem bản rút gọn của tài liệu. Xem và tải ngay bản đầy đủ của tài liệu tại đây (475.44 KB, 7 trang )
A kinetic study of sugarcane sucrose synthase
Wolfgang E. Scha¨ fer
1
, Johann M. Rohwer
2
and Frederik C. Botha
3
1
Institute for Plant Biotechnology and
2
Department of Biochemistry, University of Stellenbosch, South Africa;
3
South African
Sugarcane Research Institute, Mount Edgecombe, South Africa
The kinetic data on sugarcane (Saccharum spp. hybrids)
sucrose s ynthase ( SuSy, UDP-glucose:
D
-fructose 2-a-
D
-
glucosyltransferase, EC 2.4.1 .13) are limited. W e c haracter-
ized kinetically a SuSy activity partially purified from
sugarcane variety N19 leaf roll t issue. Primary p lot analysis
and product i nhibition studies showed that a compulsory
order ternary complex mechanism is followed, with UDP
binding first and UDP-glucose dissociating last from the
enzyme. Product inhibition studies showed that UDP-glu-
cose is a competitive inh ibitor w ith respect to UDP and a
mixed inhibitor with r espect to sucrose. Fructose is a mixed
inhibitor with r egard to both s ucrose and UDP. Kinetic
constants a re as follows: K
m
values ( m
M
, ± SE) were, for
sucrose, 35.9 ± 2.3; for UDP, 0.00191 ± 0.00019; for
UDP-glucose, 0. 234 ± 0.025 and f or fructose, 6 .49 ± 0.61.
K
S
i
values were, for sucrose, 227 m
M
; for UDP, 0.086 m
M
;
for UDP-glucose, 0.104; and for fructose, 2.23 m
M
.
Replacing estimated kinetic parameters of SuSy in a kinetic
model of sucrose accumulation with experimentally deter-
mined parameters of the partially purified isoform h ad sig-
nificant effects on model outputs, with a 41% increase in
sucrose concentration and 7.5-fold reduction in fructose the
most notable. Of the metabolites included in the model,
fructose concentration was most affected b y changes in SuSy
activity: doubling and halving o f SuSy activity reduced and
increased the steady-state fructose concentration by about
42 and 140%, respectively. It is conclude d that different
isoforms of SuSy could have significant d ifferential effects o n
metabolite concentrations in vivo, t herefore impacting on
metabolic regulation.
Keywords: metabolic control analysis; sugarcane; sucrose
synthase; kinetic modelling.
The kinetic parameters of enzymes provide important
information about their interactions with substrates, prod-
ucts and effectors. Typically, substrate K
m
values are
interpreted to g ive an indication of the affinity of enzymes
for their substrates, and conclusions about enzymes’ phy-
siological roles are often based on these values. However,
the kinetic parameters of individual enzymes do not by
themselves provide much insight into the b ehaviour of an
intact, functioning metabolic pathway. Cellular network
models, such as those applied in the approach of compu-
tational systems biology, extend the usefulness of k inetic
data on individual enzymes immensely and can have both
explanatory and predictive value.
Several papers that give a n overview of different approa-
ches for studying and modelling metabolism, such as
metabolic flux analysis, metabolic control analysis ( MCA)
and positional isotopic labelling combined with NMR or
MS, have been published recently [1–3]. Of these approaches,
MCA [4,5] is particularly useful in studies of metabolic
pathways, as it quantifies the d egree of c ontrol of individu al
reaction steps o n the steady-state pathway flux or metabolite
concentrations. Hence, MCA can be a great help in
determining potential target steps for metabolic engineering,
because the reactions in the pathway that have the most
potential of modifying a target flux or metabolite c oncen-
tration can be identified. For example, MCA has been used
to study the control of different steps on mitochondrial
respiration [6], a nd successfully p redicted t hat o verexpre ssion
of NADH oxidase is more successful than acetolactate
synthase overexpression for i ncre asing production ofdiacetyl
by Lactococcus lactis [7]. In plants, MCA was use d to
estimate the flux control coefficient of phosphoglucoiso-
merase on sucrose and starch production using Clarkia
xantiana mutants w ith decreased levels of t his enzyme [ 8].
MCA has been discussed in the context of plant metabolism
[9] and further examples of its application are given therein,
as well as practical advice on isolation and assay of plant
enzymes and extraction of metabolites. It should be
mentioned that plants pose particular challenges as far as
analysis of their metabolism by MCA (or other methods for
that matter) is concerned: the degree of compartmentaliza-
tion of metabolism is extremely high, a nd isolation of a ctive
enzymes c an be a c hallenge, owing to various factors such a s
proteases, interfering compounds, high acidity and so f orth.
Apart f rom these considerations, the lack of uniform data
sets for use in the construction of kinetic models can be a
hindrance. Addressing this point, techniques to measure
considerable numbers of metabolites simultaneously are now
available a nd will contribute greatly to analyses of metabo-
lism and our understanding thereof [10].
A kinetic model describing sucrose accumulation in
sugarcane was published recently [ 11]. This model w as used
Correspondence to W. E. Scha
¨
fer, Institute for Plant Biotechnology,
University of Stellenbosch, Private Bag X1, 7602 Matieland , South
Africa. Fax: +27 21 8083835, Tel.: +27 21 8083834,
E-mail:
Abbreviations: MCA, metabolic control analysis; SuS y, s ucrose
synthase.
Enzyme: sucrose sy nthase (EC 2.4.1.13).
(Received 10 June 2004, revised 7 J uly 2004, accepted 13 July 2004)
Eur. J. Biochem. 271, 3971–3977 (2004) Ó FEBS 2004 doi:10.1111/j.1432-1033.2004.04288.x
to calculate the control coefficients of enzymes in t he sucrose
synthesis pathway for sucrose futile cycling (cleavage and
resynthesis of sucrose), with a view to determining which
reactions control this energetically wasteful process. Like
any kinetic model, it requires the rate equations of all
reactions in the pathway and therefore the kinetic param-
eters of every enzyme. Typically the rate equations require
more information than simply K
m
values for the substrates,
which are the only kinetic parameters reported in most
studies not focusing exclusively on kinetics. For sugarcane
SuSy (SuSy, UDP-glucose:
D
-fructose 2-a-
D
-glucosyltrans-
ferase, E C 2 .4.1.13), s ubstrate K
m
values have been reported
[12], but not other important parameters, such as substrate
K
i
values, or confirmation of the reaction m echanism, which
are also needed for k inetic modelling.
The objective of t his study was to obtain more extensive
data on the kinetic parameters of sugarcane SuSy, which
can be used to enhance modelling o f sucrose accumulation
and also improve our understanding of sugarcane SuSy
and its influence on sucrose accumulation.
Materials and methods
Materials
Sugarcane (Saccharum spp. hybrids), variety N19, field
grown at the University of Stellenbosch experimental
farm was used. Internode one was taken as the internode
attached to the leaf with the first exposed dewlap [13].
Tris buffer, dithiothreitol and all coupling enzymes were
obtained from Roche (Basel, Switzerland), except UDP-
glucose pyrophosphorylase, which was from Sigma (3050
Spruce St., St. Louis, MO, USA). Merck (Darmstadt,
Germany) provided the other chemicals.
Enzyme purification and chromatography
Leaf roll tissue was ground to powder in liquid nitrogen and
extracted in a 1 : 2 (m/v) ratio o f 3 00 m
M
Tris/HCl (pH 7.5)
buffer containing 10% (v/v) glycerol, 2 m
M
MgCl
2
,5m
M
dithiothreitol, 2 m
M
EDTA and Roche Complete
TM
pro-
tease inhibitor. The homogenate was filtered through a
double-layered nylon cloth, centrifuged at 10 000 g for
10 min, and the pellets discarded. The proteins in the
supernatant were precipitated by 80% saturation with
ammonium sulfate and recovered by centrifugation at
10 000 g for 10 m in. The pellets were resuspended in
100 m
M
Tris/HCl (pH 7.5) buffer c ontaining 2 m
M
MgCl
2
,
2m
M
dithiothreitol and 2 m
M
EDTA (buffer A). The
protein extract was then desalted by passage through a
Pharmacia PD-10 (Sephadex G25) column and the eluant
was diluted two times with buffer A. The desalted extract
wasappliedtoa5mLAmersham/PharmaciaHi-trapQ
anion exchange column that had previously been equili-
brated with buffer A. The protein was eluted with a linear
KCl gradient at a flow speed of 1 mLÆmin
)1
and f ractions
containing 20% or more of maximum activity w ere pooled.
Active fractions from the column were dialysed against
buffer A.
The partially purified extract was tes ted for the potential
presence of the interfering activities invertase, UDPGlc
dehydrogenase, fructokinase and sucrose phosphate
synthase. Results showed that under the conditions used
for the S uSy assays (pH 7 for the sucrose breakdown a ssay
or pH 7.3 for the synthesis reaction, 100 m
M
Tris buffer)
there were no significant levels of these interfering activities
present, with only invertase barely detectable at less than
0.5% of SuSy activity. This partially purified SuSy activity
(named SuSyC) was one of three SuSy activities in leaf roll
which differed i n their chromatographic, kinetic and
immunological properties [14
1
].
SuSy assays
Activity in the sucrose synthesis direction was m easured in
100 m
M
Tris/HCl (pH 7.3) buffer. The assay contained
15 m
M
MgCl
2
,0.2m
M
NADH, 1 m
M
phosphoenolpyru-
vate
2
, and appropriate concentrations of UDP-glucose and
fructose. Pyruvate kinase and lactate dehydrogenase were
each added to a final activity of 4 UÆmL
)1
.NADH
oxidation was monitored at 340 nm wavelength.
Activity in the sucrose breakdown direction was rou-
tinely measured in an assay containing 100 m
M
Tris/HCl
(pH 7.0), 2 m
M
MgCl
2
,2m
M
NAD
+
,1m
M
pyrophos-
phate and appropriate concentrations of sucrose and UDP.
UDP-glucose pyrophosphorylase ( UDPGlcPP), phospho-
glucomutase (PGM) and Leuconostoc glucose-6-phosphate
dehydrogenase (G6PDH) were each added to a final
activity of 4 UÆmL
)1
. NADH production was monitored
at 340 nm.
For the UDP-glucose product inhibition study, activity
was measured in an assay containing 100 m
M
Tris/HCl
(pH 7.0), 2 m
M
NAD
+
,2m
M
MgCl
2
and 1 m
M
ATP.
Hexokinase (4 UÆmL
)1
), phosphoglucoisomerase and glu-
cose-6-phosphate dehydrogenase were added and NADH
production monitored at 340 nm.
Determination of kinetic parameters and modelling
Substrate K
m
values were calculated by nonlinear fit to the
Michaelis–Menten equation using
GRAFIT
TM
version 4 for
Windows
TM
( Initial estimates
were calculated automatically by the program based on
linear r egression of r earranged data. U niform weighting was
used for all data points.
Kinetic p arameters o ther than the substrate K
m
values
were taken as the median values calculated from the
experimental data. To calculate the product inhibition
constants, kinetic experiments were performed at the
product inhibitor and substrate concentrations as indicated
in Figs 2 and 3.
The program
WINSCAMP
v1.2 [15] was used for kinetic
modelling, using a published model of sucrose accumula-
tion [11]. This model can be viewed and interrogated at
.
Results
The purpose of the kinetic experiments reported in this
paper was to establish the reaction mechanism of
sugarcane SuSy and also determine kinetic parameters
needed for metabolic modelling. As far as the SuSy
reaction mechanism is concerned, there are conflicting
reports in the literature; some of these results do not
3972 W. E. Scha
¨
fer et al.(Eur. J. Biochem. 271) Ó FEBS 2004
agree with the theoretically predic ted properties of the
proposed reaction mechanisms (see Discussion). Hence,
there was a need to establish these properties of sugarcane
SuSy.
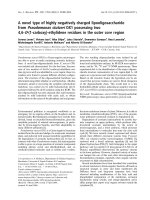
Primary (Hanes–Woolf) plot analysis
Primary plot analysis is used to obtain information on
the reaction mechanism of an enzyme; in combination
with product inhibition studies, the complete mechanism
can be established. Primary plots (Fig. 1) f or all sub-
strates gave straight lines with intersection points to the
left of the
3
s/v vs. s axis, which indicates a ternary
complex mechanism [for a substituted ( ping-pong) mech-
anism t he intersection points are on the axis]. The
substrate K
i
values obtained from the intersection points
of the lines are indicated in Table 1. Sugarcane SuSy
exhibited Michae lis–Menten kinetics, with Hill coefficients
close to 1 (data not shown), irrespective of the variable
substrate, which means that sugarcane SuSy does not
display cooperative binding like some other multimeric
enzymes.
Fig. 1. Primary ( Hanes–Woolf) plots f or the substrates of SuSy at z ero initial product c oncentrations. (A) S u crose at varying co ncen trations of UDP;
(B) UDP at varying concentrations of sucrose ; (C) UDP-glucose at varying concentrations of fructose; (D) fructose at varying concentrations of
UDP-glucose. Lines reflect K
m
and V
max
values that were derived from nonlinear fit (n ¼ 6) to the Michaelis–Menten equation as described in
Materials and methods. Kinetic assays were performed as describ ed in Materials and methods. s, Sub strate concentration; s/v, substrate con-
centration divided by reaction rate.
Table 1. Inhibition types and kinetic parameters for SuSyC. P arameters were determ ined as described i n Materials and methods.; w.r.t., with
respect to.
6
Kinetic parameter
type
Substrate
Sucrose
(m
M
)
UDP
(m
M
)
UDP-glucose
(m
M
)
Fructose
(m
M
)
K
i
S
227 0.086 0.104 2.23
K
m
35.9 ± 2.3 0.00191 ± 0.00019 0.234 ± 0.025 6.49 ± 0.61
Inhibition constants
Substrate
UDP-glucose w.r.t.
UDP (competitive)
UDP-glucose w.r.t.
sucrose (mixed)
Fructose w.r.t.
UDP (mixed)
Fructose w.r.t.
sucrose (mixed)
K
i
0.12 0.18 4.1 1.8
7
K
i
¢ – 0.19 3.9 0.65
7
Ó FEBS 2004 Sugarcane sucrose synthase kinetics (Eur. J. Biochem. 271) 3973
To distinguish between a random order and ordered
ternary complex mechanism, it is necessary to perform
product inhibition experiments, because the primary plots
for these two mechanisms have the same attributes and
can therefore not be used to discriminate between the two.
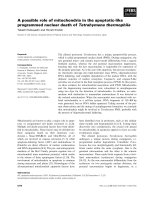
Product inhibition studies
Inhibition types and inhibition constants derived from
Dixon and Cornish–Bowden plots for UDP-glucose
(Fig. 2 ) and fructose product inhibition (Fig. 3) are shown
in Table 1 . Competitive inhibition is characterized by a
series of parallel lines in the C ornish–Bowden p lot, while the
Dixon plot shows t he lines intersecting to the left of the
y-axis. Mixed inhibition shows the lines intersecting to
theleftofthey-axis i n both plots. The inhibition patterns
indicate an ordered m echanism with UDP binding firs t and
UDP-glucose dissociating last. Product inhibition patterns
for both fructose a nd UDP-glucose agreed fully with the
predicted patterns for an ordered ternary complex mechan-
ism [16], with UDP-glucose a competitive inhibitor with
regard to UDP and a mixed inhibitor with regard to
sucrose. Fructose was a mixed inhibitor with r egard to both
UDP and sucrose. Although only three data points were
obtained for each concentration of the variable substrate,
the inhibition patterns for both UDP-Glc and fructose are
nonetheless clear.
The ordered ternary complex mechanism, with UDP
binding first and UDP-glucose dissociating last, agrees with
that proposed for Helianthus tuberosus SuSy [17] and
validates the assumption made in a kinetic model of sucrose
accumulation [11], although the substrate K
i
values obtained
experimentally differ substantially from those used in the
model. The data obtained from the kinetic experiments were
then incorporated in the model of sucrose accumulation, to
investigate the effect of changes in SuSy kinetic parameters
on the output variables.
Modelling
Kinetic parameters obtained experimentally were used to
query a k inetic model of sucrose accumulation [11]. This
model, constructed using the program
WINSCAMP
[15],
consists of 11 reactions that are either d irectly or indirectly
involved in sucrose metabolism. Enzymes with sucrose as
substrate or product are included explicitly, w hile others,
specifically glycolysis and the enzymes phosphoglucoiso-
merase, phosphoglucomutase and UDP-glucose pyro-
phosphorylase (UGPase) are included as a single ÔdrainÕ
reaction and a so-called Ôforcing functionÕ, respectively. The
forcing function assumes that the reactions catalysed
by phosphoglucoisomerase, phosphoglucomutase and
UGPase are close to equilibrium in vivo , which is supported
by metabolite measurements in most t issues. The reactions
are e ntered as rate eq uations in the m odel, which means that
all the relevant kinetic parameters are needed for each
enzyme. Because of the paucity of kinetic information on
sugarcane enzymes most of these parameters were estima-
ted. Enzyme levels were taken mostly from the literature on
sugarcane, others were estimated. The model solves the
differential equations describing the synthesis and degrada-
tion of each metabolite in ord er to calculate the steady-state
Fig. 2. UDP-glucose product inhibition. Dixon (A,C) and Cornish–Bowden plots (B,D) with sucrose (A,B) and UDP (C,D) as the variable
substrates. For (A) and (B), UDP was kept constant at 0.020 m
M
, while for (C) and (D) sucrose was kept co nstant at 40 m
M
.1/v,Reciprocal
reaction rate; i, inhibitor concentration; s/v, substrate concentration divided by reaction rate.
3974 W. E. Scha
¨
fer et al.(Eur. J. Biochem. 271) Ó FEBS 2004
levels. The model ÔbehavesÕ like a sugarcane storage
parenchyma cell, in that it accumulates s ucrose, with other
metabolite levels fairly close to experimentally measured
values.
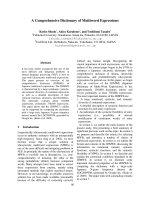
Variable outputs from the model are shown in Fig. 4.
Outputs from the original model a re shown a s the first bar
in every panel. For all the other model variants, the
equilibrium constant for the SuSy reaction was changed to
0.50 (the published model used an equilibrium constant of
five in the sucrose breakdown direction [18], but this is
incorrect; reported values range from 0.15 to 0.56 [19]).
Also, the SuSy parameters which were input in the origin al
model did not obey t he two Haldane relationships, which
relate the K
eq
to the V
f
/V
r
ratio, K
m
and K
i
values [16]. The
two equations are given below:
K
eq
¼ V
f
=V
r
ÁðK
iQ
ÁK
mP
=K
iA
ÁK
mB
Þð1Þ
K
eq
¼ðV
f
=V
r
Þ
2
ÁðK
iP
ÁK
mQ
=K
iB
ÁK
mA
Þð2Þ
whereAisUDP;B,sucrose;P,fructose;Q,UDP-glucose;
and V
f
and V
r
refer to maximal reaction rates in the s ucrose
breakdown and synthesis directions, respectively.
For the corrected model (Fig. 4, model variant 2) all
kinetic p arameters were kept the same as the values used in
the published m odel, except the K
i
value for UDP ( K
iA
)was
Fig. 3. Fructose product inhibition. Dixon(A,C)andCornish–Bowdenplots(B,D)withsucrose (A,B) and UDP (C,D) a s t he variable s ubstrates.
For (A) and (B), U DP was kept constant at 0.020 m
M
, while f or ( C) and (D) sucrose was ke pt c onstant at 40 m
M
.1/v,Reciprocalreactionrate;i,
inhibitor concentration; s/v, substrate concentration divided by reaction rate.
Fig. 4.
WINSCAMP
kinetic model variable o utputs. Mo del v ariants are as follows: or., original pub lished m ode l; c orr., m odel with K
eq
and K
i
values
corrected (see Results); C, model w ith SuSyC parameters; 2*, as for C, but doubled a ctivity; 1/2, as for C, but halved activity; 2 i, model c ontaining
two SuSy isoforms, one with generic parameters, the other with experimentally determined parameters – total SuSy breakdown activity was kept the
same as for the first three model variants.
Ó FEBS 2004 Sugarcane sucrose synthase kinetics (Eur. J. Biochem. 271) 3975
changed from 0.3 to 0.108 m
M
,andtheK
i
value for fructose
(K
iP
) w as changed from 4 m
M
to 3 .92 m
M
in order to obey
the two Haldane relationships. In o rder to ensure compli-
ance with these thermodynamic relationships, the K
i
values
used for the models incorporating the SuSyC p arameters
(Fig. 4 , variants 3–6) were modified somewhat from the
experimental values. These modified values were (in m
M
),
0.103, 0. 0871, 3.10 a nd 139 f or UDP-glucose, UDP, fructose
and sucrose, respectively, w ith K
m
values used i n the models
as shown in Table 1. Note that the modified K
i
values f or
fructose and sucrose are both in the same range as the
experimentally determined values, while the values for
UDP-glucose and UDP are extremely close to the experi-
mentally determined values.
The output variables differed appreciably b etween mod-
els c ontaining two d ifferent SuSy isoforms. Sucrose, g lucose,
Fru-6P and UDP-glucose concentrations were all h igher in
model variant C than in 2. Fructose was the variable most
affected by changes in the SuSy isoform in the model or
changes in SuSy activity (see Discussion), although s ucrose
concentration a lso increased by about 41% in m odel variant
C. Sucrose content was positively correlated with SuSy
activity, but these changes were qu ite small compared with
the c hanges in enzyme activity, at about a 4% increase and
9% d ecrease in sucrose for a doubling and halving of
activity, respectively. Sucrose futile cycling was about 7%
higher in the models containing the SuSyC isoform,
compared with the model (variant 2) w ith the ÔgenericÕ
SuSy. Notably, percentage conversion of hexoses t o sucrose
increased from 84.4 to 87.0%, and percentage carbon to
glycolysis decreased from 1 5.6 t o 13.0% in model variant C,
compared with 2.
Discussion
It is interesting to compare the results obtained in this
study with those for maize [20] and Helianthus t uberosus
SuSy [17]. UDP-glucose is a competitive inhibitor with
regard to UDP, and fructose a competitive inhibitor with
regard to sucrose, according to both these studies. These
results, however, conflict with the predicted patterns of
product inhibition for an ordered ternary mechanism [16];
instead, they agree with the expected patterns for a
substituted (ping-pong) mechanism. A r andom mechanism
was p roposed for SuSy from Phaseolus aureus [21], but this
finding was later challenged [17]. T he results o f the study on
sugarcane SuSy indicated that it follows an ordered ternary
mechanism, with no evidence to suggest otherwise. The
apparent conflict between the product inhibition patterns
obtained i n t he studies on maize and Helianthus SuSy on the
one hand and sugarcane SuSy on the other is puzzling and
merits further investigation.
The kinetic data obtained in this study was used t o query
a m odel of sucrose accumulation [11]. It was found that
substituting the mostly estimated kinetic parameters of
SuSy in the original model with the experimentally deter-
mined parameters of the SuSyC isoform had a marked
effect on most variables output by the model. The 41%
increase in sucrose concentration and the m ore than 7 times
reduction in fructose concentration were the most notable.
Evidently, c hanges in kinetic parameters of enzymes
involved in sucrose metabolism are capable of h aving l arge
effects on metabolite concentrations. According to this
model, expression of multiple enzyme isoforms may t here-
fore play an important role in the r egulation o f metabolism,
as they can b e u sed to influence metabolite concentrations in
different ways. Therefore, different SuSy isoforms may
influence sugarcane sucrose l evels differentially in vivo;this
information can be put to use in sugarcane improvement
programmes.
Changes in SuSy activity also impacted the model
variables. The biggest changes were in fructose c oncentra-
tion, which decreased by 42% when a ctivity was doubled,
and increased by 140% when activity was halved. Incor-
poration of the SuSyC isoform in the model dramatically
reduced the steady-state concentration of fructose com-
pared w ith t he model with estimated SuSy parameters, from
22.6 to 3.04 m
M
. This may seem alarming when compared
with experimentally reported values of about 30 m
M
for
fructose in internode five [22], but it has to be kept in mind
that these experimental values assume equal distribution of
fructose between the cytosol and vacuole. Up to 99% of
glucose a nd fructose in this tissue might actually be present
in the vacuole [23], and hence the low value for cytosolic
fructose obtained with the modified model is not necessarily
incorrect. On the other hand, on e would expect the glucose
and fructose values to be more or less equal, but this is not
so in the modified model. Only metabolite measurement
methods that can distinguish between the cytosolic and
vacuolar compartments can resolve this issue.
Next, the model was expanded so that i n a ddition to the
SuSy isoform w ith generic kinetic parameters, it included a
second SuSy isoform, with experimentally determined
kinetic parameters. Total SuSy b reakdown a ctivity was
kept the same as i n the models with only one SuSy isoform.
Modelling results with this version were very similar to the
model containing only the SuSyC isoform, except for the
fructose concentration, which was 67% higher. This change
in the fructose concentration suggests that expressing
different enzyme isoforms simultaneously may add to the
regulatory capabilities that plants have over their metabo-
lism, in addition to expressing isoforms in spatially and
temporally separate ways.
Reducing SuSy activity 10-fold results in the fructose
concentration increasing about 17-fold and halving of
sucrose concentration ( data not shown). This is c onsistent
with experimental data that show that SuSy participates in
sucrose synthesis in younger internodes [24]. I t would be
insightful to modify the model for a mature i nternode, and
then see w hat e ffects c hanges in SuSy activity have. I t w ould
be best to establish enzyme a ctivity l evels f or all t he enzymes
incorporated in the model simultaneously with a single
enzyme extract, in order to avoid the fragmented and
approximate data set used for the current model.
The u tility o f m odelling sucrose metabolism w as illustra-
ted in this work; the r esults obtained could not easily have
been predicted by other means. Computational systems
biology approaches can therefore play a very useful role in
studying processes that impact on sucrose accumulation,
such as futile cycling. Futile cycling is an energetically
wasteful process, as for sucrose to be resynthesized the
hexoses have to be phosphorylated again at the expense of
ATP, and therefore reduction of this process in sucrose
accumulating tissue is an important goal. The modelling
3976 W. E. Scha
¨
fer et al.(Eur. J. Biochem. 271) Ó FEBS 2004
results indicate that, at least in a fairly young internode,
sucrose futile cycling is not greatly affected by specific SuSy
isoforms. This may not be the case in a mature internode;
therefore mature tissue should also be m odelled in order to
answer this question.
In conclusion, kinetic modelling can be use d not only to
predict the effects of variation in the activity or kinetic
parameters of enzymes catalysing different reactions, but
can also yield information a bout the metabolic effects of
the presence of more than one isoenzyme, such as SuSy
isoforms in sugarcane. This makes possible much more
informed decisions on manipulation strategies for yield
improvement in any system that can be m odelled this way.
Obtaining the reaction mechanisms and kinetic parameters
of all enzymes involved in such a system is an essential step
in this approach.
Acknowledgements
Support from the South African Sugar Association and the South
African National Research Foundation is gratefully acknowledged.
References
1. Giersch, C. (2000) Mathematical modelling of metabolism. Curr.
Opin. Plant Biol. 3, 249–253.
2. Wiechert, W . (2001) Modeli ng and s imulation: tools f or metabolic
engineering. J. Biotechnol. 94, 37–63.
3. Morgan, J.A. & Rhodes, D. (2002) Mathematical modeling of
plant metabolic pathways. Metab. Eng. 4, 80–89.
4. Kacser, H. & Burns, J.A. (1973) The control of flux. Symp. Soc.
Exp. Biol. 27, 64–105.
5. Heinrich, R. & Rapoport, T.A. (1974) A linear steady-state
treatment of enzymatic chains: general properties, control and
effector strength. Eur. J. Biochem. 42, 89–95.
6. Groen, A.K., Wanders, R.J.A., Westerhoff, H.V., Van der Meer,
R. & Tager, J.M. (1982) Quantification of the contribution of
various steps to the control of mito chondrial respiration. J. Bio l.
Chem. 257, 2754–2757.
7. Hoefnagel, M.H., Starrenburg, M.J., Martens, D .E., Hugenholtz,
J., Kleerebezem , M ., Van Swam, I.I., Bongers, R ., W esterhoff,
H.V. & Snoep, J.L. (2002) Metabolic engineering of lactic acid
bacteria, the combined approach: kinetic modelling, metabolic
control and experimental analysis. Microbiology 148, 1003–1013.
8. Kruckeberg, A.L., Neuhaus, H.E., F eil, R., Gottlieb, L.D. & Stitt,
M. (1989) Decreased-activity mutants of phosphoglucose
isomerase in the cytosol and chloroplast of Clarkia xantiana.
Biochem. J. 261, 457–467.
9. Ap Rees, T. & Hill, S.A. (1 994) Metabolic control analysis of pla n t
metabolism. Plant Cell Environ. 17, 587–599.
10. Stitt, M. & Fernie, A.R. (2003) From measurements of metabo-
lites to metabolomics: an Ôon the flyÕ perspective illustrated by
recent studie s of carbon–nitrogen i nteraction s. Curr. Opin. Bio-
technol. 14, 1–9.
11. Rohwer, J.M. & Botha, F.C. (2001) Analysis of sucrose accu-
mulation in the sugar cane culm on the basis of in vit ro kinetic
data. Biochem. J. 358, 437–445.
12. Buczynski, S.R., Thom, M., Chourey, P. & M aretzki, A. (1993)
Tissue distribution and characterisation of sucrose synthase
isozymes in sugarcane. J. Plant Physiol. 142, 641–646.
13. Van D illewijn, C. (1952) Botany of Su garcane. C ronica Botanica
Co., Waltham, MA.
14. Scha
¨
fer, W.E., R ohwer, J.M. & Botha, F.C. (2004) Partial puri-
fication and characterization of the s ucrose synthase in sugarcane.
J. Plant Phys. doi: 10.1016/j.jplph.2004.04.010.
15. Sauro, H.M. (1993)
SCAMP
:ageneralpurposesimulatorand
metabolic control analysis p rogram. CABIOS 9, 441–450.
16. Segel, I.H. (1975) Enzyme Kinetics – Behaviour and Analysis of
Rapid Equilibrium and Steady-State Enzyme Systems,1stedn.
John Wiley & Sons,
5
New York, USA.
17. Wolosiuk, R.A. & Pontis, H.G. (1974) Studies on sucrose syn-
thase. Arch. Biochem. Biophys. 165, 140–145.
18. Kruger, N.J. (1990) Carbohydrate synthesis and degradation. In
Plant Physiology, Biochemistry and Molecular Biology (Dennis,
D.T. & Turpin, D.H., eds), pp. 59–76. Longman Scientific &
Technical publishers, Harlow, UK.
19. Geigenberger,P.&Stitt,M.(1993) Sucrose synthase catalyses a
readily reversible reaction in vivo in developin g potato tubers an d
other plant tissues. Planta 189, 329–339.
20. Nguyen-Quoc, B., Krivitzky, M., Huber, S.C. & Lecharny, A.
(1990) Sucrose synthase in devel oping maize l eaves. Plant Physiol.
94, 516–523.
21. Delmer, D.P. (1972) The purification and properties of sucrose
synthase from etiolated Pha seolus aureus seedlings. J . Biol. C hem.
247, 3822–3828.
22. Whittaker, A. & Botha, F.C. (1997) C arbon partitioning during
sucrose accumulation in sugarcane internodal tissue. Plant
Physiol. 115, 1651–1659.
23. Vorster, D.J. & Botha, F.C., (1999) Sugarcane Neutral I nvertase.
PhD Thesis, University of Natal, South Africa.
24. Botha, F.C. & Black, K.G. (2000) Sucrose phosphate synthase
and sucrose synthase activity during maturation of intern odal
tissue in sugarc ane. Aust. J. Plant Physiol. 27, 81–85.
Ó FEBS 2004 Sugarcane sucrose synthase kinetics (Eur. J. Biochem. 271) 3977