Plant physiology - Chapter 19 Auxin: The Growth Hormone doc
Bạn đang xem bản rút gọn của tài liệu. Xem và tải ngay bản đầy đủ của tài liệu tại đây (1.25 MB, 38 trang )
Auxin: The Growth Hormone
19
Chapter
THE FORM AND FUNCTION of multicellular organism would not be
possible without efficient communication among cells, tissues, and
organs. In higher plants, regulation and coordination of metabolism,
growth, and morphogenesis often depend on chemical signals from one
part of the plant to another. This idea originated in the nineteenth cen-
tury with the German botanist Julius von Sachs (1832–1897).
Sachs proposed that chemical messengers are responsible for the for-
mation and growth of different plant organs. He also suggested that
external factors such as gravity could affect the distribution of these sub-
stances within a plant. Although Sachs did not know the identity of
these chemical messengers, his ideas led to their eventual discovery.
Many of our current concepts about intercellular communication in
plants have been derived from similar studies in animals. In animals the
chemical messengers that mediate intercellular communication are
called
hormones. Hormones interact with specific cellular proteins called
receptors.
Most animal hormones are synthesized and secreted in one part of
the body and are transferred to specific target sites in another part of the
body via the bloodstream. Animal hormones fall into four general cate-
gories: proteins, small peptides, amino acid derivatives, and steroids.
Plants also produce signaling molecules, called
hormones, that have
profound effects on development at vanishingly low concentrations.
Until quite recently, plant development was thought to be regulated by
only five types of hormones: auxins, gibberellins, cytokinins, ethylene,
and abscisic acid. However, there is now compelling evidence for the
existence of plant steroid hormones, the brassinosteroids, that have a
wide range of morphological effects on plant development. (Brassino-
steroids as plant hormones are discussed in
Web Essay 19.1.)
A variety of other signaling molecules that play roles in resistance to
pathogens and defense against herbivores have also been identified,
including jasmonic acid, salicylic acid, and the polypeptide systemin (see
Chapter 13). Thus the number and types of hormones and hormonelike
signaling agents in plants keep expanding.
The first plant hormone we will consider is auxin. Auxin
deserves pride of place in any discussion of plant hor-
mones because it was the first growth hormone to be dis-
covered in plants, and much of the early physiological
work on the mechanism of plant cell expansion was carried
out in relation to auxin action.
Moreover, both auxin and cytokinin differ from the
other plant hormones and signaling agents in one impor-
tant respect: They are required for viability. Thus far, no
mutants lacking either auxin or cytokinin have been found,
suggesting that mutations that eliminate them are lethal.
Whereas the other plant hormones seem to act as on/off
switches that regulate specific developmental processes,
auxin and cytokinin appear to be required at some level
more or less continuously.
We begin our discussion of auxins with a brief history
of their discovery, followed by a description of their chem-
ical structures and the methods used to detect auxins in
plant tissues. A look at the pathways of auxin biosynthesis
and the polar nature of auxin transport follows. We will
then review the various developmental processes con-
trolled by auxin, such as stem elongation, apical domi-
nance, root initiation, fruit development, and oriented, or
tropic, growth. Finally, we will examine what is currently
known about the mechanism of auxin-induced growth at
the cellular and molecular levels.
THE EMERGENCE OF THE AUXIN
CONCEPT
During the latter part of the nineteenth century, Charles
Darwin and his son Francis studied plant growth phe-
nomena involving tropisms. One of their interests was the
bending of plants toward light. This phenomenon, which
is caused by differential growth, is called
phototropism. In
some experiments the Darwins used seedlings of canary
grass (
Phalaris canariensis), in which, as in many other
grasses, the youngest leaves are sheathed in a protective
organ called the
coleoptile (Figure 19.1).
Coleoptiles are very sensitive to light, especially to blue
light (see Chapter 18). If illuminated on one side with a
short pulse of dim blue light, they will bend (grow) toward
the source of the light pulse within an hour. The Darwins
found that the tip of the coleoptile perceived the light, for
if they covered the tip with foil, the coleoptile would not
bend. But the region of the coleoptile that is responsible for
the bending toward the light, called the
growth zone, is
several millimeters below the tip.
Thus they concluded that some sort of signal is pro-
duced in the tip, travels to the growth zone, and causes the
shaded side to grow faster than the illuminated side. The
results of their experiments were published in 1881 in a
remarkable book entitled
The Power of Movement in Plants.
There followed a long period of experimentation by
many investigators on the nature of the growth stimulus in
coleoptiles. This research culminated in the demonstration
in 1926 by Frits Went of the presence of a growth-promot-
ing chemical in the tip of oat (
Avena sativa) coleoptiles. It
was known that if the tip of a coleoptile was removed,
coleoptile growth ceased. Previous workers had attempted
to isolate and identify the growth-promoting chemical by
grinding up coleoptile tips and testing the activity of the
extracts. This approach failed because grinding up the tis-
sue released into the extract inhibitory substances that nor-
mally were compartmentalized in the cell.
Went’s major breakthrough was to avoid grinding by
allowing the material to diffuse out of excised coleoptile
tips directly into gelatin blocks. If placed asymmetrically
on top of a decapitated coleoptile, these blocks could be
tested for their ability to cause bending in the absence of
a unilateral light source (see Figure 19.1). Because the sub-
stance promoted the elongation of the coleoptile sections
(Figure 19.2), it was eventually named
auxin from the
Greek
auxein, meaning “to increase” or “to grow.”
BIOSYNTHESIS AND METABOLISM
OF AUXIN
Went’s studies with agar blocks demonstrated unequivo-
cally that the growth-promoting “influence” diffusing from
the coleoptile tip was a chemical substance. The fact that it
was produced at one location and transported in minute
amounts to its site of action qualified it as an authentic
plant hormone.
In the years that followed, the chemical identity of the
“growth substance” was determined, and because of its
potential agricultural uses, many related chemical analogs
were tested. This testing led to generalizations about the
chemical requirements for auxin activity. In parallel with
these studies, the agar block diffusion technique was being
applied to the problem of auxin transport. Technological
advances, especially the use of isotopes as tracers, enabled
plant biochemists to unravel the pathways of auxin biosyn-
thesis and breakdown.
Our discussion begins with the chemical nature of auxin
and continues with a description of its biosynthesis, trans-
port, and metabolism. Increasingly powerful analytical
methods and the application of molecular biological
approaches have recently allowed scientists to identify
auxin precursors and to study auxin turnover and distri-
bution within the plant.
The Principal Auxin in Higher Plants Is
Indole-3-Acetic Acid
In the mid-1930s it was determined that auxin is indole-3-
acetic acid
(IAA). Several other auxins in higher plants
were discovered later (Figure 19.3), but IAA is by far the
most abundant and physiologically relevant. Because the
structure of IAA is relatively simple, academic and indus-
trial laboratories were quickly able to synthesize a wide
424 Chapter 19
Auxin: The Growth Hormone 425
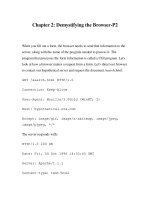
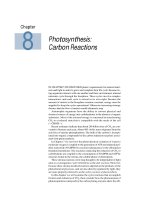
FIGURE 19.1 Summary of early experiments in auxin research.
Intact seedling
(curvature)
Tip of coleoptile
excised
(no curvature)
Opaque cap
on tip
(no curvature)
45°
Darwin (1880)
Light
4-day-old
oat seedling
Coleoptile
Seed
1 cm
Roots
Boysen-Jensen (1913)
Went (1926)
Mica sheet
inserted
on dark side
(no curvature)
Mica sheet
inserted
on light side
(curvature)
Tip removed Gelatin
between tip
and coleoptile
stump
Normal
phototropic
curvature
remains
possible
Tip removed Tip replaced
on one side of
coleoptile stump
Growth curvature
develops without
a unilateral light
stimulus
Coleoptile tips
on gelatin
Tips discarded; gelatin
cut up into smaller
blocks
Coleoptile bends in
total darkness; angle
of curvature can
be measured
Each gelatin
block placed on
one side of
coleoptile stump
IAA in gelatin block (mg/L)
Curvature (degrees)
20
15
10
5
0.05 0.10 0.15 0.20 0.25 0.30
Number of coleoptile
tips on gelatin
Curvature (degrees)
20
15
10
5
0
246810
Paál (1919)
From experiments on
coleoptile phototropism,
Darwin concluded in 1880
that a growth stimulus is
produced in the coleoptile
tip and is transmitted to the
growth zone.
In 1913, P. Boysen-Jensen
discovered that the growth
stimulus passes through
gelatin but not through
water-impermeable barriers
such as mica.
In 1926, F. W. Went showed
that the active growth-
promoting substance can
diffuse into a gelatin block.
He also devised a
coleoptile-bending assay for
quantitative auxin analysis.
In 1919, A. Paál provided
evidence that the growth-
promoting stimulus
produced in the tip was
chemical in nature.
array of molecules with auxin activity. Some of these are
used as herbicides in horticulture and agriculture (Figure
19.4) (for additional synthetic auxins,
see Web Topic 19.1).
An early definition of auxins included all natural and
synthetic chemical substances that stimulate elongation in
coleoptiles and stem sections. However, auxins affect many
developmental processes besides cell elongation. Thus aux-
ins can be defined as compounds with biological activities
similar to those of IAA, including the ability to promote cell
elongation in coleoptile and stem sections, cell division in
callus cultures in the presence of cytokinins, formation of
adventitious roots on detached leaves and stems, and other
developmental phenomena associated with IAA action.
Although they are chemically diverse, a common feature
of all active auxins is a molecular distance of about 0.5 nm
between a fractional positive charge on the aromatic ring and
a negatively charged carboxyl group (
see Web Topic 19.2).
Auxins in Biological Samples Can Be Quantified
Depending on the information that a researcher needs, the
amounts and/or identity of auxins in biological samples
can be determined by bioassay, mass spectrometry, or
enzyme-linked immunosorbent assay, which is abbreviated
as ELISA (
see Web Topic 19.3).
A
bioassay is a measurement of the effect of a known or
suspected biologically active substance on living material. In
his pioneering work more than 60 years ago, Went used
Avena sativa (oat) coleoptiles in a technique called the Avena
coleoptile curvature test (see Figure 19.1). The coleoptile
curved because the increase in auxin on one side stimulated
cell elongation, and the decrease in auxin on the other side
(due to the absence of the coleoptile tip) caused a decrease in
the growth rate—a phenomenon called
differential growth.
Went found that he could estimate the amount of auxin
in a sample by measuring the resulting coleoptile curva-
(A) (B)
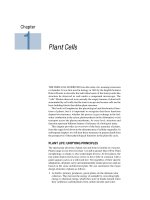
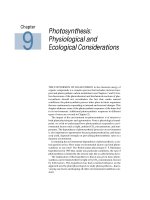
FIGURE 19.2 Auxin stimulates the elongation of oat coleoptile sections. These
coleoptile sections were incubated for 18 hours in either water (A) or auxin (B). The
yellow tissue inside the translucent coleoptile is the primary leaves. (Photos ©
M. B. Wilkins.)
CH
2
N
H
Cl
COOH
CH
2
COOH
N
H
CH
2
CH
2
CH
2
COOH
N
H
Indole-3-acetic acid
(IAA)
4-Chloroindole-3-acetic acid
(4-CI-IAA)
Indole-3-butyric acid
(IBA)
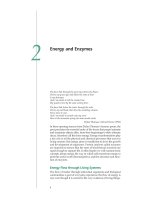
FIGURE 19.3 Structure of three natural auxins. Indole-3-acetic acid (IAA) occurs in
all plants, but other related compounds in plants have auxin activity. Peas, for
example, contain 4-chloroindole-3-acetic acid. Mustards and corn contain indole-3-
butyric acid (IBA).
426 Chapter 19
ture. Auxin bioassays are still used today to detect the pres-
ence of auxin activity in a sample. The
Avena coleoptile cur-
vature assay is a sensitive measure of auxin activity (it is
effective for IAA concentrations of about 0.02 to 0.2 mg
L
–1
). Another bioassay measures auxin-induced changes in
the straight growth of
Avena coleoptiles floating in solution
(see Figure 19.2). Both of these bioassays can establish the
presence of an auxin in a sample, but they cannot be used
for precise quantification or identification of the specific
compound.
Mass spectrometry is the method of choice when infor-
mation about both the chemical structure and the amount
of IAA is needed. This method is used in conjunction with
separation protocols involving gas chromatography. It
allows the precise quantification and identification of aux-
ins, and can detect as little as 10
–12
g (1 picogram, or pg) of
IAA, which is well within the range of auxin found in a sin-
gle pea stem section or a corn kernel. These sophisticated
techniques have enabled researchers to accurately analyze
auxin precursors, auxin turnover, and auxin distribution
within the plant.
IAA Is Synthesized in Meristems,Young Leaves,
and Developing Fruits and Seeds
IAA biosynthesis is associated with rapidly dividing and
rapidly growing tissues, especially in shoots. Although vir-
tually all plant tissues appear to be capable of producing
low levels of IAA, shoot apical meristems, young leaves,
and developing fruits and seeds are the primary sites of
IAA synthesis (Ljung et al. in press).
In very young leaf primordia of
Arabidopsis, auxin is
synthesized at the tip. During leaf development there is a
gradual shift in the site of auxin production basipetally
along the margins, and later, in the central region of the
lamina. The basipetal shift in auxin production correlates
closely with, and is probably causally related to, the
basipetal maturation sequence of leaf development and
vascular differentiation (Aloni 2001).
By fusing the
GUS (β-glucuronidase) reporter gene to
a promoter containing an auxin response element, and
transforming
Arabidopsis leaves with this construct in a Ti
plasmid using
Agrobacterium, it is possible to visualize the
distribution of free auxin in young, developing leaves.
Wherever free auxin is produced,
GUS expression occurs—
and can be detected histochemically. By use of this tech-
nique, it has recently been demonstrated that auxin is
produced by a cluster of cells located at sites where hyda-
thodes will develop (Figure 19.5).
Hydathodes are glandlike modifications of the ground
and vascular tissues, typically at the margins of leaves, that
allow the release of liquid water (guttation fluid) through
pores in the epidermis in the presence of root pressure (see
Chapter 4). As shown in Figure 19.5, during early stages of
hydathode differentiation a center of high auxin synthesis
is evident as a concentrated dark blue GUS stain (arrow) in
the lobes of serrated leaves of
Arabidopsis (Aloni et al. 2002).
A diffuse trail of GUS activity leads down to differentiat-
ing vessel elements in a developing vascular strand. This
remarkable micrograph captures the process of auxin-reg-
ulated vascular differentiation in the very act!
We will return to the topic of the control of vascular dif-
ferentiation later in the chapter.
Cl
O
OCH
3
Cl
Cl
COOH
Cl
CH
2
COOH
2-Methoxy-3,
6-dichlorobenzoic acid
(dicamba)
2,4-Dichlorophenoxyacetic
acid (2,4-D)
FIGURE 19.4 Structures of two synthetic auxins. Most syn-
thetic auxins are used as herbicides in horticulture and
agriculture.
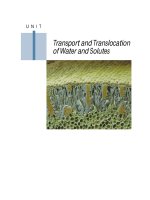
FIGURE 19.5 Detection of sites of auxin synthesis and trans-
port in a young leaf primordium of
DR5 Arabidopsis by
means of a
GUS reporter gene with an auxin-sensitive pro-
moter. During the early stages of hydathode differentiation,
a center of auxin synthesis is evident as a concentrated dark
blue
GUS stain (arrow) in the lobes of the serrated leaf mar-
gin. A gradient of diluted GUS activity extends from the
margin toward a differentiating vascular strand (arrow-
head), which functions as a sink for the auxin flow originat-
ing in the lobe. (Courtesy of R. Aloni and C. I. Ullrich.)
Auxin: The Growth Hormone 427
Multiple Pathways Exist for the Biosynthesis of
IAA
IAA is structurally related to the amino acid tryptophan,
and early studies on auxin biosynthesis focused on trypto-
phan as the probable precursor. However, the incorpora-
tion of exogenous labeled tryptophan (e.g., [
3
H]trypto-
phan) into IAA by plant tissues has proved difficult to
demonstrate. Nevertheless, an enormous body of evidence
has now accumulated showing that plants convert trypto-
phan to IAA by several pathways, which are described in
the paragraphs that follow.
The IPA pathway. The indole-3-pyruvic acid (IPA) path-
way (see Figure 19.6C), is probably the most common of
the tryptophan-dependent pathways. It involves a deam-
ination reaction to form IPA, followed by a decarboxylation
reaction to form indole-3-acetaldehyde (IAld). Indole-3-
acetaldehyde is then oxidized to IAA by a specific dehy-
drogenase.
The TAM pathway. The tryptamine (TAM) pathway (see
Figure 19.6D) is similar to the IPA pathway, except that the
order of the deamination and decarboxylation reactions is
reversed, and different enzymes are involved. Species that
do not utilize the IPA pathway possess the TAM pathway.
In at least one case (tomato), there is evidence for both the
IPA and the TAM pathways (Nonhebel et al. 1993).
The IAN pathway. In the indole-3-acetonitrile (IAN)
pathway (see Figure 19.6B), tryptophan is first converted
to indole-3-acetaldoxime and then to indole-3-acetonitrile.
The enzyme that converts IAN to IAA is called
nitrilase.
The IAN pathway may be important in only three plant
families: the Brassicaceae (mustard family), Poaceae (grass
NH
2
N
H
COOH
N
H
COOH
COOH
N
H
N
O
N
H
NOH
N
H
O
N
H
N
H
NH
2
NH
2
O
N
H
Tryptophan (Trp)
Indole-3-pyruvic acid pathway
Indole-3-acetic acid (IAA)
Indole-3-acetaldehyde (IAld)
Indole-3-pyruvic acid (IPA)
Indole-3-acetaldoxime
IAN
TAM
Bacterial pathway
Indole-3-acetonitrile (IAN)
Tryptamine (TAM)
Indole-3-acetamide (IAM)
Trp
transaminase
*Trp
monooxygenase
*IAM hydrolase
IAld
dehydrogenase
Nitrilase
Trp
decarboxylase
Amine
oxidase
IPA
decarboxylase
(A) (B) (C) (D)
FIGURE 19.6 Tryptophan-dependent pathways of IAA biosynthesis in plants and
bacteria. The enzymes that are present only in bacteria are marked with an asterisk.
(After Bartel 1997.)
428 Chapter 19
family), and Musaceae (banana family). Nevertheless, nitri-
lase-like genes or activities have recently been identified in
the Cucurbitaceae (squash family), Solanaceae (tobacco
family), Fabaceae (legumes), and Rosaceae (rose family).
Four genes (
NIT1 through NIT4) that encode nitrilase
enzymes have now been cloned from
Arabidopsis. When
NIT2 was expressed in transgenic tobacco, the resultant
plants acquired the ability to respond to IAN as an auxin
by hydrolyzing it to IAA (Schmidt et al. 1996).
Another tryptophan-dependent biosynthetic pathway—
one that uses
indole-3-acetamide (IAM) as an intermedi-
ate (see Figure19.6A)—is used by various pathogenic bac-
teria, such as
Pseudomonas savastanoi and Agrobacterium
tumefaciens
. This pathway involves the two enzymes tryp-
tophan monooxygenase and IAM hydrolase. The auxins
produced by these bacteria often elicit morphological
changes in their plant hosts.
In addition to the tryptophan-dependent pathways,
recent genetic studies have provided evidence that plants
can synthesize IAA via one or more tryptophan-indepen-
dent pathways. The existence of multiple pathways for
IAA biosynthesis makes it nearly impossible for plants to
run out of auxin and is probably a reflection of the essen-
tial role of this hormone in plant development.
IAA Is Also Synthesized from Indole or from
Indole-3-Glycerol Phosphate
Although a tryptophan-independent pathway of IAA
biosynthesis had long been suspected because of the low
levels of conversion of radiolabeled tryptophan to IAA, not
until genetic approaches were available could the existence
of such pathways be confirmed and defined. Perhaps the
most striking of these studies in maize involves the
orange
pericarp
(orp) mutant (Figure 19.7), in which both subunits
of the enzyme tryptophan synthase are inactive (Figure
19.8). The
orp mutant is a true tryptophan auxotroph,
requiring exogenous tryptophan to survive. However, nei-
ther the
orp seedlings nor the wild-type seedlings can con-
vert tryptophan to IAA, even when the mutant seedlings
are given enough tryptophan to reverse the lethal effects of
the mutation.
Despite the block in tryptophan biosynthesis, the
orp
mutant contains amounts of IAA 50-fold higher than those
of a wild-type plant (Wright et al. 1991). Signficantly, when
orp seedlings were fed [
15
N]anthranilate (see Figure 19.8),
the label subsequently appeared in IAA, but not in trypto-
phan. These results provided the best experimental evi-
dence for a tryptophan-independent pathway of IAA
biosynthesis.
Further studies established that the branch point for
IAA biosynthesis is either indole or its precursor, indole-3-
glycerol phosphate (see Figure 19.8). IAN and IPA are pos-
sible intermediates, but the immediate precursor of IAA in
the tryptophan-independent pathway has not yet been
identified.
The discovery of the tryptophan-independent pathway
has drastically altered our view of IAA biosynthesis, but
the relative importance of the two pathways (tryptophan-
dependent versus tryptophan-independent) is poorly
understood. In several plants it has been found that the
type of IAA biosynthesis pathway varies between different
tissues, and between different times of development. For
example, during embryogenesis in carrot, the tryptophan-
dependent pathway is important very early in develop-
ment, whereas the tryptophan-independent pathway takes
over soon after the root–shoot axis is established. (For more
evidence of the tryptophan-independent biosynthesis of
IAA, see
Web Topic 19.4.)
Most IAA in the Plant Is in a Covalently Bound
Form
Although free IAA is the biologically active form of the
hormone, the vast majority of auxin in plants is found in a
covalently bound state. These conjugated, or “bound,” aux-
ins have been identified in all higher plants and are con-
sidered hormonally inactive.
IAA has been found to be conjugated to both high- and
low-molecular-weight compounds.
• Low-molecular-weight conjugated auxins include
esters of IAA with glucose or
myo-inositol and amide
conjugates such as IAA-
N-aspartate (Figure 19.9).
• High-molecular-weight IAA conjugates include IAA-
glucan (7–50 glucose units per IAA) and IAA-glyco-
proteins found in cereal seeds.
The compound to which IAA is conjugated and the extent
of the conjugation depend on the specific conjugating
enzymes. The best-studied reaction is the conjugation of
IAA to glucose in
Zea mays.
The highest concentrations of free auxin in the living
plant are in the apical meristems of shoots and in young
leaves because these are the primary sites of auxin synthe-
FIGURE 19.7 The orange pericarp (orp) mutant of maize is
missing both subunits of tryptophan synthase. As a result,
the pericarps surrounding each kernel accumulate glyco-
sides of anthranilic acid and indole. The orange color is due
to excess indole. (Courtesy of Jerry D. Cohen.)
Auxin: The Growth Hormone 429
sis. However, auxins are widely distributed in the plant.
Metabolism of conjugated auxin may be a major con-
tributing factor in the regulation of the levels of free auxin.
For example, during the germination of seeds of
Zea mays,
IAA-
myo-inositol is translocated from the endosperm to the
coleoptile via the phloem. At least a portion of the free IAA
produced in coleoptile tips of
Zea mays is believed to be
derived from the hydrolysis of IAA-
myo-inositol.
In addition, environmental stimuli such as light and
gravity have been shown to influence both the rate of auxin
conjugation (removal of free auxin) and the rate of release
of free auxin (hydrolysis of conjugated auxin). The forma-
tion of conjugated auxins may serve other functions as
well, including storage and protection against oxidative
degradation.
IAA Is Degraded by Multiple Pathways
Like IAA biosynthesis, the enzymatic breakdown (oxida-
tion) of IAA may involve more than one pathway. For
some time it has been thought that peroxidative enzymes
are chiefly responsible for IAA oxidation, primarily
because these enzymes are ubiquitous in higher plants and
their ability to degrade IAA can be demonstrated in vitro
(Figure 19.10A). However, the physiological significance of
the peroxidase pathway is unclear. For example, no change
in the IAA levels of transgenic plants was observed with
either a tenfold increase in peroxidase expression or a ten-
fold repression of peroxidase activity (Normanly et al.
1995).
On the basis of isotopic labeling and metabolite identi-
fication, two other oxidative pathways are more likely to
be involved in the controlled degradation of IAA (see Fig-
ure 19.10B). The end product of this pathway is oxindole-
3-acetic acid (OxIAA), a naturally occurring compound in
the endosperm and shoot tissues of
Zea mays. In one path-
way, IAA is oxidized without decarboxylation to OxIAA.
N
H
OH
CH
2
OP
OH
N
H
N
N
H
O
COOH
N
H
COOH
N
H
NH
2
COOH
N
H
Chorismate
Anthranilate
synthase
Anthranilate
Anthranilate
PR-transferase
5-Phosphoribosylanthranilate
Feedback inhibition
PR-anthranilate
isomerase
IGP synthase
Trp synthase a
(trp3)
Trp synthase b
(trp2, orp)
Trypotophan
aminotransferase
(hypothetical)
Serine +
1-(o-Carboxyphenylamino)-1-
deoxyribulose 5-P
Indole-3-glycerol phosphate
(IGP)
Indole
Trp
?
Indole-3-acetonitrile
(IAN)
Indole-3-pyruvic acid (IPA)
Nitrilase
(nit1)
TRYPTOPHAN-INDEPENDENT PATHWAYS OF IAA SYNTHESIS
TRYPTOPHAN BIOSYNTHETIC PATHWAY
IAA
FIGURE 19.8 Tryptophan-independent pathways of IAA biosynthesis in
plants. The tryptophan (Trp) biosynthetic pathway is shown on the left.
Mutants discussed in
Web Topic 19.4 are indicated in parentheses. The
branch-point precursor for tryptophan-independent biosynthesis is
uncertain (indole-3-glycerol phosphate or indole), and IAN and IPA are
two possible intermediates. PR, phosphoribosyl. (After Bartel 1997.)
430 Chapter 19
In another pathway, the IAA-aspartate conjugate is oxi-
dized first to the intermediate dioxindole-3-acetylaspartate,
and then to OxIAA.
In vitro, IAA can be oxidized nonenzymatically when
exposed to high-intensity light, and its photodestruction in
vitro can be promoted by plant pigments such as
riboflavin. Although the products of auxin photooxidation
have been isolated from plants, the role, if any, of the pho-
tooxidation pathway in vivo is presumed to be minor.
Two Subcellular Pools of IAA Exist: The Cytosol
and the Chloroplasts
The distribution of IAA in the cell appears to be regulated
largely by pH. Because IAA
−
does not cross membranes
unaided, whereas IAAH readily diffuses across membranes,
O
O
O
CH
2
COOH
CH
2
CH
2
C
CH
2
C C H
COOH
CH
2
COOH
N
H
O
C
O
H
H
H
HO
OH
OH
H
CH
2
OH
H
O
H
OH
H
OH
H
OH
H
H
OH
HO
H
N
H
N
H
N
H
N
H
Indole-3-acetic acid
Indoleacetyl-β-
D-glucose
Indoleacetyl-2-O-myo-inositol
Indoleacetylaspartate
Aspartate
UDP-glucose
myo-Inositol
FIGURE 19.9 Structures and proposed metabolic pathways of bound
auxins. The diagram shows structures of various IAA conjugates and
proposed metabolic pathways involved in their synthesis and break-
down. Single arrows indicate irreversible pathways; double arrows,
reversible.
O
B
Aspartate
O
COOH
CH
2
O
O
COOH
N
H
N
H
O
Aspartate
N
H
N
H
N
H
A
Oxindole-3-acetic acid
(OxIAA)
Indole-3-acetylaspartate
Dioxindole-3-
acetylaspartate
Conjugation
(A) Decarboxylation: A minor pathway
(B) Nondecarboxylation pathways
3-Methyleneoxindole
Indole-3-acetic acid
Peroxidase
CO
2
FIGURE 19.10 Biodegradation of IAA. (A) The peroxidase
route (decarboxylation pathway) plays a relatively minor
role. (B) The two nondecarboxylation routes of IAA oxida-
tive degradation, A and B, are the most common metabolic
pathways.
Auxin: The Growth Hormone 431
auxin tends to accumulate in the more alka-
line compartments of the cell.
The distribution of IAA and its metabo-
lites has been studied in tobacco cells. About
one-third of the IAA is found in the chloro-
plast, and the remainder is located in the
cytosol. IAA conjugates are located exclu-
sively in the cytosol. IAA in the cytosol is
metabolized either by conjugation or by non-
decarboxylative catabolism (see Figure 19.10).
The IAA in the chloroplast is protected from
these processes, but it is regulated by the
amount of IAA in the cytosol, with which it is
in equilibrium (Sitbon et al. 1993).
The factors that regulate the steady-state
concentration of free auxin in plant cells are
diagrammatically summarized in
Web Topic
19.5.
AUXIN TRANSPORT
The main axes of shoots and roots, along with their
branches, exhibit apex–base structural polarity, and this
structural polarity has its origin in the polarity of auxin
transport. Soon after Went developed the coleoptile curva-
ture test for auxin, it was discovered that IAA moves
mainly from the apical to the basal end (
basipetally) in
excised oat coleoptile sections. This type of unidirectional
transport is termed
polar transport. Auxin is the only plant
growth hormone known to be transported polarly.
Because the shoot apex serves as the primary source of
auxin for the entire plant, polar transport has long been
believed to be the principal cause of an auxin gradient
extending from the shoot tip to the root tip. The longitudi-
nal gradient of auxin from the shoot to the root affects var-
ious developmental processes, including stem elongation,
apical dominance, wound healing, and leaf senescence.
Recently it has been recognized that a significant
amount of auxin transport also occurs in the phloem, and
that the phloem is probably the principal route by which
auxin is transported
acropetally (i.e., toward the tip) in the
root. Thus, more than one pathway is responsible for the
distribution of auxin in the plant
Polar Transport Requires Energy and Is Gravity
Independent
To study polar transport, researchers have employed the
donor–receiver agar block method (Figure 19.11): An agar block
containing radioisotope-labeled auxin (donor block) is placed
on one end of a tissue segment, and a receiver block is placed
on the other end. The movement of auxin through the tissue
into the receiver block can be determined over time by mea-
surement of the radioactivity in the receiver block.
From a multitude of such studies, the general properties
of polar IAA transport have emerged. Tissues differ in the
degree of polarity of IAA transport. In coleoptiles, vegeta-
tive stems, and leaf petioles, basipetal transport predomi-
nates. Polar transport is not affected by the orientation of
the tissue (at least over short periods of time), so it is inde-
pendent of gravity.
A simple demonstration of the lack of effect of gravity
on polar transport is shown in Figure 19.12. When stem
cuttings (in this case bamboo) are placed in a moist cham-
ber, adventitious roots always form at the basal end of the
cuttings, even when the cuttings are inverted. Because root
differentiation is stimulated by an increase in auxin con-
centration, auxin must be transported basipetally in the
stem even when the cutting is oriented upside down.
Polar transport proceeds in a cell-to-cell fashion, rather
than via the symplast. That is, auxin exits the cell through
the plasma membrane, diffuses across the compound mid-
dle lamella, and enters the cell below through its plasma
membrane. The loss of auxin from cells is termed
auxin
efflux
; the entry of auxin into cells is called auxin uptake or
influx. The overall process requires metabolic energy, as evi-
denced by the sensitivity of polar transport to O
2
depriva-
tion and metabolic inhibitors.
The velocity of polar auxin transport is 5 to 20 cm h
–1
—
faster than the rate of diffusion (
see Web Topic 3.2), but
slower than phloem translocation rates (see Chapter 10).
Polar transport is also specific for active auxins, both nat-
ural and synthetic. Neither inactive auxin analogs nor
auxin metabolites are transported polarly, suggesting that
polar transport involves specific protein carriers on the
plasma membrane that can recognize the hormone and its
active analogs.
The major site of basipetal polar auxin transport in stems
and leaves is the vascular parenchyma tissue. Coleoptiles
appear to be the exception in that basipetal polar transport
Shoot
apex
Seedling
Hypocotyl
Apical end (A)
Excised
section
Invert
A (donor)
B (receiver)
Transport into
receiver takes place
Basal end (B)
B (donor)
A (receiver)
Transport into
receiver is blocked
Agar donor block containing
radiolabeled auxin
FIGURE 19.11 The standard method for measuring polar auxin transport.
The polarity of transport is independent of orientation with respect to
gravity.
432 Chapter 19
occurs mainly in the nonvascular tissues. Acropetal polar
transport in the root is specifically associated with the
xylem parenchyma of the stele (Palme and Gälweiler 1999).
However, as we shall see later in the chapter, most of the
auxin that reaches the root tip is translocated via the
phloem.
A small amount of basipetal auxin transport from the
root tip has also been demonstrated. In maize roots, for
example, radiolabeled IAA applied to the root tip is trans-
ported basipetally about 2 to 8 mm (Young and Evans
1996). Basipetal auxin transport in the root occurs in the
epidermal and cortical tissues, and as we shall see, it plays
a central role in gravitropism.
A Chemiosmotic Model Has Been Proposed to
Explain Polar Transport
The discovery of the chemiosmotic mechanism of solute
transport in the late 1960s (see Chapter 6) led to the appli-
cation of this model to polar auxin transport. According to
the now generally accepted
chemiosmotic model for polar
auxin transport, auxin uptake is driven by the proton
motive force (
∆E + ∆pH) across the plasma membrane,
while auxin efflux is driven by the membrane potential,
∆E.
(Proton motive force is described in more detail in
Web
Topic 6.3 and Chapter 7.)
A crucial feature of the polar transport model is that the
auxin efflux carriers are localized at the basal ends of the
conducting cells (Figure 19.13). The evidence for each step
in this model is considered separately in the discussion that
follows.
Auxin influx. The first step in polar transport is auxin
influx. According to the model, auxin can enter plant cells
from any direction by either of two mechanisms:
1. Passive diffusion of the protonated (IAAH) form
across the phospholipid bilayer
2. Secondary active transport of the dissociated (IAA
–
)
form via a 2H
+
–IAA
–
symporter
The dual pathway of auxin uptake arises because the pas-
sive permeability of the membrane to auxin depends
strongly on the apoplastic pH.
The undissociated form of indole-3-acetic acid, in which
the carboxyl group is protonated, is lipophilic and readily
diffuses across lipid bilayer membranes. In contrast, the dis-
sociated form of auxin is negatively charged and therefore
does not cross membranes unaided. Because the plasma
membrane H
+
-ATPase normally maintains the cell wall solu-
tion at about pH 5, about half of the auxin (pK
a
= 4.75) in the
apoplast will be in the undissociated form and will diffuse
passively across the plasma membrane down a concentra-
tion gradient. Experimental support for pH-dependent, pas-
sive auxin uptake was first provided by the demonstration
that IAA uptake by plant cells increases as the extracellular
pH is lowered from a neutral to a more acidic value.
A carrier-mediated, secondary active uptake mechanism
was shown to be saturable and specific for active auxins
(Lomax 1986). In experiments in which the
∆pH and ∆E
values of isolated membrane vesicles from zucchini (Cucur-
bita pepo
) hypocotyls were manipulated artificially, the
uptake of radiolabeled auxin was shown to be stimulated
in the presence of a pH gradient, as in passive uptake, but
also when the inside of the vesicle was negatively charged
relative to the outside.
These and other experiments suggested that an
H
+
–IAA
–
symporter cotransports two protons along with
the auxin anion. This secondary active transport of auxin
allows for greater auxin accumulation than simple diffu-
sion does because it is driven across the membrane by the
proton motive force.
A permease-type auxin uptake carrier, AUX1, related to
bacterial amino acid carriers, has been identified in
Ara-
bidopsis
roots (Bennett et al. 1996). The roots of aux1
mutants are agravitropic, suggesting that auxin influx is a
limiting factor for gravitropism in roots. As predicted by
the chemiosmotic model, AUX1 appears to be uniformly
distributed around cells in the polar transport pathway
(Marchant et al. 1999). Thus in general, the polarity of auxin
transport is governed by the efflux step rather than the
influx step.
FIGURE 19.12 Roots grow from the basal ends of these bam-
boo sections, even when they are inverted. The roots form at
the basal end because polar auxin transport in the shoot is
independent of gravity. (Photo ©M. B. Wilkins.)
Auxin: The Growth Hormone 433
Auxin efflux. Once IAA enters the cytosol,
which has a pH of approximately 7.2,
nearly all of it will dissociate to the anionic
form. Because the membrane is less per-
meable to IAA
–
than to IAAH, IAA
–
will
tend to accumulate in the cytosol. How-
ever, much of the auxin that enters the cell
escapes via an
auxin anion efflux carrier.
According to the chemiosmotic model,
transport of IAA
–
out of the cell is driven
by the inside negative membrane potential.
As noted earlier, the central feature of
the chemiosmotic model for polar transport
is that IAA
–
efflux takes place preferentially
at the basal end of each cell. The repetition
of auxin uptake at the apical end of the cell
and preferential release from the base of
each cell in the pathway gives rise to the
total polar transport effect. A family of
putative auxin efflux carriers known as
PIN proteins (named after the pin-shaped
inflorescences formed by the
pin1 mutant
of
Arabidopsis; Figure 19.14A) are localized
precisely as the model would predict—that
is, at the basal ends of the conducting cells
(see Figure 19.14B).
H
+
Plasma
membrane
Cell wall
Apex
IAA
–
pH 5
2H
+
IAAH
IAA
–
IAA
–
IAA
–
IAAH
ATP
ATP
IAAH
pH 7
H
+
H
+
H
+
Vacuole
Base
Permease
H
+
-cotransport
Cytosol
ATP
H
+
IAA
–
ATP
H
+
ATP
H
+
1. IAA enters the cell either
passively in the undissociated
form (IAAH) or by secondary
active cotransport in the
anionic form (IAA
–
).
2. The cell wall is maintained
at an acidic pH by the activity
of the plasma membrane H
+
-
ATPase.
3. In the cytosol, which has a
neutral pH, the anionic form
(IAA
–
) predominates.
4. The anions exit the cell via
auxin anion efflux carriers
that are concentrated at the
basal ends of each cell in the
longitudinal pathway.
FIGURE 19.13 The chemiosmotic model for
polar auxin transport. Shown here is one cell
in a column of auxin-transporting cells.
(From Jacobs and Gilbert 1983.)
FIGURE 19.14 The pin1 mutant of
Arabidopsis (A) and localization of the
PIN1 protein at the basal ends of con-
ducting cells by immunofluorescence
microscopy (B). (Courtesy of L.
Gälweiler and K. Palme.)
(A)
(B)
434 Chapter 19
PIN proteins have 10 to 12 transmembrane regions char-
acteristic of a major superfamily of bacterial and eukary-
otic transporters, which include drug resistance proteins
and sugar transporters (Figure 19.15). Despite topological
similarities to other transporters, recent studies suggest that
PIN may require other proteins for activity, and may be
part of a larger protein complex.
Inhibitors of Auxin Transport Block Auxin Efflux
Several compounds have been synthesized that can act as
auxin transport inhibitors (ATIs), including NPA (1-N-
naphthylphthalamic acid) and TIBA (2,3,5-triiodobenzoic
acid) (Figure 19.16). These inhibitors block polar transport
by preventing auxin efflux. We can demonstrate this phe-
nomenon by incorporating NPA or TIBA into either the
donor or the receiver block in an auxin transport experi-
ment. Both compounds inhibit auxin efflux into the
receiver block, but they do not affect auxin uptake from
the donor block.
Some ATIs, such as TIBA, that have weak auxin activity
and are transported polarly, may inhibit polar transport in
part by competing with auxin for its binding site on the
efflux carrier. Others, such as NPA, are not transported
polarly and are believed to interfere with auxin transport
by binding to proteins associated in a complex with the
efflux carrier. Such NPA-binding proteins are also found at
the basal ends of the conducting cells, consistent with the
localization of PIN proteins (Jacobs and Gilbert 1983).
Recently another class of ATIs has been identified that
inhibits the AUX1 uptake carrier (Parry et al. 2001). For
example, 1-naphthoxyacetic acid (1-NOA) (see Figure
19.16) blocks auxin uptake into cells, and when applied to
Arabidopsis plants it causes root agravitropism similar to
that of the
aux1 mutant. Like the aux1 mutation, neither 1-
NOA nor any of the other AUX1-specific inhibitors block
polar auxin transport.
PIN Proteins Are Rapidly Cycled to and from the
Plasma Membrane
The basal localization of the auxin efflux carriers involves
targeted vesicle secretion to the basal ends of the conduct-
ing cells. Recently it has been demonstrated that PIN pro-
teins, although stable, do not remain on the plasma mem-
brane permanently, but are rapidly cycled to an
unidentified endosomal compartment via endocytotic vesi-
cles, and then recycled back to the plasma membrane
(Geldner et al. 2001).
CYTOPLASM
NH
2
COOH
OUTSIDE OF CELL
I II III IV V VI VII
VIII
XI X
Plasma
membrane
FIGURE 19.15 The topology of the PIN1 protein with ten
transmembrane segments and a large hydrophilic loop in
the middle. (After Palme and Gälweiler 1999.)
O
NH
O
HO
I
I
I
O
OH
O
OHO—CH
2
—COOH
OH
HO
O
O
OH
OH
OH
OH
HO
O
NPA (1-N-naphthylphthalamic acid)
Auxin transport inhibitors not found in plants
Naturally occurring auxin
transport inhibitors
TIBA (2,3,5-triiodobenzoic acid)
Genistein
Quercetin (flavonol)
1-NOA (1-naphthoxyacetic acid)
FIGURE 19.16 Structures of auxin transport inhibitors.
Auxin: The Growth Hormone 435
Prior to treatment, the PIN1 protein is localized at the
basal ends (top) of root cortical parenchyma cells (Figure
19.17A). Treatment of
Arabidopsis seedlings with brefeldin
A (BFA), which causes Golgi vesicles and other endosomal
compartments to aggregate near the nucleus, causes PIN
to accumulate in these abnormal intracellular compart-
ments (see Figure 19.17B). When the BFA is washed out
with buffer, the normal localization on the plasma mem-
brane at the base of the cell is restored (see Figure 19.17C).
But when cytochalasin D, an inhibitor of actin polymer-
ization, is included in the buffer washout solution, normal
relocalization of PIN to the plasma membrane is prevented
(see Figure 19.17D). These results indicate that PIN is
rapidly cycled between the plasma membrane at the base
of the cell and an unidentified endosomal compartment by
an actin-dependent mechanism.
Although they bind different targets, both TIBA and NPA
interfere with vesicle traffic to and from the plasma mem-
brane. The best way to demonstrate this phenomenon is to
include TIBA in the washout solution after BFAtreatment.
Under these conditions, TIBA prevents the normal relocal-
ization of PIN on the plasma membrane following the
washout treatment (see Figure 19.17E) (Geldner et al. 2001).
The effects of TIBA and NPA on cycling are not specific
for PIN proteins, and it has been proposed that ATIs may
actually represent general inhibitors of membrane cycling
(Geldner et al. 2001). On the other hand, neither TIBA nor
NPA alone causes PIN delocalization, even though they
block auxin efflux. Therefore, TIBA and NPA must also be
able to directly inhibit the transport activity of PIN com-
plexes on the plasma membrane—by binding either to PIN
(as TIBA does) or to one or more regulatory proteins (as
NPA does).
A simplified model of the effects of TIBA and NPAon
PIN cycling and auxin efflux is shown in Figure 19.18. A
more complete model that incorporates many of the recent
findings is presented in
Web Essay 19.2.
Flavonoids Serve as Endogenous ATIs
There is mounting evidence that flavonoids (see Chapter
13) can function as endogenous regulators of polar auxin
transport. Indeed, naturally occurring aglycone flavonoid
compounds (flavonoids without attached sugars) are able
to compete with NPA for its binding site on membranes
(Jacobs and Rubery 1988) and are typically localized on the
plasma membrane at the basal ends of cells where the
FIGURE 19.17 Auxin transport
inhibitors block secretion of the auxin
efflux carrier PIN1 to the plasma
membrane. (A) Control, showing
asymmetric localization of PIN1. (B)
After treatment with brefeldin A (BFA).
(C) Following an additional two-hour
washout of BFA. (D) Following a BFA
washout with cytochalasin D. (E)
Following a BFA washout with the
auxin transport inhibitor TIBA.
(Photos courtesy of Klaus Palme 1999.)
(A) (B)
(D) (E)
(C)
436 Chapter 19
efflux carrier is concentrated (Peer et al. 2001). In addition,
recent studies have shown that the cells of flavonoid-defi-
cient
Arabidopsis mutants are less able to accumulate auxin
than wild-type cells, and the mutant seedlings that lack
flavonoid have altered auxin distribution profiles (Murphy
et al. 1999; Brown et al. 2001).
Many of the flavonoids that displace NPA from its bind-
ing site on membranes are also inhibitors of protein kinases
and protein phosphatases (Bernasconi 1996). An
Arabidop-
sis
mutant designated rcn1 (roots curl in NPA 1) was iden-
tified on the basis of an enhanced sensitivity to NPA. The
RCN1 gene is closely related to the regulatory subunit of
protein phosphatase 2A, a serine/threonine phosphatase
(Garbers et al. 1996).
Protein phosphatases are known to play important roles
in enzyme regulation, gene expression, and signal trans-
duction by removing regulatory phosphate groups from
proteins (see Chapter 14 on the web site). This finding sug-
gests that a signal transduction pathway involving protein
kinases and protein phosphatases may be involved in sig-
naling between NPA-binding proteins and the auxin efflux
carrier.
Auxin Is Also Transported Nonpolarly in the
Phloem
Most of the IAA that is synthesized in mature leaves
appears to be transported to the rest of the plant nonpo-
larly via the phloem. Auxin, along with other components
of phloem sap, can move from these leaves up or down the
plant at velocities much higher than those of polar trans-
port (see Chapter 10). Auxin translocation in the phloem is
largely passive, not requiring energy directly.
Although the overall importance of the phloem path-
way versus the polar transport system for the long-distance
movement of IAA in plants is still unresolved, the evidence
suggests that long-distance auxin transport in the phloem
is important for controlling such processes as cambial cell
divisions, callose accumulation or removal from sieve tube
elements, and branch root formation. Indeed, the phloem
appears to represent the principal pathway for long-dis-
tance auxin translocation to the root (Aloni 1995; Swarup
et al. 2001).
Polar transport and phloem transport are not indepen-
dent of each other. Recent studies with radiolabeled IAA
suggest that in pea, auxin can be transferred from the non-
polar phloem pathway to the polar transport pathway. This
transfer takes place mainly in the immature tissues of the
shoot apex.
A second example of transfer of auxin from the nonpo-
lar phloem pathway to a polar transport system has
recently been documented in
Arabidopsis. It was shown that
the AUX1 permease is asymmetrically localized on the
plasma membrane at the upper end of root protophloem
cells (i.e., the end distal from the tip) (Figure 19.19).
It has been proposed that the asymmetrically oriented
AUX1 permease promotes the acropetal movement of
auxin from the phloem to the root apex (Swarup et al.
2001). This type of polar auxin transport based on the
asymmetric localization of AUX1 differs from the polar
transport that occurs in the shoot and basal region of the
root, which is based on the asymmetric distribution of the
PIN complex.
Note in Figure 19.19B that AUX1 is also strongly
expressed in a cluster of cells in the columella of the root
cap, as well as in lateral root cap cells that overlay the cells
of the distal elongation zone of the root. These cells form a
minor, but physiologically important, basipetal pathway
whereby auxin reaching the columella is redirected back-
ward toward the outer tissues of the elongation zone. The
importance of this pathway will become apparent when
we examine the mechanism of root gravitropism.
Actin-
dependent
cycling
ENDOSOMAL
COMPARTMENT
Plasma
membrane
PIN complex
Actin
microfilament
TIBA,
NPA
Vesicle Vesicle
PINPIN
PIN PIN
PIN
PIN
FIGURE 19.18 Actin-dependent PIN cycling between the
plasma membrane and an endosomal compartment. Auxin
transport inhibitors TIBA and NPA both interfere with relo-
calization of PIN1 proteins to basal plasma membranes
after BFA washout (see Figure 19.17). This suggests that
both of these auxin transport inhibitors interfere with PIN1
cycling.
Auxin: The Growth Hormone 437
PHYSIOLOGICAL EFFECTS OF AUXIN:
CELL ELONGATION
Auxin was discovered as the hormone involved in the
bending of coleoptiles toward light. The coleoptile bends
because of the unequal rates of cell elongation on its
shaded versus its illuminated side (see Figure 19.1). The
ability of auxin to regulate the rate of cell elongation has
long fascinated plant scientists. In this section we will
review the physiology of auxin-induced cell elongation,
some aspects of which were discussed in Chapter 15.
Auxins Promote Growth in Stems and Coleoptiles,
While Inhibiting Growth in Roots
As we have seen, auxin is synthesized in the shoot apex
and transported basipetally to the tissues below. The steady
supply of auxin arriving at the subapical region of the stem
or coleoptile is required for the continued elongation of
these cells. Because the level of endogenous auxin in the
elongation region of a normal healthy plant is nearly opti-
mal for growth, spraying the plant with exogenous auxin
causes only a modest and short-lived stimulation in
growth, and may even be inhibitory in the case of dark-
grown seedlings, which are more sensitive to supraoptimal
auxin concentrations than light-grown plants are.
However, when the endogenous source of auxin is
removed by excision of sections containing the elongation
zones, the growth rate rapidly decreases to a low basal rate.
Such excised sections will often respond dramatically to
exogenous auxin by rapidly increasing their growth rate
back to the level in the intact plant.
In long-term experiments, treatment of excised sections
of coleoptiles (see Figure 19.2) or dicot stems with auxin
stimulates the rate of elongation of the section for up to 20
hours (Figure 19.20). The optimal auxin concentration for
elongation growth is typically 10
–6
to 10
–5
M (Figure 19.21).
Epidermis
Cortex
Endodermis
Pericycle
Vasculature
Lateral root cap
Quiescent center
and stem cells
Columella of
root cap
(A) (B)
(C)
FIGURE 19.19 The auxin permease AUX1 is specifically
expressed in a subset of columella, lateral root cap, and
stellar tissues. (A) Diagram of tissues in the
Arabidopsis root
tip. (B) Immunolocalization of AUX1 in protophloem cells
of the stele, a central cluster of cells in the columella, and
lateral root cap cells. (C) Asymmetric localization of AUX1
in a file of protophloem cells. Scale bar is 2
µm in C.
(From Swarup et al. 2001.)
20 mm
438 Chapter 19
The inhibition beyond the optimal concentration is gener-
ally attributed to auxin-induced ethylene biosynthesis. As
we will see in Chapter 22, the gaseous hormone ethylene
inhibits stem elongation in many species.
Auxin control of root elongation growth has been more
difficult to demonstrate, perhaps because auxin induces the
production of ethylene, a root growth inhibitor. However,
even if ethylene biosynthesis is specifically blocked, low
concentrations (10
–10
to 10
–9
M) of auxin promote the
growth of intact roots, whereas higher concentrations (10
–6
M) inhibit growth. Thus, roots may require a minimum
concentration of auxin to grow, but root growth is strongly
inhibited by auxin concentrations that promote elongation
in stems and coleoptiles.
The Outer Tissues of Dicot Stems Are the Targets
of Auxin Action
Dicot stems are composed of many types of tissues and
cells, only some of which may limit the growth rate. This
point is illustrated by a simple experiment. When stem sec-
tions from growing regions of an etiolated dicot stem, such
as pea, are split lengthwise and incubated in buffer, the two
halves bend outward.
This result indicates that, in the absence of auxin the
central tissues, including the pith, vascular tissues, and
inner cortex, elongate at a faster rate than the outer tissues,
consisting of the outer cortex and epidermis. Thus the
outer tissues must be limiting the extension rate of the stem
in the absence of auxin. However, when the split sections
are incubated in buffer plus auxin, the two halves now
curve inward, demonstrating that the outer tissues of dicot
stems are the primary targets of auxin action during cell
elongation.
The observation that the outer cell layers are the targets
of auxin seems to conflict with the localization of polar
transport in the parenchyma cells of the vascular bundles.
However, auxin can move laterally from the vascular tis-
sues of dicot stems to the outer tissues of the elongation
zone. In coleoptiles, on the other hand, all of the nonvas-
cular tissues (epidermis plus mesophyll) are capable of
transporting auxin, as well as responding to it.
The Minimum Lag Time for Auxin-Induced Growth
Is Ten Minutes
When a stem or coleoptile section is excised and inserted
into a sensitive growth-measuring device, the growth
response to auxin can be monitored at very high resolution.
Without auxin in the medium, the growth rate declines
rapidly. Addition of auxin markedly stimulates the growth
rate after a lag period of only 10 to 12 minutes (see the inset
in Figure 19.20).
Both
Avena (oat) coleoptiles and Glycine max (soybean)
hypocotyls (dicot stem) reach a maximum growth rate after
0
1
2
0
Time (hours)
Growth (mm)
Elongation (% increase in length)
60
30
90
030
IAA + Suc
IAA
Suc
2010
510
Time (min)
15 20 25
IAA
Lag phase
FIGURE 19.20 Time course for auxin-induced growth of
Avena (oat) coleoptile sections. Growth is plotted as the per-
cent increase in length. Auxin was added at time zero.
When sucrose (Suc) is included in the medium, the response
can continue for as long as 20 hours. Sucrose prolongs the
growth response to auxin mainly by providing osmotically
active solute that can be taken up for the maintenance of
turgor pressure during cell elongation. KCl can substitute
for sucrose. The inset shows a short-term time course plot-
ted with an electronic position-sensing transducer. In this
graph, growth is plotted as the absolute length in millime-
ters versus time. The curve shows a lag time of about 15
minutes for auxin-stimulated growth to begin. (From
Cleland 1995.)
IAA concentration (M)
Control growth
(no added IAA)
+IAA
Relative segment elongation growth
0
–
+
10
–8
10
–7
10
–6
10
–5
10
–4
10
–3
10
–2
FIGURE 19.21 Typical dose–response curve for IAA-induced growth in
pea stem or oat coleoptile sections. Elongation growth of excised sections
of coleoptiles or young stems is plotted versus increasing concentrations of
exogenous IAA. At higher concentrations (above 10
–5
M), IAA becomes less
and less effective; above about 10
–4
M it becomes inhibitory, as shown by the
fact that the curve falls below the dashed line, which represents growth in
the absence of added IAA.
Auxin: The Growth Hormone 439
30 to 60 minutes of auxin treatment (Figure 19.22). This
maximum represents a five- to tenfold increase over the
basal rate. Oat coleoptile sections can maintain this maxi-
mum rate for up to 18 hours in the presence of osmotically
active solutes such as sucrose or KCl.
As might be expected, the stimulation of growth by
auxin requires energy, and metabolic inhibitors inhibit the
response within minutes. Auxin-induced growth is also sen-
sitive to inhibitors of protein synthesis such as cyclohex-
imide, suggesting that proteins with high turnover rates are
involved. Inhibitors of RNA synthesis also inhibit auxin-
induced growth, after a slightly longer delay (Cleland 1995).
Although the length of the lag time for auxin-stimulated
growth can be increased by lowering of the temperature or
by the use of suboptimal auxin concentrations, the lag time
cannot be shortened by raising of the temperature, by the
use of supraoptimal auxin concentrations, or by abrasion
of the waxy cuticle to allow auxin to penetrate the tissue
more rapidly. Thus the minimum lag time of 10 minutes is
not determined by the time required for auxin to reach its
site of action. Rather, the lag time reflects the time needed
for the biochemical machinery of the cell to bring about the
increase in the growth rate
.
Auxin Rapidly Increases the Extensibility of the
Cell Wall
How does auxin cause a five- to tenfold increase in the
growth rate in only 10 minutes? To understand the mech-
anism, we must first review the process of cell enlargement
in plants (see Chapter 15). Plant cells expand in three steps:
1. Osmotic uptake of water across the plasma membrane
is driven by the gradient in water potential (
∆Y
w
).
2. Turgor pressure builds up because of the rigidity of
the cell wall.
3. Biochemical wall loosening occurs, allowing the cell
to expand in response to turgor pressure.
The effects of these parameters on the growth rate are
encapsulated in the growth rate equation:
GR = m (Y
p
– Y)
where GR is the growth rate, Y
p
is the turgor pressure, Y is
the yield threshold, and
m is the coefficient (wall extensibil-
ity
) that relates the growth rate to the difference between
Y
p
and Y.
In principle, auxin could increase the growth rate by
increasing
m, increasing Y
p
, or decreasing Y. Although
extensive experiments have shown that auxin does not
increase turgor pressure when it stimulates growth, con-
flicting results have been obtained regarding auxin-
induced decreases in
Y. However, there is general agree-
ment that auxin causes an increase in the wall extensibility
parameter,
m.
Auxin-Induced Proton Extrusion Acidifies the Cell
Wall and Increases Cell Extension
According to the widely accepted acid growth hypothesis,
hydrogen ions act as the intermediate between auxin and
cell wall loosening. The source of the hydrogen ions is the
plasma membrane H
+
-ATPase, whose activity is thought
to increase in response to auxin. The acid growth hypoth-
esis allows five main predictions:
1. Acid buffers alone should promote short-term
growth, provided the cuticle has been abraded to
allow the protons access to the cell wall.
2. Auxin should increase the rate of proton extrusion
(wall acidification), and the kinetics of proton extru-
sion should closely match those of auxin-induced
growth.
3. Neutral buffers should inhibit auxin-induced growth.
4. Compounds (other than auxin) that promote proton
extrusion should stimulate growth.
5. Cell walls should contain a “wall loosening factor”
with an acidic pH optimum.
All five of these predictions have been confirmed. Acidic
buffers cause a rapid and immediate increase in the growth
rate, provided the cuticle has been abraded. Auxin stimu-
lates proton extrusion into the cell wall after 10 to 15 min-
utes of lag time, consistent with the growth kinetics (Fig-
ure 19.23).
Auxin-induced growth has also been shown to be inhib-
ited by neutral buffers, as long as the cuticle has been
abraided.
Fusicoccin, a fungal phytotoxin, stimulates both
rapid proton extrusion and transient growth in stem and
coleoptile sections (
see Web Topic 19.6). And finally, wall-
loosening proteins called
expansins have been identified
in the cell walls of a wide range of plant species (see Chap-
ter 15). At acidic pH values, expansins loosen cell walls by
weakening the hydrogen bonds between the polysaccha-
ride components of the wall.
3
5
201
Incubation time in 10µM IAA (hours)
Elongation rate (% h
–1
)
IAA
Soybean
Oat
FIGURE 19.22 Comparison of the growth kinetics of oat
coleoptile and soybean hypocotyl sections, incubated with
10
µM IAA and 2% sucrose. Growth is plotted as the rate at
each time point, rather than the rate of the absolute length.
The growth rate of the soybean hypocotyl oscillates after
1 hour, whereas that of the oat coleoptile is constant.
(After Cleland 1995.)
440 Chapter 19
Auxin-Induced Proton Extrusion May Involve Both
Activation and Synthesis
In theory, auxin could increase the rate of proton extrusion
by two possible mechanisms:
1. Activation of preexisting plasma membrane H
+
-
ATPases
2. Synthesis of new H
+
-ATPases on
the plasma membrane
H
+
-ATPase activation. When auxin
was added directly to isolated plasma
membrane vesicles from tobacco cells,
a small stimulation (about 20%) of the
ATP-driven proton-pumping activity
was observed, suggesting that auxin
directly activates the H
+
-ATPase. A
greater stimulation (about 40%) was
observed if the living cells were treated
with IAA just before the membranes
were isolated, suggesting that a cellu-
lar factor is also required (Peltier and
Rossignol 1996).
Although an auxin receptor has not
yet been unequivocally identified (as
discussed later in the chapter), various
auxin-binding proteins (ABPs) have
been isolated and appear to be able to activate the plasma
membrane H
+
-ATPase in the presence of auxin (Steffens et
al. 2001).
Recently an ABP from rice, ABP
57
, was shown to bind
directly to plasma membrane H
+
-ATPases and stimulate
proton extrusion—but only in the presence of IAA (Kim et
al. 2001). When IAA is absent, the activity of the H
+
-
ATPase is repressed by the C-terminal domain of the
enzyme, which can block the catalytic site. ABP
57
(with
bound IAA) interacts with the H
+
-ATPase, activating the
enzyme. A second auxin-binding site interferes with the
action of the first, possibly explaining the bell-shaped
curve of auxin action. This hypothetical model for the
action of ABP
57
is shown in Figure 19.24.
H
+
-ATPase synthesis. The ability of protein synthesis
inhibitors, such as cycloheximide, to rapidly inhibit auxin-
induced proton extrusion and growth suggests that auxin
might also stimulate proton pumping by increasing the
synthesis of the H
+
-ATPase. An increase in the amount of
plasma membrane ATPase in corn coleoptiles was detected
immunologically after only 5 minutes of auxin treatment,
and a doubling of the H
+
-ATPase was observed after 40
minutes of treatment. A threefold stimulation by auxin of
an mRNA for the H
+
-ATPase was demonstrated specifi-
cally in the nonvascular tissues of the coleoptiles.
In summary, the question of activation versus synthe-
sis is still unresolved, and it is possible that auxin stimu-
lates proton extrusion by both activation and stimulation
of synthesis of the H
+
-ATPase. Figure 19.25 summarizes
–100 102030405060
4.5
40
80
120
160
200
240
5.0
5.5
6.0
Time (minutes)
pH
Elongation (microns)
IAA
LengthpH
FIGURE 19.23 Kinetics of auxin-induced elongation and cell
wall acidification in maize coleoptiles. The pH of the cell
wall was measured with a pH microelectrode. Note the
similar lag times (10 to 15 minutes) for both cell wall acidi-
fication and the increase in the rate of elongation. (From
Jacobs and Ray 1976.)
Docking
site
Inhibitory
domain
Catalytic
site
OUTSIDE
INSIDE
PM H
+
-ATPase
ABP
57
IAA
H
+
H
+
ABP
57
binds PM
H
+
-ATPase at
docking site.
IAA binding
causes
conformational
change in
ABP
57
. ABP
57
then interacts
with inhibitory
domain of PM
H
+
-ATPase
activating the
enzyme.
Binding of IAA
to second site
decreases
interaction
with H
+
-ATPase
inhibitory
domain; the
enzyme is
inhibited.
+
ADP
P
i
ATP
FIGURE 19.24 Model for the activation of the plasma membrane (PM)
H
+
-ATPase by ABP
57
and auxin.
Auxin: The Growth Hormone 441
the proposed mechanisms of auxin-induced cell wall loos-
ening via proton extrusion.
PHYSIOLOGICAL EFFECTS OF AUXIN:
PHOTOTROPISM AND GRAVITROPISM
Three main guidance systems control the orientation of
plant growth:
1. Phototropism, or growth with respect to light, is
expressed in all shoots and some roots; it ensures that
leaves will receive optimal sunlight for photosynthe-
sis.
2.
Gravitropism, growth in response to gravity, enables
roots to grow downward into the soil and shoots to
grow upward away from the soil, which is especially
critical during the early stages of germination.
3.
Thigmotropism, or growth with respect to touch,
enables roots to grow around rocks and is responsi-
ble for the ability of the shoots of climbing plants to
wrap around other structures for support.
In this section we will examine the evidence that bend-
ing in response to light or gravity results from the lateral
redistribution of auxin. We will also consider the cellular
mechanisms involved in generating lateral auxin gradients
during bending growth. Less is known about the mecha-
nism of thigmotropism, although it, too, probably involves
auxin gradients.
Phototropism Is Mediated by the Lateral
Redistribution of Auxin
As we saw earlier, Charles and Francis Darwin provided
the first clue concerning the mechanism of phototropism
by demonstrating that the sites of perception and differen-
tial growth (bending) are separate: Light is perceived at the
tip, but bending occurs below the tip. The Darwins pro-
posed that some “influence” that was transported from the
tip to the growing region brought about the observed
asymmetric growth response. This influence was later
shown to be indole-3-acetic acid—auxin.
When a shoot is growing vertically, auxin is transported
polarly from the growing tip to the elongation zone. The
ATP
H
+
ATP
H
+
ATP
H
+
ATP
ATP
H
+
H
+
H
+
H
+
ATP
H
+
ATP
H
+
Protein
processing
Rough ER
Golgi body
ATP
ATP
Expansin
Plasma
membrane
CELL WALL
NUCLEUS
Promoter
H
+
-ATPase
gene
Activation
Activation hypothesis:
Auxin binds to an auxin-
binding protein (ABP1)
located either on the cell
surface or in the cytosol.
ABP1-IAA then interacts
directly with plasma
membrane H
+
-ATPase to
stimulate proton pumping
(step 1). Second
messengers, such as
calcium or intracellular pH,
could also be involved.
ABP1
IAA
ABP1
IAA
IAA
Synthesis hypothesis:
IAA-induced second
messengers activate the
expression of genes (step
2) that encode the plasma
membrane H
+
-ATPase
(step 3). The protein is
synthesized on the rough
endoplasmic reticulum
(step 4) and targeted via
the secretory pathway to
the plasma membrane
(steps 5 and 6). The
increase in proton
extrusion results from an
increase in the number of
proton pumps on the
membrane.
Second
messengers
1
3
2
4
5
6
mRNA
H
+
-ATPase
in vesicle membrane
Activation
hypothesis
Synthesis
hypothesis
FIGURE 19.25 Current models for IAA-induced H
+
extrusion. In many plants, both
of these mechanisms may operate. Regardless of how H
+
pumping is increased,
acid-induced wall loosening is thought to be mediated by expansins.
442 Chapter 19
polarity of auxin transport from tip to base is developmen-
tally determined and is independent of orientation with
respect to gravity. However, auxin can also be transported
laterally, and this lateral movement of auxin lies at the heart
of a model for tropisms originally proposed separately by
the Russian plant physiologist, Nicolai Cholodny and Frits
Went from the Netherlands in the 1920s.
According to the Cholodny–Went model of phototro-
pism, the tips of grass coleoptiles have three specialized
functions:
1. The production of auxin
2. The perception of a unilateral light stimulus
3. The lateral transport of IAA in response to the pho-
totropic stimulus
Thus, in response to a directional light stimulus, the auxin
produced at the tip, instead of being transported
basipetally, is transported laterally toward the shaded side.
The precise sites of auxin production, light perception,
and lateral transport have been difficult to define. In maize
coleoptiles, auxin is produced in the upper 1 to 2 mm of
the tip. The zones of photosensing and lateral transport
extend farther, within the upper 5 mm of the tip. The
response is also strongly dependent on the light fluence
(
see Web Topic 19.7).
Two flavoproteins,
phototropins 1 and 2, are the pho-
toreceptors for the blue-light signaling pathway (
see Web
Essay 19.3) that induces phototropic bending in Arabidop-
sis
hypocotyls and oat coleoptiles under both high- and
low-fluence conditions (Briggs et al. 2001).
Phototropins are autophosphorylating protein kinases
whose activity is stimulated by blue light. The action spec-
trum for
blue-light activation of the kinase activity closely
matches the action spectrum for phototropism, including
the multiple peaks in the blue region. Phototropin 1 dis-
plays a lateral gradient in phosphorylation during expo-
sure to low-fluence unilateral blue light.
According to the current hypothesis, the gradient in
phototropin phosphorylation induces the movement of
auxin to the shaded side of the coleoptile (
see Web Topic
19.7). Once the auxin reaches the shaded side of the tip, it
is transported basipetally to the elongation zone, where it
stimulates cell elongation. The acceleration of growth on
the shaded side and the slowing of growth on the illumi-
nated side (differential growth) give rise to the curvature
toward light (Figure 19.26).
Direct tests of the Cholodny–Went model using the agar
block/coleoptile curvature bioassay have supported the
model’s prediction that auxin in coleoptile tips is trans-
ported laterally in response to unilateral light (Figure
19.27). The total amount of auxin diffusing out of the tip
(here expressed as the angle of curvature) is the same in the
presence of unilateral light as in darkness (compare Figure
19.27A and B). This result indicates that light does not
cause the photodestruction of auxin on the illuminated
side, as had been proposed by some investigators.
Consistent with both the Cholodny–Went hypothesis
and the acid growth hypothesis, the apoplastic pH on the
shaded side of a phototropically bending stem or coleop-
tile is more acidic than the side facing the light (Mulkey et
al. 1981).
Gravitropism Also Involves Lateral Redistribution
of Auxin
When dark-grown Avena seedlings are oriented horizon-
tally, the coleoptiles bend upward in response to gravity.
According to the Cholodny–Went model, auxin in a hori-
zontally oriented coleoptile tip is transported laterally to
the lower side, causing the lower side of the coleoptile to
grow faster than the upper side. Early experimental evi-
dence indicated that the tip of the coleoptile can perceive
gravity and redistribute auxin to the lower side. For exam-
ple, if coleoptile tips are oriented horizontally, a greater
amount of auxin diffuses from the lower half than the
upper half (Figure 19.28).
Tissues below the tip are able to respond to gravity as
well. For example, when vertically oriented maize coleop-
tiles are decapitated by removal of the upper 2 mm of the
tip and oriented horizontally, gravitropic bending occurs
at a slow rate for several hours even without the tip. Appli-
cation of IAA to the cut surface restores the rate of bending
80
0.6
0
4020
Time (min)
Growth in length (mm)
100 12060
0.9
1.2
1.5
1.8
Shaded side
Control
(no light)
Irradiated side
0.3
FIGURE 19.26 Time course of growth on the illuminated
and shaded sides of a coleoptile responding to a 30-second
pulse of unidirectional blue light. Control coleoptiles were
not given a light treatment. (After Iino and Briggs 1984.)
Auxin: The Growth Hormone 443
to normal levels. This finding indicates that both the per-
ception of the gravitational stimulus and the lateral redis-
tribution of auxin can occur in the tissues below the tip,
although the tip is still required for auxin production.
Lateral redistribution of auxin in shoot apical meristems
is more difficult to demonstrate than in coleoptiles because
of the presence of leaves. In recent years, molecular mark-
ers have been widely used as reporter genes to detect lat-
eral auxin gradients in horizontally placed stems and roots.
In soybean hypocotyls, gravitropism leads to a rapid
asymmetry in the accumulation of a group of auxin-stim-
ulated mRNAs called
SAURs (small auxin up-regulated
RNAs) (McClure and Guilfoyle 1989). In vertical seedlings,
SAUR gene expression is symmetrically distributed. Within
20 minutes after the seedling is oriented horizontally,
SAURs begin to accumulate on the lower half of the
hypocotyl. Under these conditions, gravitropic bending
first becomes evident after 45 minutes, well after the induc-
tion of the SAURs (see
Web Topic 19.8). The existence of
a lateral gradient in SAUR gene expression is indirect evi-
dence for the existence of a lateral gradient in auxin
detectable within 20 minutes of the gravitropic stimulus.
As will be discussed later in the chapter, the
GH3 gene
family is also up-regulated within 5 minutes of auxin treat-
Coleoptile tip
completely divided
by thin piece of mica;
no redistribution
of auxin observed.
Coleoptile tip partly
divided by thin piece
of mica; lateral
redistribution of
auxin occurs.
(A) Dark
Corn coleoptile tip
excised and placed
on agar
Agar block
Curvature angle
(degrees)
(B) Unilateral light
No destruction of auxin
Undivided agar block Divided agar block
Unilateral light does not cause the
photodestruction of auxin on the
illuminated side.
Auxin is transported laterally to the
shaded side in the tip.
(D)
(C)
11.5 11.2
8.1 15.4
25.8
25.6
FIGURE 19.27 Evidence that the lateral redistribution of auxin is stimulated by uni-
directional light in corn coleoptiles.
(A) (B) Lower half Upper half
FIGURE 19.28 Auxin is transported to the lower side of a horizontally oriented oat
coleoptile tip. (A) Auxin from the upper and lower halves of a horizontal tip is
allowed to diffuse into two agar blocks. (B) The agar block from the lower half (left)
induces greater curvature in a decapitated coleoptile than the agar block from the
upper half (right). (Photo © M. B. Wilkins.)
444 Chapter 19
ment and has been used as a molecular marker for the pres-
ence of auxin. By fusing an artificial promoter sequence based
on the
GH3 promoter to the GUS reporter gene, it is possible
to visualize the lateral gradient in auxin concentration that
occurs during both photo- and gravitropism (Figure 19.29).
Statoliths Serve as Gravity Sensors in Shoots and
Roots
Unlike unilateral light, gravity does not form a gradient
between the upper and lower sides of an organ. All parts
of the plant experience the gravitational stimulus equally.
How do plant cells detect gravity? The only way that grav-
ity can be sensed is through the motion of a falling or sed-
imenting body.
Obvious candidates for intracellular gravity sensors in
plants are the large, dense amyloplasts that are present in
many plant cells. These specialized amyloplasts are of suf-
ficiently high density relative to the cytosol that they read-
ily sediment to the bottom of the cell (Figure 19.30). Amy-
loplasts that function as gravity sensors are called
statoliths, and the specialized gravity-sensing cells in
which they occur are called
statocytes. Whether the stato-
cyte is able to detect the downward motion of the statolith
as it passes through the cytoskeleton or whether the stim-
ulus is perceived only when the statolith comes to rest at
the bottom of the cell has not yet been resolved.
Shoots and Coleoptiles. In shoots and coleoptiles, gravity
is perceived in the
starch sheath, a layer of cells that sur-
rounds the vascular tissues of the shoot. The starch sheath
is continuous with the endodermis of the root, but unlike
the endodermis it contains amyloplasts.
Arabidopsis
mutants lacking amyloplasts in the starch sheath display
agravitropic shoot growth but normal gravitropic root
growth (Fujihira et al. 2000).
As noted in Chapter 16, the
scarecrow (scr) mutant of
Arabidopsis is missing both the endodermis and the starch
sheath. As a result, the hypocotyl and inflorescence of the
scr mutant are agravitropic, while the root exhibits a nor-
mal gravitropic response. On the basis of the phenotypes
of these two mutants, we can conclude the following:
• The starch sheath is required for gravitropism in
shoots.
• The root endodermis, which does not contain sta-
toliths, is not required for gravitropism in roots.
Roots. The site of gravity perception in primary roots is the
root cap. Large, graviresponsive amyloplasts are located in
the statocytes (see Figure 19.30A and B) in the central cylin-
der, or
columella, of the root cap. Removal of the root cap
from otherwise intact roots abolishes root gravitropism
without inhibiting growth.
Precisely how the statocytes sense their falling statoliths
is still poorly understood. According to one hypothesis,
contact or pressure resulting from the amyloplast resting
on the endoplasmic reticulum on the lower side of the cell
triggers the response (see Figure 19.30C). The endoplasmic
reticulum of columella cells is structurally unique, consist-
ing of five to seven rough-ER sheets attached to a central
nodal rod in a whorl, like petals on a flower. This special-
ized “nodal ER” differs from the more tubular cortical ER
cisternae and may be involved in the gravity response
(Zheng and Staehelin 2001).
The
starch–statolith hypothesis of gravity perception in
roots is supported by several lines of evidence. Amylo-
plasts are the only organelles that consistently sediment in
the columella cells of different plant species, and the rate
of sedimentation correlates closely with the time required
to perceive the gravitational stimulus. The gravitropic
responses of starch-deficient mutants are generally much
slower than those of wild-type plants. Nevertheless, starch-
less mutants exhibit some gravitropism, suggesting that
although starch is required for a normal gravitropic
response, starch-independent gravity perception mecha-
nisms may also exist.
Other organelles, such as nuclei, may be dense enough
to act as statoliths. It may not even be necessary for a sta-
tolith to come to rest at the bottom of the cell. The
cytoskeletal network may be able to detect a partial verti-
cal displacement of an organelle.
FIGURE 19.29 Lateral auxin gradients are formed in
Arabidopsis hypocotyls during the differential growth
responses to light (A) and gravity (B). The plants were
transformed with the
DR5::GUS reporter gene. Auxin accu-
mulation on the shaded (A) or lower (B) side of the
hypocotyls is indicated by the blue staining shown in the
insets. (Photos courtesy of Klaus Palme.)
Auxin: The Growth Hormone 445
Recently Andrew Staehelin and colleagues proposed a
new model for gravitropism, called the
tensegrity model
(Yoder et al. 2001). Tensegrity is an architectural term—a
contraction of
tensional integrity—coined by the innovative
architect R. Buckminster Fuller. In essence,
tensegrity refers
to structural integrity created by interactive tension
between the structural components. In this case the struc-
tural components consist of the meshwork of actin micro-
filaments that form part of the cytoskeleton of the central
columella cells of the root cap. The actin network is
assumed to be anchored to stretch-activated receptors on
the plasma membrane. Stretch receptors in animal cells are
typically mechanosensitive ion channels, and stretch-acti-
vated calcium channels have been demonstrated in plants.
According to the tensegrity model, sedimentation of the
statoliths through the cytosol locally disrupts the actin
meshwork, changing the distribution of tension transmit-
ted to calcium channels on the plasma membrane, thus
altering their activities. Yoder and colleagues (2001) have
further proposed that the nodal ER, which is also con-
nected to channels via actin microfilaments, may protect
the cytoskeleton from being disrupted by the statoliths in
specific regions, thus providing a signal for the direction-
ality of the stimulus.
Gravity perception without statoliths? An alternative
mechanism of gravity perception that does not involve sta-
toliths has been proposed for the giant-celled freshwater
alga
Chara. See Web Topic 19.8 for details.
Auxin Is Redistribution Laterally in the Root Cap
In addition to functioning to protect the sensitive cells of
the apical meristem as the tip penetrates the soil, the root
cap is the site of gravity perception. Because the cap is
some distance away from the elongation zone where bend-
ing occurs, a chemical messenger is presumed to be
involved in communication between the cap and the elon-
gation zone. Microsurgery experiments in which half of the
M
M
M
CC
PP
Root tip
Amyloplast
Root tip
Vertical orientation
Horizontal orientation
Uniform
pressure
on ER
Unequal
pressure
on ER
(C)
Amyloplasts tend to
sediment in response to
reorientation of the cell
and to remain resting
against the ER. When
the root is oriented
vertically, the pressure
exerted by the amylo-
plasts on the ER is
equally distributed.
In a horizontal orient-
ation the pressure on
the ER is unequal on
either side of the
vertical axis of the root.
FIGURE 19.30 The perception of gravity by statocytes of Arabidopsis. (A) Electron
micrograph of root tip, showing apical meristem (M), columella (C), and periph-
eral (P) cells. (B) Enlarged view of a columella cell, showing the amyloplasts
resting on top of endoplasmic reticulum at the bottom of the cell. (C) Diagram of
the changes that occur during reorientation from the vertical to the horizontal
position. (A, B courtesy of Dr. John Kiss; C based on Sievers et al. 1996 and
Volkmann and Sievers 1979.)
(A)
(B)
Statolith
Statolith
Endoplasmic reticulum
cap was removed showed that the cap produces a root
growth inhibitor (Figure 19.31). This finding suggests that
the cap supplies an inhibitor to the lower side of the root
during gravitropic bending.
Although root caps contain small amounts of IAA and
abscisic acid (ABA) (see Chapter 23), IAA is more
inhibitory to root growth than ABA when applied directly
to the elongation zone, suggesting that IAA is the root cap
inhibitor. Consistent with this conclusion, ABA-deficient
Arabidopsis mutants have normal root gravitropism,
whereas the roots of mutants defective in auxin transport,
such as
aux1 and agr1, are agravitropic (Palme and Gäl-
weiler 1999). The
agr mutant lacks an auxin efflux carrier
related to the PIN proteins (Chen et al. 1998; Müller et al.
1998; Utsuno et al. 1998). The AGR1 protein is localized at
the basal (distal) end of cortical cells near the root tip in
Arabidopsis.
How do we reconcile the fact that the shoot apical
meristem is the primary source of auxin to the root with the
role of the root cap as the source of the inhibitory auxin
during gravitropism? As discussed earlier
in the chapter, auxin from the shoot is
translocated from the stele to the root tip
via protophloem cells. Asymmetrically
localized AUX1 permeases on the pro-
tophloem parenchyma cells direct the
acropetal transport of auxin from the
phloem to a cluster of cells in the col-
umella of the cap. Auxin is then trans-
ported radially to the lateral root cap cells,
where AUX1 is also strongly expressed
(see Figure 19.19).
The lateral root cap cells overlay the
distal elongation zone (DEZ) of the root—
the first region that responds to gravity.
The auxin from the cap is taken up by the
cortical parenchyma of the DEZ and trans-
ported basipetally through the elongation
zone of the root. This basipetal transport,
which is limited to the elongation zone, is
facilitated by auxin anion carriers related
to the PIN family (called AGR1), which are
localized at the basal ends of the cortical
parenchyma cells.
The basipetally transported auxin
accumulates in the elongation zone and
does not pass beyond this region.
Flavonoids capable of inhibiting auxin
efflux are synthesized in this region of the root and prob-
ably promote auxin retention by these cells (Figure 19.32)
(Murphy et al. 2000).
Vertically oriented
control root with cap
Horizontally oriented
control root with cap
shows normal
gravitropic bending.
Root
Root cap
Removal of the cap
from the vertical root
slightly stimulates
elongation growth.
Removal of half of the
cap causes a vertical root
to bend toward the side
with the remaining half-cap.
Removal of the cap from a
horizontal root abolishes
the response to gravity,
while slightly stimulating
elongation growth.
(A)
(B)
FIGURE 19.31 Microsurgery experiments demonstrating that the root cap
produces an inhibitor that regulates root gravitropism. (After Shaw and
Wilkins 1973.)
Cotyledon and
apical region
Hypocotyl–root
transition zone
Root tip
FIGURE 19.32 Flavonoid localization in a 6-day-old Arabidopsis
seedling. The staining procedure used causes the flavonoids to flu-
oresce. Flavonoids are concentrated in three regions
: the cotyledon
and apical region, the hypocotyl–root transition zone, and the root
tip area (inset). In the root tip, flavonoids are localized specifically
in the elongation zone and the cap, the tissues involved in basipetal
auxin transport. (From Murphy et al. 2000.)
Auxin: The Growth Hormone 447