Tài liệu Plant physiology - Chapter 4 Water Balance of Plants docx
Bạn đang xem bản rút gọn của tài liệu. Xem và tải ngay bản đầy đủ của tài liệu tại đây (1.22 MB, 20 trang )
Water Balance of Plants
4
Chapter
LIFE IN EARTH’S ATMOSPHERE presents a formidable challenge to
land plants. On the one hand, the atmosphere is the source of carbon
dioxide, which is needed for photosynthesis. Plants therefore need ready
access to the atmosphere. On the other hand, the atmosphere is relatively
dry and can dehydrate the plant. To meet the contradictory demands of
maximizing carbon dioxide uptake while limiting water loss, plants have
evolved adaptations to control water loss from leaves, and to replace the
water lost to the atmosphere.
In this chapter we will examine the mechanisms and driving forces
operating on water transport within the plant and between the plant and
its environment. Transpirational water loss from the leaf is driven by a
gradient in water vapor concentration. Long-distance transport in the
xylem is driven by pressure gradients, as is water movement in the soil.
Water transport through cell layers such as the root cortex is complex,
but it responds to water potential gradients across the tissue.
Throughout this journey water transport is passive in the sense that
the free energy of water decreases as it moves. Despite its passive nature,
water transport is finely regulated by the plant to minimize dehydra-
tion, largely by regulating transpiration to the atmosphere. We will begin
our examination of water transport by focusing on water in the soil.
WATER IN THE SOIL
The water content and the rate of water movement in soils depend to
a large extent on soil type and soil structure. Table 4.1 shows that the
physical characteristics of different soils can vary greatly. At one extreme
is sand, in which the soil particles may be 1 mm or more in diameter.
Sandy soils have a relatively low surface area per gram of soil and have
large spaces or channels between particles.
At the other extreme is clay, in which particles are smaller than 2 µm
in diameter. Clay soils have much greater surface areas and smaller
channels between particles. With the aid of organic sub-
stances such as humus (decomposing organic matter), clay
particles may aggregate into “crumbs” that help improve
soil aeration and infiltration of water.
When a soil is heavily watered by rain or by irrigation,
the water percolates downward by gravity through the
spaces between soil particles, partly displacing, and in
some cases trapping, air in these channels. Water in the soil
may exist as a film adhering to the surface of soil particles,
or it may fill the entire channel between particles.
In sandy soils, the spaces between particles are so large
that water tends to drain from them and remain only on
the particle surfaces and at interstices between particles. In
clay soils, the channels are small enough that water does
not freely drain from them; it is held more tightly (see
Web
Topic 4.1). The moisture-holding capacity of soils is called
the field capacity. Field capacity is the water content of a
soil after it has been saturated with water and excess water
has been allowed to drain away. Clay soils or soils with a
high humus content have a large field capacity. A few days
after being saturated, they might retain 40% water by vol-
ume. In contrast, sandy soils typically retain 3% water by
volume after saturation.
In the following sections we will examine how the neg-
ative pressure in soil water alters soil water potential, how
water moves in the soil, and how roots absorb the water
needed by the plant.
A Negative Hydrostatic Pressure in Soil Water
Lowers Soil Water Potential
Like the water potential of plant cells, the water potential
of soils may be dissected into two components, the osmotic
potential and the hydrostatic pressure. The osmotic poten-
tial (Y
s
; see Chapter 3) of soil water is generally negligible
because solute concentrations are low; a typical value
might be –0.02 MPa. For soils that contain a substantial
concentration of salts, however, Y
s
is significant, perhaps
–0.2 MPa or lower.
The second component of soil water potential is hydro-
static pressure (Y
p
) (Figure 4.1). For wet soils, Y
p
is very
close to zero. As a soil dries out, Y
p
decreases and can
become quite negative. Where does the negative pressure
in soil water come from?
Recall from our discussion of capillarity in Chapter 3
that water has a high surface tension that tends to mini-
mize air–water interfaces. As a soil dries out, water is first
removed from the center of the largest spaces between par-
ticles. Because of adhesive forces, water tends to cling to
the surfaces of soil particles, so a large surface area between
soil water and soil air develops (Figure 4.2).
As the water content of the soil decreases, the water
recedes into the interstices between soil particles, and the
air–water surface develops curved air–water interfaces.
48 Chapter 4
Soil line
Leaf air spaces
(Dc
wv
)
Xylem
(DY
p
)
Soil
(DY
p
)
Across root
(DY
w
)
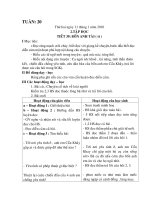
FIGURE 4.1 Main driving forces for water flow from the
soil through the plant to the atmosphere: differences in
water vapor concentration (∆c
wv
), hydrostatic pressure
(∆Y
p
), and water potential (∆Y
w
).
TABLE 4.1
Physical characteristics of different soils
Particle Surface area
Soil diameter (µm) per gram (m
2
)
Coarse sand 2000–200
Fine sand 200–20
<1–10
Silt 20–2 10–100
Clay <2 100–1000
Water under these curved surfaces develops a negative
pressure that may be estimated by the following formula:
(4.1)
where T is the surface tension of water (7.28 × 10
–8
MPa m)
and r is the radius of curvature of the air–water interface.
The value of Y
p
in soil water can become quite negative
because the radius of curvature of air–water surfaces may
become very small in drying soils. For instance, a curvature
r = 1 µm (about the size of the largest clay particles) corre-
sponds to a Y
p
value of –0.15 MPa. The value of Y
p
may
easily reach –1 to –2 MPa as the air–water interface recedes
into the smaller cracks between clay particles.
Soil scientists often describe soil water potential in terms
of a matric potential (Jensen et al. 1998). For a discussion of
the relation between matric potential and water potential
see
Web Topic 3.3.
Water Moves through the Soil by Bulk Flow
Water moves through soils predominantly by bulk flow
driven by a pressure gradient. In addition, diffusion of
water vapor accounts for some water movement. As plants
absorb water from the soil, they deplete the soil of water
near the surface of the roots. This depletion reduces Y
p
in
the water near the root surface and establishes a pressure
gradient with respect to neighboring regions of soil that
have higher Y
p
values. Because the water-filled pore spaces in
the soil are interconnected, water moves to the root surface by
bulk flow through these channels down the pressure gradient.
The rate of water flow in soils depends on two factors:
the size of the pressure gradient through the soil, and the
hydraulic conductivity of the soil. Soil hydraulic conduc-
tivity is a measure of the ease with which water moves
through the soil, and it varies with the type of soil and
water content. Sandy soils, with their large spaces between
particles, have a large hydraulic conductivity, whereas clay
soils, with the minute spaces between their particles, have
an appreciably smaller hydraulic conductivity.
As the water content (and hence the water potential) of
a soil decreases, the hydraulic conductivity decreases dras-
tically (see
Web Topic 4.2). This decrease in soil hydraulic
conductivity is due primarily to the replacement of water
in the soil spaces by air. When air moves into a soil chan-
nel previously filled with water, water movement through
that channel is restricted to the periphery of the channel.
As more of the soil spaces become filled with air, water can
flow through fewer and narrower channels, and the
hydraulic conductivity falls.
In very dry soils, the water potential (Y
w
) may fall
below what is called the permanent wilting point. At this
point the water potential of the soil is so low that plants
cannot regain turgor pressure even if all water loss through
transpiration ceases. This means that the water potential of
the soil (Y
w
) is less than or equal to the osmotic potential
(Y
s
) of the plant. Because cell Y
s
varies with plant species,
the permanent wilting point is clearly not a unique prop-
erty of the soil; it depends on the plant species as well.
WATER ABSORPTION BY ROOTS
Intimate contact between the surface of the root and the soil
is essential for effective water absorption by the root. This
contact provides the surface area needed for water uptake
and is maximized by the growth of the root and of root
hairs into the soil. Root hairs are microscopic extensions of
root epidermal cells that greatly increase the surface area
of the root, thus providing greater capacity for absorption
of ions and water from the soil. When 4-month-old rye
(Secale) plants were examined, their root hairs were found
to constitute more than 60% of the surface area of the roots
(see Figure 5.6).
Water enters the root most readily in the apical part of the
root that includes the root hair zone. More mature regions of
the root often have an outer layer of protective tissue, called
an exodermis or hypodermis, that contains hydrophobic mate-
rials in its walls and is relatively impermeable to water.
The intimate contact between the soil and the root sur-
face is easily ruptured when the soil is disturbed. It is for
this reason that newly transplanted seedlings and plants
Y
p
=
−2T
r
Water Balance of Plants 49
AirRoot
hair
Root Water Sand
particle
Clay
particle
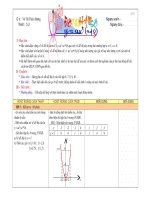
FIGURE 4.2 Root hairs make intimate contact with soil particles and
greatly amplify the surface area that can be used for water absorption by
the plant. The soil is a mixture of particles (sand, clay, silt, and organic
material), water, dissolved solutes, and air. Water is adsorbed to the sur-
face of the soil particles. As water is absorbed by the plant, the soil solu-
tion recedes into smaller pockets, channels, and crevices between the soil
particles. At the air–water interfaces, this recession causes the surface of
the soil solution to develop concave menisci (curved interfaces between
air and water marked in the figure by arrows), and brings the solution
into tension (negative pressure) by surface tension. As more water is
removed from the soil, more acute menisci are formed, resulting in
greater tensions (more negative pressures).
need to be protected from water loss for the first few days
after transplantation. Thereafter, new root growth into the
soil reestablishes soil–root contact, and the plant can better
withstand water stress.
Let’s consider how water moves within the root, and the
factors that determine the rate of water uptake into the root.
Water Moves in the Root via the Apoplast,
Transmembrane,and Symplast Pathways
In the soil, water is transported predominantly by bulk flow.
However, when water comes in contact with the root sur-
face, the nature of water transport becomes more complex.
From the epidermis to the endodermis of the root, there are
three pathways through which water can flow (Figure 4.3):
the apoplast, transmembrane, and symplast pathways.
1. In the apoplast pathway, water moves exclusively
through the cell wall without crossing any mem-
branes. The apoplast is the continuous system of cell
walls and intercellular air spaces in plant tissues.
2. The transmembrane pathway is the route followed
by water that sequentially enters a cell on one side,
exits the cell on the other side, enters the next in the
series, and so on. In this pathway, water crosses at
least two membranes for each cell in its path (the
plasma membrane on entering and on exiting).
Transport across the tonoplast may also be involved.
3. In the symplast pathway, water travels from one cell
to the next via the plasmodesmata (see Chapter 1).
The symplast consists of the entire network of cell
cytoplasm interconnected by plasmodesmata.
Although the relative importance of the apoplast, trans-
membrane, and symplast pathways has not yet been clearly
established, experiments with the pressure probe technique
(see
Web Topic 3.6) indicate that the apoplast pathway is
particularly important for water uptake by young corn roots
(Frensch et al. 1996; Steudle and Frensch 1996).
At the endodermis, water movement through the
apoplast pathway is obstructed by the Casparian strip (see
Figure 4.3). The Casparian strip is a band of radial cell
Apoplast pathway
Symplastic and
transmembrane
pathways
Epidermis
Cortex
Endodermis
Casparian
strip
Pericycle Xylem Phloem
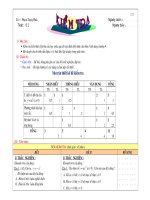
FIGURE 4.3 Pathways for water uptake by the root. Through the cortex, water may
travel via the apoplast pathway, the transmembrane pathway, and the symplast
pathway. In the symplast pathway, water flows between cells through the plasmod-
esmata without crossing the plasma membrane. In the transmembrane pathway,
water moves across the plasma membranes, with a short visit to the cell wall space.
At the endodermis, the apoplast pathway is blocked by the Casparian strip.
walls in the endodermis that is impregnated with the wax-
like, hydrophobic substance suberin. Suberin acts as a bar-
rier to water and solute movement. The endodermis
becomes suberized in the nongrowing part of the root, sev-
eral millimeters behind the root tip, at about the same time
that the first protoxylem elements mature (Esau 1953). The
Casparian strip breaks the continuity of the apoplast path-
way, and forces water and solutes to cross the endodermis
by passing through the plasma membrane. Thus, despite
the importance of the apoplast pathway in the root cortex
and the stele, water movement across the endodermis
occurs through the symplast.
Another way to understand water movement through
the root is to consider the root as a single pathway having
a single hydraulic conductance. Such an approach has led
to the development of the concept of root hydraulic con-
ductance (see
Web Topic 4.3 for details).
The apical region of the root is most permeable to water.
Beyond this point, the exodermis becomes suberized, lim-
iting water uptake (Figure 4.4). However, some water
absorption may take place through older roots, perhaps
through breaks in the cortex associated with the outgrowth
of secondary roots.
Water uptake decreases when roots are subjected to low
temperature or anaerobic conditions, or treated with respi-
ratory inhibitors (such as cyanide). These treatments inhibit
root respiration, and the roots transport less water. The exact
explanation for this effect is not yet clear. On the other hand,
the decrease in water transport in the roots provides an expla-
nation for the wilting of plants in waterlogged soils: Sub-
merged roots soon run out of oxygen, which is normally pro-
vided by diffusion through the air spaces in the soil (diffusion
through gas is 10
4
times faster than diffusion through water).
The anaerobic roots transport less water to the shoots, which
consequently suffer net water loss and begin to wilt.
Solute Accumulation in the Xylem
Can Generate “Root Pressure”
Plants sometimes exhibit a phenomenon referred to as root
pressure. For example, if the stem of a young seedling is
cut off just above the soil, the stump will often exude sap
from the cut xylem for many hours. If a manometer is
sealed over the stump, positive pressures can be measured.
These pressures can be as high as 0.05 to 0.5 MPa.
Roots generate positive hydrostatic pressure by absorb-
ing ions from the dilute soil solution and transporting them
into the xylem. The buildup of solutes in the xylem sap
leads to a decrease in the xylem osmotic potential (Y
s
) and
thus a decrease in the xylem water potential (Y
w
). This
lowering of the xylem Y
w
provides a driving force for
water absorption, which in turn leads to a positive hydro-
static pressure in the xylem. In effect, the whole root acts
like an osmotic cell; the multicellular root tissue behaves as
an osmotic membrane does, building up a positive hydro-
static pressure in the xylem in response to the accumula-
tion of solutes.
Root pressure is most likely to occur when soil water
potentials are high and transpiration rates are low. When
transpiration rates are high, water is taken up so rapidly
into the leaves and lost to the atmosphere that a positive
pressure never develops in the xylem.
Plants that develop root pressure frequently produce liq-
uid droplets on the edges of their leaves, a phenomenon
known as guttation (Figure 4.5). Positive xylem pressure
Water Balance of Plants 51
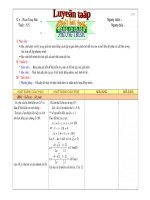
0.4
0
0.8
1.2
1.6
40 80 120 160 200 240 500
Distance from root tip (mm)
Rate of water uptake per segment
(10
–6
L h
–1
)
More suberizedLess suberized
Growing tip
Nongrowing
regions of root
FIGURE 4.4 Rate of water uptake at various positions along
a pumpkin root. (After Kramer and Boyer 1995.)
FIGURE 4.5 Guttation in leaves from strawberry (Fragaria
grandiflora). In the early morning, leaves secrete water
droplets through the hydathodes, located at the margins of
the leaves. Young flowers may also show guttation.
(Photograph courtesy of R. Aloni.)
causes exudation of xylem sap through
specialized pores called hydathodes that
are associated with vein endings at the
leaf margin. The “dewdrops” that can
be seen on the tips of grass leaves in
the morning are actually guttation
droplets exuded from such specialized
pores. Guttation is most noticeable
when transpiration is suppressed and
the relative humidity is high, such as
during the night.
WATER TRANSPORT
THROUGH THE XYLEM
In most plants, the xylem constitutes
the longest part of the pathway of
water transport. In a plant 1 m tall,
more than 99.5% of the water trans-
port pathway through the plant is
within the xylem, and in tall trees the
xylem represents an even greater frac-
tion of the pathway. Compared with
the complex pathway across the root
tissue, the xylem is a simple pathway
of low resistance. In the following sec-
tions we will examine how water
movement through the xylem is opti-
mally suited to carry water from the
roots to the leaves, and how negative
hydrostatic pressure generated by leaf
transpiration pulls water through the
xylem.
The Xylem Consists of Two Types
of Tracheary Elements
The conducting cells in the xylem
have a specialized anatomy that
enables them to transport large quan-
tities of water with great efficiency.
There are two important types of tra-
cheary elements in the xylem: tra-
cheids and vessel elements (Figure
4.6). Vessel elements are found only in
angiosperms, a small group of gym-
nosperms called the Gnetales, and
perhaps some ferns. Tracheids are pre-
sent in both angiosperms and gym-
nosperms, as well as in ferns and
other groups of vascular plants.
The maturation of both tracheids
and vessel elements involves the
“death” of the cell. Thus, functional
water-conducting cells have no mem-
branes and no organelles. What re-
52 Chapter 4
(A)
Perforation plate (compound)
Perforation plate
(simple)
Pits
Vessel elementsTracheids
Torus
Pit cavity
Pit membrane
Pit pair Secondary
cell walls
Primary
cell walls
(C)
(B)
mains are the thick, lignified cell walls, which form hollow
tubes through which water can flow with relatively little resis-
tance.
Tracheids are elongated, spindle-shaped cells (Figure
4.6A) that are arranged in overlapping vertical files. Water
flows between tracheids by means of the numerous pits in
their lateral walls (Figure 4.6B). Pits are microscopic regions
where the secondary wall is absent and the primary wall is
thin and porous (Figure 4.6C). Pits of one tracheid are typ-
ically located opposite pits of an adjoining tracheid, form-
ing pit pairs. Pit pairs constitute a low-resistance path for
water movement between tracheids. The porous layer
between pit pairs, consisting of two primary walls and a
middle lamella, is called the pit membrane.
Pit membranes in tracheids of some species of conifers
have a central thickening, called a torus (pl. tori) (see Fig-
ure 4.6C). The torus acts like a valve to close the pit by
lodging itself in the circular or oval wall thickenings bor-
dering these pits. Such lodging of the torus is an effective
way of preventing dangerous gas bubbles from invading
neighboring tracheids (we will discuss this formation of
bubbles, a process called cavitation, shortly).
Vessel elements tend to be shorter and wider than tra-
cheids and have perforated end walls that form a perfora-
tion plate at each end of the cell. Like tracheids, vessel ele-
ments have pits on their lateral walls (see Figure 4.6B).
Unlike tracheids, the perforated end walls allow vessel
members to be stacked end to end to form a larger conduit
called a vessel (again, see Figure 4.6B). Vessels vary in
length both within and between species. Maximum vessel
lengths range from 10 cm to many meters. Because of their
open end walls, vessels provide a very efficient low-resis-
tance pathway for water movement. The vessel members
found at the extreme ends of a vessel lack perforations at
the end walls and communicate with neighboring vessels
via pit pairs.
Water Movement through the Xylem
Requires Less Pressure Than Movement
through Living Cells
The xylem provides a low-resistance pathway for water
movement, thus reducing the pressure gradients needed to
transport water from the soil to the leaves. Some numeri-
cal values will help us appreciate the extraordinary effi-
ciency of the xylem. We will calculate the driving force
required to move water through the xylem at a typical
velocity and compare it with the driving force that would
be needed to move water through a cell-to-cell pathway.
For the purposes of this comparison, we will use a figure
of 4 mm s
–1
for the xylem transport velocity and 40 µm as
the vessel radius. This is a high velocity for such a narrow
vessel, so it will tend to exaggerate the pressure gradient
required to support water flow in the xylem. Using a ver-
sion of Poiseuille’s equation (see Equation 3.2), we can cal-
culate the pressure gradient needed to move water at a
velocity of 4 mm s
–1
through an ideal tube with a uniform
inner radius of 40 µm. The calculation gives a value of 0.02
MPa m
–1
. Elaboration of the assumptions, equations, and
calculations can be found in
Web Topic 4.4.
Of course, real xylem conduits have irregular inner wall
surfaces, and water flow through perforation plates and
pits adds additional resistance. Such deviations from an
ideal tube will increase the frictional drag above that cal-
culated from Poiseuille’s equation. However, measure-
ments show that the actual resistance is greater by approx-
imately a factor of 2 (Nobel 1999). Thus our estimate of 0.02
MPa m
–1
is in the correct range for pressure gradients
found in real trees.
Let’s now compare this value (0.02 MPa m
–1
) with the
driving force that would be necessary to move water at the
same velocity from cell to cell, crossing the plasma mem-
brane each time. Using Poiseuille’s equation, as described
in
Web Topic 4.4, the driving force needed to move water
through a layer of cells at 4 mm s
–1
is calculated to be 2 ×
10
8
MPa m
–1
. This is ten orders of magnitude greater than
the driving force needed to move water through our 40-
µm-radius xylem vessel. Our calculation clearly shows that
water flow through the xylem is vastly more efficient than
water flow across the membranes of living cells.
What Pressure Difference Is Needed to Lift Water
100 Meters to a Treetop?
With the foregoing example in mind, let’s see how large of
a pressure gradient is needed to move water up to the top
of a very tall tree. The tallest trees in the world are the coast
redwoods (Sequoia sempervirens) of North America and
Eucalyptus regnans of Australia. Individuals of both species
can exceed 100 m. If we think of the stem of a tree as a long
pipe, we can estimate the pressure difference that is needed
Water Balance of Plants 53
FIGURE 4.6 Tracheary elements and their interconnections.
(A) Structural comparison of tracheids and vessel elements,
two classes of tracheary elements involved in xylem water
transport. Tracheids are elongate, hollow, dead cells with
highly lignified walls. The walls contain numerous pits—
regions where secondary wall is absent but primary wall
remains. The shape and pattern of wall pitting vary with
species and organ type. Tracheids are present in all vascular
plants. Vessels consist of a stack of two or more vessel ele-
ments. Like tracheids, vessel elements are dead cells and
are connected to one another through perforation plates—
regions of the wall where pores or holes have developed.
Vessels are connected to other vessels and to tracheids
through pits. Vessels are found in most angiosperms and
are lacking in most gymnosperms. (B) Scanning electron
micrograph of oak wood showing two vessel elements that
make up a portion of a vessel. Large pits are visible on the
side walls, and the end walls are open at the perforation
plate. (420×) (C) Diagram of a bordered pit with a torus
either centered in the pit cavity or lodged to one side of the
cavity, thereby blocking flow. (B © G. Shih-R. Kessel/Visuals
Unlimited; C after Zimmermann 1983.)
▲
to overcome the frictional drag of moving water from the
soil to the top of the tree by multiplying our pressure gra-
dient of 0.02 MPa m
–1
by the height of the tree (0.02 MPa
m
–1
× 100 m = 2 MPa).
In addition to frictional resistance, we must consider
gravity. The weight of a standing column of water 100 m
tall creates a pressure of 1 MPa at the bottom of the water
column (100 m × 0.01 MPa m
–1
). This pressure gradient due
to gravity must be added to that required to cause water
movement through the xylem. Thus we calculate that a
pressure difference of roughly 3 MPa, from the base to the
top branches, is needed to carry water up the tallest trees.
The Cohesion–Tension Theory Explains Water
Transport in the Xylem
In theory, the pressure gradients needed to move water
through the xylem could result from the generation of pos-
itive pressures at the base of the plant or negative pressures
at the top of the plant. We mentioned previously that some
roots can develop positive hydrostatic pressure in their
xylem—the so-called root pressure. However, root pressure
is typically less than 0.1 MPa and disappears when the
transpiration rate is high, so it is clearly inadequate to
move water up a tall tree.
Instead, the water at the top of a tree develops a large
tension (a negative hydrostatic pressure), and this tension
pulls water through the xylem. This mechanism, first pro-
posed toward the end of the nineteenth century, is called
the cohesion–tension theory of sap ascent because it
requires the cohesive properties of water to sustain large
tensions in the xylem water columns (for details on the
history of the research on water movement, see
Web Essay
4.1).
Despite its attractiveness, the cohesion–tension theory
has been a controversial subject for more than a century
and continues to generate lively debate. The main contro-
versy surrounds the question of whether water columns in
the xylem can sustain the large tensions (negative pres-
sures) necessary to pull water up tall trees.
The most recent debate began when researchers modi-
fied the cell pressure probe technique to be able to measure
directly the tension in xylem vessels (Balling and Zimmer-
mann 1990). Prior to this development, estimates of xylem
pressures were based primarily on pressure chamber mea-
surements of leaves (for a description of the pressure cham-
ber method, see
Web Topic 3.6).
Initially, measurements with the xylem pressure probe
failed to find the expected large negative pressures, prob-
ably because of cavitation produced by tiny gas bubbles
introduced when the xylem walls are punctured with the
glass capillary of the pressure probe (Tyree 1997). However,
careful refinements of the technique eventually demon-
strated good agreement between pressure probe measure-
ments and the tensions estimated by the pressure chamber
(Melcher et al. 1998; Wei et al. 1999). In addition, indepen-
dent studies demonstrated that water in the xylem can sus-
tain large negative tensions (Pockman et al. 1995) and that
pressure chamber measurements of nontranspiring leaves
do reflect tensions in the xylem (Holbrook et al. 1995).
Most researchers have thus concluded that the basic
cohesion–tension theory is sound (Steudle 2001) (for alter-
native hypotheses, see Canny (1998), and
Web Essays 4.1
and 4.2). One can readily demonstrate xylem tensions by
puncturing intact xylem through a drop of ink on the sur-
face of a stem from a transpiring plant. When the tension
in the xylem is relieved, the ink is drawn instantly into the
xylem, resulting in visible streaks along the stem.
Xylem Transport of Water in Trees Faces Physical
Challenges
The large tensions that develop in the xylem of trees (see
Web Essay 4.3) and other plants can create some problems.
First, the water under tension transmits an inward force to
the walls of the xylem. If the cell walls were weak or pliant,
they would collapse under the influence of this tension.
The secondary wall thickenings and lignification of tra-
cheids and vessels are adaptations that offset this tendency
to collapse.
Asecond problem is that water under such tensions is
in a physically metastable state. We mentioned in Chapter 3
that the experimentally determined breaking strength of
degassed water (water that has been boiled to remove
gases) is greater than 30 MPa. This value is much larger
than the estimated tension of 3 MPa needed to pull water
up the tallest trees, so water within the xylem would not
normally reach tensions that would destabilize it.
However, as the tension in water increases, there is an
increased tendency for air to be pulled through microscopic
pores in the xylem cell walls. This phenomenon is called air
seeding. A second mode by which bubbles can form in
xylem conduits is due to the reduced solubility of gases in
ice (Davis et al. 1999): The freezing of xylem conduits can
lead to bubble formation. Once a gas bubble has formed
within the water column under tension, it will expand
because gases cannot resist tensile forces. This phenome-
non of bubble formation is known as cavitation or
embolism. It is similar to vapor lock in the fuel line of an
automobile or embolism in a blood vessel. Cavitation
breaks the continuity of the water column and prevents
water transport in the xylem (Tyree and Sperry 1989; Hacke
et al. 2001).
Such breaks in the water columns in plants are not
unusual. With the proper equipment, one can “hear” the
water columns break (Jackson et al. 1999). When plants are
deprived of water, sound pulses can be detected. The pulses
or clicks are presumed to correspond to the formation and
rapid expansion of air bubbles in the xylem, resulting in
high-frequency acoustic shock waves through the rest of the
plant. These breaks in xylem water continuity, if not
repaired, would be disastrous to the plant. By blocking the
main transport pathway of water, such embolisms would
cause the dehydration and death of the leaves.
54 Chapter 4
Plants Minimize the Consequences of Xylem
Cavitation
The impact of xylem cavitation on the plant is minimized
by several means. Because the tracheary elements in the
xylem are interconnected, one gas bubble might, in princi-
ple, expand to fill the whole network. In practice, gas bub-
bles do not spread far because the expanding gas bubble
cannot easily pass through the small pores of the pit mem-
branes. Since the capillaries in the xylem are interconnected,
one gas bubble does not completely stop water flow.
Instead, water can detour around the blocked point by trav-
eling through neighboring, connected conduits (Figure 4.7).
Thus the finite length of the tracheid and vessel conduits of
the xylem, while resulting in an increased resistance to
water flow, also provides a way to restrict cavitation.
Gas bubbles can also be eliminated from the xylem. At
night, when transpiration is low, xylem Y
p
increases and
the water vapor and gases may simply dissolve back into
the solution of the xylem. Moreover, as we have seen, some
plants develop positive pressures (root pressures) in the
xylem. Such pressures shrink the gas bubble and cause the
gases to dissolve. Recent studies indicate that cavitation
may be repaired even when the water in the xylem is
under tension (Holbrook et al. 2001). Amechanism for such
repair is not yet known and remains the subject of active
research (see
Web Essay 4.4). Finally, many plants have sec-
ondary growth in which new xylem forms each year. The
new xylem becomes functional before the old xylem ceases
to function, because of occlusion by gas bubbles or by sub-
stances secreted by the plant.
Water Evaporation in the Leaf Generates a
Negative Pressure in the Xylem
The tensions needed to pull water through the xylem are the
result of evaporation of water from leaves. In the intact plant,
water is brought to the leaves via the xylem of the leaf vas-
cular bundle(see Figure 4.1), which branches into a very fine
and sometimes intricate network of veins throughout the leaf
(Figure 4.8). This venation pattern becomes so finely
Water Balance of Plants 55
fpo
End wall
of vessel
element
with
bordered pits
Pit
Scalariform
perforation
plate
Gas-filled
cavitated
vessel
Water
vapor
bubble
Gas-filled
cavitated
tracheid
Liquid
water
FIGURE 4.7 Tracheids (right) and vessels (left) form a series of parallel,
interconnected pathways for water movement. Cavitation blocks water
movement because of the formation of gas-filled (embolized) conduits.
Because xylem conduits are interconnected through openings (“bor-
dered pits”) in their thick secondary walls, water can detour around the
blocked vessel by moving through adjacent tracheary elements. The
very small pores in the pit membranes help prevent embolisms from
spreading between xylem conduits. Thus, in the diagram on the right
the gas is contained within a single cavitated tracheid. In the diagram on
the left, gas has filled the entire cavitated vessel, shown here as being
made up of three vessel elements, each separated by scalariform perfo-
ration plates. In nature vessels can be very long (up to several meters in
length) and thus made up of many vessel elements.
FIGURE 4.8 Venation of a tobacco leaf,
showing ramification of the midrib into
finer lateral veins. This venation pattern
brings xylem water close to every cell in
the leaf. (After Kramer and Boyer 1995.)
branched that most cells in a typical leaf are within 0.5 mm
of a minor vein. From the xylem, water is drawn into the cells
of the leaf and along the cell walls.
The negative pressure that causes water to move up
through the xylem develops at the surface of the cell walls in
the leaf. The situation is analogous to that in the soil. The cell
wall acts like a very fine capillary wick soaked with water.
Water adheres to the cellulose microfibrils and other hydro-
philic components of the wall. The mesophyll cells within the
leaf are in direct contact with the atmosphere through an
extensive system of intercellular air spaces.
Initially water evaporates from a thin film lining these air
spaces. As water is lost to the air, the surface of the remain-
ing water is drawn into the interstices of the cell wall (Figure
4.9), where it forms curved air–water interfaces. Because of
the high surface tension of water, the curvature of these inter-
faces induces a tension, or negative pressure, in the water. As
more water is removed from the wall, the radius of curvature
56 Chapter 4
Plasma
membraneVacuole
Cell
wall
Air
evaporation
Chloroplast
Cytoplasm
Plasma
membrane
Cytoplasm
Cellulose
microfibrils
in cross
section
Air–water interface
Air
Water in wall
Cell wall
Radius of
curvature (µm)
Hydrostatic
pressure (MPa)
(A) 0.5 –0.3
(B) 0.05 –3
(C) 0.01 –15
EvaporationEvaporationEvaporation
Water film
(A)
(B)
(C)
FIGURE 4.9 Tensions or negative pressures originate
in leaves. As water evaporates from the surface film
that covers the cell walls of the mesophyll, water
withdraws farther into the interstices of the cell wall,
and surface tension causes a negative pressure in the
liquid phase. As the radius of curvature decreases,
the pressure decreases (becomes more negative), as
calculated from Equation 4.1.
of the air–water interfaces decreases and the pressure of the
water becomes more negative (see Equation 4.1). Thus the
motive force for xylem transport is generated at the air–
water interfaces within the leaf.
WATER MOVEMENT FROM THE LEAF TO
THE ATMOSPHERE
After water has evaporated from the cell surface into the
intercellular air space, diffusion is the primary means of
any further movement of the water out of the leaf. The
waxy cuticle that covers the leaf surface is a very effective
barrier to water movement. It has been estimated that only
about 5% of the water lost from leaves escapes through the
cuticle. Almost all of the water lost from typical leaves is
lost by diffusion of water vapor through the tiny pores of
the stomatal apparatus, which are usually most abundant
on the lower surface of the leaf.
On its way from the leaf to the atmosphere, water is
pulled from the xylem into the cell walls of the mesophyll,
where it evaporates into the air spaces of the leaf (Figure
4.10). The water vapor then exits the leaf through the sto-
matal pore. Water moves along this pathway predomi-
nantly by diffusion, so this water movement is controlled
by the concentration gradient of water vapor.
We will now examine the driving force for leaf transpi-
ration, the main resistances in the diffusion pathway from
the leaf to the atmosphere, and the anatomical features of
the leaf that regulate transpiration.
Water Vapor Diffuses Quickly in Air
We saw in Chapter 3 that diffusion in liquids is slow and,
thus, effective only within cellular dimensions. How long
would it take for a water molecule to diffuse from the cell
wall surfaces inside the leaf to the outside atmosphere? In
Chapter 3 we saw that the average time needed for a mol-
ecule to diffuse a distance L is equal to L
2
/D
s
, where D
s
is
the diffusion coefficient. The distance through which a
water molecule must diffuse from the site of evaporation
inside the leaf to the outside air is approximately 1 mm
(10
–3
m), and the diffusion coefficient of water in air is 2.4
× 10
–5
m
2
s
–1
. Thus the average time needed for a water
Water Balance of Plants 57
Mesophyll
cells
Palisade
parenchyma Xylem
Air boundary
layer
Cuticle
Upper
epidermis
Air boundary
layer
Low water
vapor content
Boundary layer
resistance (r
b
)
Leaf stomatal
resistance (r
s
)
High CO
2
Water
vapor
CO
2
Guard cell
Low CO
2
High water
vapor
content
Substomatal
cavity
Lower
epidermis
Cuticle
Stomatal pore
FIGURE 4.10 Water pathway through the leaf. Water is pulled from the xylem into
the cell walls of the mesophyll, where it evaporates into the air spaces within the
leaf. Water vapor then diffuses through the leaf air space, through the stomatal
pore, and across the boundary layer of still air found next to the leaf surface. CO
2
diffuses in the opposite direction along its concentration gradient (low inside,
higher outside).
58 Chapter 4
molecule to escape the leaf is approximately 0.042 s. Thus
we see that diffusion is adequate to move water vapor
through the gas phase of the leaf. The reason that this time
is so much shorter than the 2.5 s calculated in Chapter 3 for
a glucose molecule to diffuse across a 50 µm cell, is that dif-
fusion is much more rapid in a gas than in a liquid.
Transpiration from the leaf depends on two major fac-
tors: (1) the difference in water vapor concentration
between the leaf air spaces and the external air and (2) the
diffusional resistance (r) of this pathway. We will first dis-
cuss how the difference in water vapor concentration con-
trols transpiration rates.
The Driving Force for Water Loss Is the Difference
in Water Vapor Concentration
The difference in water vapor concentration is expressed as
c
wv(leaf)
– c
wv(air)
. The water vapor concentration of bulk air
(c
wv(air)
) can be readily measured, but that of the leaf
(c
wv(leaf)
) is more difficult to assess.
Whereas the volume of air space inside the leaf is small,
the wet surface from which water evaporates is compara-
tively large. (Air space volume is about 5% of the total leaf
volume for pine needles, 10% for corn leaves, 30% for bar-
ley, and 40% for tobacco leaves.) In contrast to the volume
of the air space, the internal surface area from which water
evaporates may be from 7 to 30 times the external leaf area.
This high ratio of surface area to volume makes for rapid
vapor equilibration inside the leaf. Thus we can assume
that the air space in the leaf is close to water potential equi-
librium with the cell wall surfaces from which liquid water
is evaporating.
An important point from this relationship is that within
the range of water potentials experienced by transpiring
leaves (generally <2.0 MPa) the equilibrium water vapor
concentration is within a few percentage points of the sat-
uration water vapor concentration. This allows one to esti-
mate the water vapor concentration within a leaf from its
temperature, which is easy to measure. (
Web Topic 4.5
shows how we can calculate the water vapor concentration
in the leaf air spaces and dis-
cusses other aspects of the
water relations within a leaf.)
The concentration of water
vapor, c
wv
, changes at various
points along the transpiration
pathway. We see from Table
4.2 that c
wv
decreases at each
step of the pathway from the
cell wall surface to the bulk air
outside the leaf. The impor-
tant points to remember are
(1) that the driving force for
water loss from the leaf is the
absolute concentration differ-
ence (difference in c
wv
, in mol
m
–3
), and (2) that this difference depends on leaf tempera-
ture, as shown in Figure 4.11.
Water Loss Is Also Regulated by the
Pathway Resistances
The second important factor governing water loss from the
leaf is the diffusional resistance of the transpiration path-
way, which consists of two varying components:
1. The resistance associated with diffusion through the
stomatal pore, the leaf stomatal resistance (r
s
).
2. The resistance due to the layer of unstirred air next
to the leaf surface through which water vapor must
1
2
3
4
5
0–10 10 20 30 40 50
Air temperature (°C)
Saturation water vapor concentration,
c
wv(sat.)
(mol m
–3
)
Temperature
(°C) (mol m
–3
)
0.269
0.378
0.522
0.713
0.961
1.28
1.687
2.201
2.842
3.637
c
wv
0
5
10
15
20
25
30
35
40
45
FIGURE 4.11 Concentration of water vapor in saturated air
as a function of air temperature.
TABLE 4.2
Representative values for relative humidity,absolute water vapor concentration,
and water potential for four points in the pathway of water loss from a leaf
Water vapor
Relative Concentration Potential
Location humidity (mol m
–3
) (MPa)
a
Inner air spaces (25°C) 0.99 1.27 −1.38
Just inside stomatal pore (25°C) 0.95 1.21 −7.04
Just outside stomatal pore (25°C) 0.47 0.60 −103.7
Bulk air (20°C) 0.50 0.50 −93.6
Source:Adapted from Nobel 1999.
Note:See Figure 4.10.
a
Calculated using Equation 4.5.2 in Web Topic 4.5;with values for RT/V
_
w
of 135 MPa at 20°C and 137.3
MPa at 25°C.
diffuse to reach the turbulent air of the atmosphere
(see Figure 4.10). This second resistance, r
b
, is called
the leaf boundary layer resistance. We will discuss
this type of resistance before considering stomatal
resistance.
The thickness of the boundary layer is determined pri-
marily by wind speed. When the air surrounding the leaf
is very still, the layer of unstirred air on the surface of the
leaf may be so thick that it is the primary deterrent to water
vapor loss from the leaf. Increases in stomatal apertures
under such conditions have little effect on transpiration
rate (Figure 4.12) (although closing the stomata completely
will still reduce transpiration).
When wind velocity is high, the moving air reduces the
thickness of the boundary layer at the leaf surface, reducing
the resistance of this layer. Under such conditions, the sto-
matal resistance will largely control water loss from the leaf.
Various anatomical and morphological aspects of the
leaf can influence the thickness of the boundary layer.
Hairs on the surface of leaves can serve as microscopic
windbreaks. Some plants have sunken stomata that pro-
vide a sheltered region outside the stomatal pore. The size
and shape of leaves also influence the way the wind
sweeps across the leaf surface. Although these and other
factors may influence the boundary layer, they are not char-
acteristics that can be altered on an hour-to-hour or even
day-to-day basis. For short-term regulation, control of
stomatal apertures by the guard cells plays a crucial role in
the regulation of leaf transpiration.
Stomatal Control Couples Leaf Transpiration to
Leaf Photosynthesis
Because the cuticle covering the leaf is nearly impermeable
to water, most leaf transpiration results from the diffusion
of water vapor through the stomatal pore (see Figure 4.10).
The microscopic stomatal pores provide a low-resistance
pathway for diffusional movement of gases across the epi-
dermis and cuticle. That is, the stomatal pores lower the
diffusional resistance for water loss from leaves. Changes
in stomatal resistance are important for the regulation of
water loss by the plant and for controlling the rate of car-
bon dioxide uptake necessary for sustained CO
2
fixation
during photosynthesis.
All land plants are faced with competing demands of tak-
ing up CO
2
from the atmosphere while limiting water loss.
The cuticle that covers exposed plant surfaces serves as an
effective barrier to water loss and thus protects the plant
from desiccation. However, plants cannot prevent outward
diffusion of water without simultaneously excluding CO
2
from the leaf. This problem is compounded because the con-
centration gradient for CO
2
uptake is much, much smaller
than the concentration gradient that drives water loss.
When water is abundant, the functional solution to this
dilemma is the temporal regulation of stomatal apertures—
open during the day, closed at night. At night, when there
is no photosynthesis and thus no demand for CO
2
inside
the leaf, stomatal apertures are kept small, preventing
unnecessary loss of water. On a sunny morning when the
supply of water is abundant and the solar radiation inci-
dent on the leaf favors high photosynthetic activity, the
demand for CO
2
inside the leaf is large, and the stomatal
pores are wide open, decreasing the stomatal resistance to
CO
2
diffusion. Water loss by transpiration is also substan-
tial under these conditions, but since the water supply is
plentiful, it is advantageous for the plant to trade water for
the products of photosynthesis, which are essential for
growth and reproduction.
On the other hand, when soil water is less abundant, the
stomata will open less or even remain closed on a sunny
morning. By keeping its stomata closed in dry conditions,
the plant avoids dehydration. The values for (c
wv(leaf)
–
c
wv(air)
) and for r
b
are not readily amenable to biological con-
trol. However, stomatal resistance (r
s
) can be regulated by
opening and closing of the stomatal pore. This biological
control is exerted by a pair of specialized epidermal cells, the
guard cells, which surround the stomatal pore (Figure 4.13).
Water Balance of Plants 59
50
100
150
200
250
300
0 5 10 15 20
Stomatal aperture (mm)
Transpirational flux (mg water vapor m
–2
leaf surface s
–1
)
Moving
air
Still
air
Flux limited by
boundary layer
resistance
FIGURE 4.12 Dependence of transpiration flux on the sto-
matal aperture of zebra plant (Zebrina pendula) in still air
and in moving air. The boundary layer is larger and more
rate limiting in still air than in moving air. As a result, the
stomatal aperture has less control over transpiration in still
air. (From Bange 1953.)
The Cell Walls of Guard Cells Have Specialized
Features
Guard cells can be found in leaves of all vascular plants,
and they are also present in organs from more primitive
plants, such as the liverworts and the mosses (Ziegler
1987). Guard cells show considerable morphological diver-
sity, but we can distinguish two main types: One is typical
of grasses and a few other monocots, such as palms; the
other is found in all dicots, in many monocots, and in
mosses, ferns, and gymnosperms.
In grasses (see Figure 4.13A), guard cells have a charac-
teristic dumbbell shape, with bulbous ends. The pore
proper is a long slit located between the two “handles” of
the dumbbells. These guard cells are always flanked by a
60 Chapter 4
FIGURE 4.13 Electron micrographs of stomata. (A) A stoma
from a grass. The bulbous ends of each guard cell show
their cytosolic content and are joined by the heavily thick-
ened walls. The stomatal pore separates the two midpor-
tions of the guard cells. (2560×) (B) Stomatal complexes of
the sedge, Carex, viewed with differential interference con-
trast light microscopy. Each complex consists of two guard
cells surrounding a pore and two flanking subsidiary cells.
(550×) (C) Scanning electron micrographs of onion epider-
mis. The top panel shows the outside surface of the leaf,
with a stomatal pore inserted in the cuticle. The bottom
panel shows a pair of guard cells facing the stomatal cavity,
toward the inside of the leaf. (1640×) (A from Palevitz 1981,
B from Jarvis and Mansfield 1981, Aand B courtesy of B.
Palevitz; micrographs in C from Zeiger and Hepler 1976
[top] and E. Zeiger and N. Burnstein [bottom].)
Cytosol and vacuole
Pore
Heavily thickened
guard cell wall
Guard cells
Subsidiary cell
Epidermal cell
Stomatal pore
Guard cell
(C)
(A)
(B)
pair of differentiated epidermal cells called subsidiary
cells, which help the guard cells control the stomatal pores
(see Figure 4.13B). The guard cells, subsidiary cells, and
pore are collectively called the stomatal complex.
In dicot plants and nongrass monocots, kidney-shaped
guard cells have an elliptical contour with the pore at its
center (see Figure 4.13C). Although subsidiary cells are not
uncommon in species with kidney-shaped stomata, they
are often absent, in which case the guard cells are sur-
rounded by ordinary epidermal cells.
Adistinctive feature of the guard cells is the specialized
structure of their walls. Portions of these walls are sub-
stantially thickened (Figure 4.14) and may be up to 5 µm
across, in contrast to the 1 to 2 µm typical of epidermal
cells. In kidney-shaped guard cells, a differential thicken-
ing pattern results in very thick inner and outer (lateral)
walls, a thin dorsal wall (the wall in contact with epider-
mal cells), and a somewhat thickened ventral (pore) wall
(see Figure 4.14). The portions of the wall that face the
atmosphere extend into well-developed ledges, which form
the pore proper.
The alignment of cellulose microfibrils, which reinforce
all plant cell walls and are an important determinant of cell
shape (see Chapter 15), plays an essential role in the open-
ing and closing of the stomatal pore. In ordinary cells hav-
ing a cylindrical shape, cellulose microfibrils are oriented
transversely to the long axis of the cell. As a result, the cell
expands in the direction of its long axis because the cellu-
lose reinforcement offers the least resistance at right angles
to its orientation.
In guard cells the microfibril organization is different.
Kidney-shaped guard cells have cellulose microfibrils fan-
ning out radially from the pore (Figure 4.15A). Thus the cell
girth is reinforced like a steel-belted radial tire, and the
guard cells curve outward during stomatal opening
(Sharpe et al. 1987). In grasses, the dumbbell-shaped guard
cells function like beams with inflatable ends. As the bul-
bous ends of the cells increase in volume and swell, the
beams are separated from each other and the slit between
them widens (Figure 4.15B).
An Increase in Guard Cell Turgor Pressure
Opens the Stomata
Guard cells function as multisensory hydraulic valves. Envi-
ronmental factors such as light intensity and quality, tem-
perature, relative humidity, and intracellular CO
2
concentra-
Water Balance of Plants 61
Atmosphere
Interior of leaf
Vacuole
Nucleus
Pore
SUBSTOMATAL CAVITY
ATMOSPHERE
Plastid
Inner cell wall
FIGURE 4.14 Electron micrograph showing a pair of guard cells from the dicot
Nicotiana tabacum (tobacco). The section was made perpendicular to the main sur-
face of the leaf. The pore faces the atmosphere; the bottom faces the substomatal
cavity inside the leaf. Note the uneven thickening pattern of the walls, which deter-
mines the asymmetric deformation of the guard cells when their volume increases
during stomatal opening. (From Sack 1987, courtesy of F. Sack.)
2 µm
tions are sensed by guard cells, and these signals are inte-
grated into well-defined stomatal responses. If leaves kept in
the dark are illuminated, the light stimulus is perceived by
the guard cells as an opening signal, triggering a series of
responses that result in opening of the stomatal pore.
The early aspects of this process are ion uptake and
other metabolic changes in the guard cells, which will be
discussed in detail in Chapter 18. Here we will note the
effect of decreases in osmotic potential (Y
s
) resulting from
ion uptake and from biosynthesis of organic molecules in
the guard cells. Water relations in guard cells follow the
same rules as in other cells. As Y
s
decreases, the water
potential decreases and water consequently moves into the
guard cells. As water enters the cell, turgor pressure
increases. Because of the elastic properties of their walls,
guard cells can reversibly increase their volume by 40 to
100%, depending on the species. Because of the differential
thickening of guard cell walls, such changes in cell volume
lead to opening or closing of the stomatal pore.
The Transpiration Ratio Measures the Relationship
between Water Loss and Carbon Gain
The effectiveness of plants in moderating water loss while
allowing sufficient CO
2
uptake for photosynthesis can be
assessed by a parameter called the transpiration ratio. This
value is defined as the amount of water transpired by the
plant, divided by the amount of carbon dioxide assimilated
by photosynthesis.
For typical plants in which the first stable product of
carbon fixation is a three-carbon compound (such plants
are called C
3
plants; see Chapter 8), about 500 molecules of
water are lost for every molecule of CO
2
fixed by photo-
synthesis, giving a transpiration ratio of 500. (Sometimes
the reciprocal of the transpiration ratio, called the water use
efficiency, is cited. Plants with a transpiration ratio of 500
have a water use efficiency of 1/500, or 0.002.)
The large ratio of H
2
O efflux to CO
2
influx results from
three factors:
1. The concentration gradient driving water loss is about
50 times larger than that driving the influx of CO
2
. In
large part, this difference is due to the low concentra-
tion of CO
2
in air (about 0.03%) and the relatively
high concentration of water vapor within the leaf.
2. CO
2
diffuses about 1.6 times more slowly through air
than water does (the CO
2
molecule is larger than
H
2
O and has a smaller diffusion coefficient).
3. CO
2
uptake must cross the plasma membrane, the
cytoplasm, and the chloroplast envelope before it is
assimilated in the chloroplast. These membranes add
to the resistance of the CO
2
diffusion pathway.
Some plants are adapted for life in particularly dry envi-
ronments or seasons of the year. These plants, designated
the C
4
and CAM plants, utilize variations in the usual pho-
tosynthetic pathway for fixation of carbon dioxide. Plants
with C
4
photosynthesis (in which a four-carbon compound
is the first stable product of photosynthesis; see Chapter 8)
generally transpire less water per molecule of CO
2
fixed; a
typical transpiration ratio for C
4
plants is about 250. Desert-
adapted plants with CAM (crassulacean acid metabolism)
photosynthesis, in which CO
2
is initially fixed into four-car-
bon organic acids at night, have even lower transpiration
ratios; values of about 50 are not unusual.
OVERVIEW:THE
SOIL–PLANT–ATMOSPHERE CONTINUUM
We have seen that movement of water from the soil through
the plant to the atmosphere involves different mechanisms
of transport:
• In the soil and the xylem, water moves by bulk flow
in response to a pressure gradient (∆Y
p
).
62 Chapter 4
Radially arranged
cellulose microfibrils
Radially arranged
cellulose microfibrils
Epidermal cells
Guard cells Pore
Guard cells
(A)
(B)
Subsidiary cell
Stomatal complex
Epidermal cells
Pore
FIGURE 4.15 The radial alignment of the cellulose microfib-
rils in guard cells and epidermal cells of (A) a kidney-
shaped stoma and (B) a grasslike stoma. (From Meidner
and Mansfield 1968.)
• In the vapor phase, water moves primarily by diffu-
sion, at least until it reaches the outside air, where
convection (a form of bulk flow) becomes dominant.
• When water is transported across membranes, the
driving force is the water potential difference across
the membrane. Such osmotic flow occurs when cells
absorb water and when roots transport water from
the soil to the xylem.
In all of these situations, water moves toward regions of low
water potential or free energy. This phenomenon is illustrated
in Figure 4.16, which shows representative values for water
potential and its components at various points along the
water transport pathway.
Water potential decreases continuously from the soil to
the leaves. However, the components of water potential
can be quite different at different parts of the pathway. For
example, inside the leaf cells, such as in the mesophyll, the
water potential is approximately the same as in the neigh-
boring xylem, yet the components of Y
w
are quite differ-
ent. The dominant component of Y
w
in the xylem is the
negative pressure (Y
p
), whereas in the leaf cell Y
p
is gen-
erally positive. This large difference in Y
p
occurs across the
plasma membrane of the leaf cells. Within the leaf cells,
water potential is reduced by a high concentration of dis-
solved solutes (low Y
s
).
SUMMARY
Water is the essential medium of life. Land plants are faced
with potentially lethal desiccation by water loss to the
atmosphere. This problem is aggravated by the large sur-
face area of leaves, their high radiant-energy gain, and their
need to have an open pathway for CO
2
uptake. Thus there
is a conflict between the need for water conservation and
the need for CO
2
assimilation.
The need to resolve this vital conflict determines much
of the structure of land plants: (1) an extensive root system
Water Balance of Plants 63
Outside air
(relative humidity = 50%)
Leaf internal air space
Cell wall of mesophyll
(at 10 m)
Vacuole of mesophyll
(at 10 m)
Leaf xylem
(at 10 m)
Root xylem
(near surface)
Root cell vacuole
(near surface)
Soil adjacent to root
Soil 10 mm from root
–95.2
–0.8
–0.8
–0.8
–0.8
–0.6
–0.6
–0.5
–0.3
–95.2
–0.8
–0.7
0.2
–0.8
–0.5
0.5
–0.4
–0.2
–0.2
–1.1
–0.1
–0.1
–1.1
–0.1
–0.1
0.1
0.1
0.1
0.0
0.0
0.0
0.0
Water
potential
(Y
w
)
Location
Water potential and its components (in MPa)
Osmotic
potential
(Y
s
)
Gravity
(Y
g
)
Pressure
(Y
p
)
20 m
Water potential
in gas phase
RT
ln [RH]
(
(
V
w
FIGURE 4.16 Representative overview of water potential and its components at var-
ious points in the transport pathway from the soil through the plant to the atmo-
sphere. Water potential (Y
w
) can be measured through this continuum, but the
components vary. In the liquid part of the pathway, pressure (Y
p
), osmotic potential
(Y
s
), and gravity (Y
g
), determine Y
w
. In the air, only the relative humidity (RT/V
–
w
×
ln[RH]) is important. Note that although the water potential is the same in the vac-
uole of the mesophyll cell and in the surrounding cell wall, the components of Y
w
can differ greatly (e.g., in this case Y
p
is 0.2 MPa inside the mesophyll cell and –0.7
MPa outside). (After Nobel 1999.)
to extract water from the soil; (2) a low-resistance pathway
through the xylem vessel elements and tracheids to bring
water to the leaves; (3) a hydrophobic cuticle covering the
surfaces of the plant to reduce evaporation; (4) microscopic
stomata on the leaf surface to allow gas exchange; and (5)
guard cells to regulate the diameter (and diffusional resis-
tance) of the stomatal aperture.
The result is an organism that transports water from the
soil to the atmosphere purely in response to physical forces.
No energy is expended directly by the plant to translocate
water, although development and maintenance of the
structures needed for efficient and controlled water trans-
port require considerable energy input.
The mechanisms of water transport from the soil
through the plant body to the atmosphere include diffu-
sion, bulk flow, and osmosis. Each of these processes is cou-
pled to different driving forces.
Water in the plant can be considered a continuous
hydraulic system, connecting the water in the soil with the
water vapor in the atmosphere. Transpiration is regulated
principally by the guard cells, which regulate the stomatal
pore size to meet the photosynthetic demand for CO
2
uptake while minimizing water loss to the atmosphere.
Water evaporation from the cell walls of the leaf mesophyll
cells generates large negative pressures (or tensions) in the
apoplastic water. These negative pressures are transmitted
to the xylem, and they pull water through the long xylem
conduits.
Although aspects of the cohesion–tension theory of sap
ascent are intermittently debated, an overwhelming body
of evidence supports the idea that water transport in the
xylem is driven by pressure gradients. When transpiration
is high, negative pressures in the xylem water may cause
cavitation (embolisms) in the xylem. Such embolisms can
block water transport and lead to severe water deficits in
the leaf. Water deficits are commonplace in plants, neces-
sitating a host of adaptive responses that modify the phys-
iology and development of plants.
Web Material
Web Topics
4.1 Irrigation
A discussion of some widely used irrigation
methods and their impact on crop yield and soil
salinity.
4.2 Soil Hydraulic Conductivity and Water
Potential
Soil hydraulic conductivity determines the ease
with which water moves through the soil, and it
is closely related to soil water potential.
4.3 Root Hydraulic Conductance
A discussion of root hydraulic conductance and
an example of its quantification.
4.4 Calculating Velocities of Water Movement in
the Xylem and in Living Cells
Calculations of velocities of water movement
through the xylem, up a tree trunk, and across
cell membranes in a tissue,and their implications
for water transport mechanism.
4.5 Leaf Transpiration and Water Vapor Gradients
An analysis of leaf transpiration and stomatal
conductance,and their relationship with leaf and
air water vapor concentrations.
Web Essays
4.1 A Brief History of the Study of Water
Movement in the Xylem
The history of our understanding of sap ascent in
plants, especially in trees, is a beautiful example
of how knowledge about plant is acquired.
4.2 The Cohesion–Tension Theory at Work
A detailed discussion of the Cohesion–Tension
theory on sap ascent in plants,and some alterna-
tive explanations.
4.3 How Water Climbs to the Top of a 112-Meter-
Tall Tree
Measurements of photosynthesis and transpira-
tion in 112-meter tall trees show that some of the
conditions experienced by the top foliage com-
pares to that of extreme deserts.
4.4 Cavitation and Refilling
A possible mechanism for cavitation repair is
under active investigation.
Chapter References
Balling, A., and Zimmermann, U. (1990) Comparative measure-
ments of the xylem pressure of Nicotiana plants by means of the
pressure bomb and pressure probe. Planta 182: 325–338.
Bange, G. G. J. (1953) On the quantitative explanation of stomatal
transpiration. Acta Botanica Neerlandica 2: 255–296.
Canny, M. J. (1998) Transporting water in plants. Am. Sci. 86: 152–159.
Davis, S. D., Sperry, J. S., and Hacke, U. G. (1999) The relationship
between xylem conduit diameter and cavitation caused by freez-
ing. Am. J. Bot. 86: 1367–1372.
Esau, K. (1953) Plant Anatomy. John Wiley & Sons, Inc. New York.
Frensch, J., Hsiao, T. C., and Steudle, E. (1996) Water and solute
transport along developing maize roots. Planta 198: 348–355.
Hacke, U. G., Stiller, V., Sperry, J. S., Pittermann, J., and McCulloh, K.
A. (2001) Cavitation fatigue: Embolism and refilling cycles can
weaken the cavitation resistance of xylem. Plant Physiol. 125:
779–786.
64 Chapter 4
Holbrook, N. M., Ahrens, E. T., Burns, M. J., and Zwieniecki, M. A.
(2001) In vivo observation of cavitation and embolism repair
using magnetic resonance imaging. Plant Physiol. 126: 27–31.
Holbrook, N. M., Burns, M. J., and Field, C. B. (1995) Negative xylem
pressures in plants: Atest of the balancing pressure technique.
Science 270: 1193–1194.
Jackson, G. E., Irvine, J., and Grace, J. (1999) Xylem acoustic emis-
sions and water relations of Calluna vulgaris L. at two climato-
logical regions of Britain. Plant Ecol. 140: 3–14.
Jarvis, P. G., and Mansfield, T. A. (1981) Stomatal Physiology. Cam-
bridge University Press, Cambridge.
Jensen, C. R., Mogensen, V. O., Poulsen, H H., Henson, I. E., Aagot,
S., Hansen, E., Ali, M., and Wollenweber, B. (1998) Soil water
matric potential rather than water content determines drought
responses in field-grown lupin (Lupinus angustifolius). Aust. J.
Plant Physiol. 25: 353–363.
Kramer, P. J., and Boyer, J. S. (1995) Water Relations of Plants and Soils.
Academic Press, San Diego, CA.
Meidner, H., and Mansfield, D. (1968) Stomatal Physiology. McGraw-
Hill, London.
Melcher, P. J., Meinzer, F. C., Yount, D. E., Goldstein, G., and Zim-
mermann, U. (1998) Comparative measurements of xylem pres-
sure in transpiring and non-transpiring leaves by means of the
pressure chamber and the xylem pressure probe. J. Exp. Bot. 49:
1757–1760.
Nobel, P. S. (1999) Physicochemical and Environmental Plant Physiology,
2nd ed. Academic Press, San Diego, CA.
Palevitz, B. A. (1981) The structure and development of guard cells.
In Stomatal Physiology, P. G. Jarvis and T. A. Mansfield, eds., Cam-
bridge University Press, Cambridge, pp. 1–23.
Pockman, W. T., Sperry, J. S., and O’Leary, J. W. (1995) Sustained and
significant negative water pressure in xylem. Nature 378: 715–716.
Sack, F. D. (1987) The development and structure of stomata. In
Stomatal Function, E. Zeiger, G. Farquhar, and I. Cowan, eds.,
Stanford University Press, Stanford, CA, pp. 59–90.
Sharpe, P. J. H., Wu, H I., and Spence, R. D. (1987) Stomatal mechan-
ics. In Stomatal Function, E. Zeiger, G. Farquhar, and I. Cowan,
eds., Stanford University Press, Stanford, CA, pp. 91–114.
Steudle, E. (2001) The cohesion-tension mechanism and the acquisi-
tion of water by plant roots. Annu. Rev. Plant Physiol. Plant Mol.
Biol. 52: 847–875.
Steudle, E., and Frensch, J. (1996) Water transport in plants: Role of
the apoplast. Plant and Soil 187: 67–79.
Tyree, M. T. (1997) The cohesion-tension theory of sap ascent: Cur-
rent controversies. J. Exp. Bot. 48: 1753–1765.
Tyree, M. T., and Sperry, J. S. (1989) Vulnerability of xylem to cavi-
tation and embolism. Annu. Rev. Plant Physiol. Plant Mol. Biol. 40:
19–38.
Wei, C., Tyree, M. T., and Steudle, E. (1999) Direct measurement of
xylem pressure in leaves of intact maize plants: Atest of the cohe-
sion-tension theory taking hydraulic architecture into consider-
ation. Plant Physiol. Plant Mol. Biol. 121: 1191–1205.
Zeiger, E., and Hepler, P. K. (1976) Production of guard cell proto-
plasts from onion and tobacco. Plant Physiol. 58: 492–498.
Ziegler, H. (1987) The evolution of stomata. In Stomatal Function,E.
Zeiger, G. Farquhar, and I. Cowan, eds., Stanford University
Press, Stanford, CA, pp. 29–58.
Zimmermann, M. H. (1983) Xylem Structure and the Ascent of Sap.
Springer, Berlin.
Water Balance of Plants 65