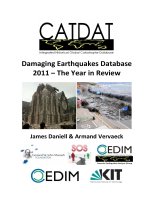
Damaging Earthquakes Database 2011 – The Year in Review docx
Bạn đang xem bản rút gọn của tài liệu. Xem và tải ngay bản đầy đủ của tài liệu tại đây (1.86 MB, 43 trang )
DamagingEarthquakesDatabase
2011–TheYearinReview
JamesDaniell&ArmandVervaeck
Author’sNote
ii
Author’sNotes
WehopethatyouenjoytheCATDATYearlyReviewofDamagingEarthquakesin2011.TheCATDAT
Databasehasbeenbuilt upbycollectingearthquake, floodandothernaturaldisasterloss datafor
quiteafewyearssince2003attheUniversityofAdelaide,withamoreconcertedeffortinthe
past3
to4yearstobuildupthedatabasesfurther.Thisreportin2011onlyshowsasmallpercentageofthe
datacollectedbutanewandexcitingfutureinearthquakereporting.Inthelast12months,wehave
reported constantly on www.earthquake‐report.com
, founded by Armand Vervaeck, and worked
tirelessly to provide the best quality scientific reporting of felt earthquake and volcanic events
worldwideandCATDATtoprovidedetailedaccountsoneverydamagingearthquakeworldwide.
Thepurposeofthisreportistopresent thedamagingearthquakesintheyear2011aroundtheworld
thatwereenteredintotheCATDATDamagingEarthquakeDatabaseintermsoftheirsocio‐economic
effects. This 2011 report showcases the work that CATDAT, in collaboration with earthquake‐
report.com/SOSEarthquakes,isdoing.
Abigthan kstoMarenforsupportingmethroughthesporadiclatenights(whenearthquakeshave
occurred), as
well as with SMS updates, translations, constant earthquake discussions and
intellectualconversations.Iwouldalsoliketothankmyparents,AnneandTrevor,andalsomysister,
Katherine,andbrother‐in‐law,Quentin,forthenumerousreportsandpapersIhavesentthemand
theyhavecheckedandforthenumerous
updatesastonaturaldisasterdata.
A big thank you goes to the General Sir John Monash Foundation (supported by the Australian
Government)thathasbeenfundingmyPhDresearchatKarlsruheatKIT/CEDIMandallowedmeto
choose this location from all worldwide institutions (and in particular I would
like to thank Peter
Binks). I would like to also thank the University of Adelaide, Université Joseph Fourier Grenoble,
UniversityofPaviaandKarlsruheInstituteofTechnologyformyeducationandfortheirpromotionof
learninganddevelopmentoutsidethecourseenvironment.
Thankyou alsotothe Centerof DisasterManagement
and Risk Reduction Technology (CEDIM)for
supporting me in my research in the natural disaster field. In addition, I would like to thank
FriedemannWenzel,BijanKhazaiandTinaKunz‐Plappfortheirinterest,supportandmotivatingme
topublishmywork.Ihavealsobeenaidedbyanumber
ofinterestedindividualsforcomponentsof
theda tabasebutwith theamountofdataaroundonhistoricaldamagingearthquakes,Iamalways
interestedinnewreports,studies,questions,comments,improvementsandcollaboration.
Iwould alsolike to urge people’s involvementwithsome greatworldwide
earthquake and natural disaster risk related initiatives
out there – just to
mention a few; Willis Research Network (WRN), EERI, USGS‐PAGER, GEM,
EMSC‐CSEM,GEO‐CANandWAPMERR.
Manythanks,
JamesDaniell
Thedatacontainedinthisreportisuptodateasof7January2012.Theauthortakesnoresponsibility
forerrorsthatmaybeinthedataan dalsomisuseofthedataprovided.TheEQLIPSEBuildingInventoryDatabase,CATDATNaturalDisaster
andSocioeconomicDatabases,OPAL Project,associateddataand
publicationsremain theintellectualproperty ofJames Daniellandare
nottobereproducedinanyformwithoutpermission.
Author’sNote
iii
SOS Earthquakes and Earthquake‐report.com were developed to report about earthquakes and
volcanoes in the best possible way and to create value‐added information with a scientific and
earthquakelossestimationperspective.
Earthquake Report bridges the gap in‐between science and basic understanding.
News in thesite not only appears very
quickly, but we will always try to bring “Added Value” and
“Scientific/SocialInsight” newsthatyouwillnotfindanywhereelse,aswellasdatafromCATDAT.
Earthquake Report focusses on the Impact of Earthquakes and Volcanoes on society. We will
search, analyse and create in‐depth socio‐economic reports
for unique news, even in the most
remoteplacesonEarth.VictimsofanearthquakeinthejungleofPapua NewGuineameritthesame
attentionasthosepeoplelivinginSanFrancisco,Tokyo,Port‐au‐PrinceorConcepción.
Earthquake‐Report.com is the information part ofSOS Earthquakes, anon
‐profit
organizationspecializi ng inearthquakes,with5importantgoals:
‐bringingthebestpossible,highestqualityearthquakeinformationincludingCATDATdata
‐providingfreeorcheaptechnologytoolsformassmedia(QuakeSOSiPhoneapplication)
‐providingQuickandStructuralaidtoearthquakevictimsallovertheworld(stilltobeorganized)
‐
givingrationalunbiasedgeophysical,seismological,engineeringandscientificearthquakedetails.
‐workingonearthquakepreparednessandprevention.
EarthquakeReportalsosupportsQuakeSOS,theearthquakeemergencyiPhoneApplication.
SOS Earthquakes was founded in August 2010. SOS Earthquakes andEarthquake‐Report.comare
privateinitiativesto makethe worldjusta littlebit better.
Everysingledonated dollarasalifeline
that strengthens our initiative and is needed for server space, programming and increased data
gatheringcapability.
WewelcomealsothesupportofSTRATEGICPARTNERSwhowillenableustoreachasmanypeople
as possible. Strategic partners can be individuals or companieswho
want to make the world less
traumatic, just like we do, or people or companies who require the latest damage, casualty, aid,
economicandsocialdatafromearthquakes.
Inthisrespectearthquake‐report.comandCATDATtogetherprovidethelatestandbestup‐to‐date
informationpost‐earthquakewitharapidly
growingnumberofsubscribersanddatainputsources.
PleasecontactmeorJamestomakeadonationortobecomeastrategicpartner.Withoutmonetary
support,thisserviceunfortunatelycannotcontinue.
Postaladdress:Cederstraat21,2800Mechelen,Belgium,Phone:+32478299395Fax:+3215414670
In addition,I would like to
thankmy wife, Gerda, for her loving support
through my 24‐hour a day reporting and work with earthquake‐
report.com, and also to my family and friends as well as the millionsof
earthquake‐report.com readers and subscribers. Thankyou and I hope
thatwecancontinuetheservicein2012.
Manythanks,
ArmandVervaeck
TableofContents
iv
TABLEOFCONTENTS
Page
Author’sNotes ii
TABLEOFCONTENTS iv
LISTOFFIGURES iv
LISTOFTABLES v
1 Introduction 1
2 WhatisCATDAT? 2
2.1 Whatiscontainedinthedatabase? 2
2.2 Entrycriteria 4
3 DamagingEarthquakesfrom2011intheCATDATDamagingEQDatabase 5
3.1 WherehavetheCATDATdamagingearthquakesoccurred? 5
3.2 Casualty‐bearing2011earthquakes 7
3.3 2011earthquakeswithover100peoplehomelessorrequiringshelter 11
3.4 EconomicLossesfromearthquakesin2011over$5millionUS 15
3.5 InsuredLossesfromearthquakesin2011sofar. 19
3.6 AquickcomparisonoftheNewZealandandTohokuEarthquakesinNumbers 21
4 Aquickcomparisonofthe2011LossestotheCATDATDamagingEarthquakesDatabase
since1900 22
5 Conclusion 25
6 MainReferences 27
AppendixA:Summarypagesofeach2011damagingearthquake 31
ListofFigures
iv
LISTOFFIGURES
Page
Figure1‐TheprocessusedtocreatetheCATDATDamaging EarthquakesDatabase(Daniell,2011)
2
Figure2–TheCATDATDamagingEarthquakesDatabaseparameters(Daniell,2003‐2011a) 4
Figure3–Thelocationofthe133+CATDATdamagingearthquakesinvariouscountriesduring
2011 5
Figure4–Thenumberofearthquakespercountryinthe133+CATDATdamagingearthquakesin
variouscountriesduring2011 6
Figure5–Thefatalearthquakesin2011intheCATDATDamagingEarthquakesDatabase. 7
Figure6–Thecasualtybearingearthquakesin2011intheCATDATDamagingEarthquakes
Database. 8
Figure7–Thenumberofbuildingsdamagedordestroyedineach2011CATDATdamaging
earthquake 11
Figure8–Therelativebuildingdamageindexineach2011CATDATdamagingearthquake 12
Figure9–Thenumberofhomelesspeopleineach2011CATDATdamagingearthquake 12
Figure10–Thedirecteconomiclossesineach2011CATDATdamagingearthquake 16
Figure11–Theinsuredeconomiclossesineach2011CATDATdamagingearthquake 19
Figure12–YearlyDirectEconomicLossesfromCATDATDa maging Earthquakesshowing2011as
thehighestlossyearofthepast111years 22
Figure13–YearlyTotalEconomicLossesfromCATDATDamagingEarthquakesshowing2011as
thehighestlossyearofthepast111years 23
Figure14–YearlyEarthquakeandSecondaryEffectdeathsinCATDATfordevelopingand
developednationsthroughtime–2011showsthelargestdeathtollfromadevelopednation
(HDI(2011)>0.8) 23
Figure15–MajoreventlossesintheCATDATdamagingearthquakesdatabasefrom1900‐2011
(Daniell,2003‐2011a) 24
Figure16–Cumulativedeathsandeconomiclossesrelatedtoglobal2011‐dollarGDP(PPP)and
population. 24
ListofTables
v
LISTOFTABLES
Page
Table1–Listofcasualty‐bearingearthquakesin2011 8
Table2–Listofhomeless‐bearingearthquakesin2011 13
Table3–Finallossestimatesforthe2011TohokuEQdisaggregatedfortsunami,powerplantand
earthquakeusingJapaneseandCATDATdataasof18
th
October 15
Table4–Listofeconomiclossesinearthquakesin2011withover$5millionUSDorothernotable
losses(excludingnucleardisasters) 17
Table5–Listofinsuredlossesinearthquakesin2011sofarover$1m 19
Table6–Listofhighestinsuredlosses(1900‐2011)in2011CountryCPIadjusted$international.20
Table7–AcomparisonoftheChristchurchandTohokuearthquakesintermsofnumbers 21
CATDATDamagingEarthquakesDatabase–2011–TheYearinReview
1
1 Introduction
2011has played host tothe largest twoearthquakes, economically speaking, in the history of the
countriesofJapanandNewZealand.TheM9.0Tohokuearthquakeandtsunamiof11
th
March,2011
provedto be themostexpensive earthquakeofalltime, causingbetween $400‐700billionUSDin
totallossesandapproximately19000deaths,whiletheChristchurchearthquake(aM6.3quakeclose
tothecityofChristchurch)causedahugebuildingstocklossandapproximately$15‐20billionUSD
damage with around 80% insured losses. Their respective aftershocks caused further damage.
SignificantlosseswerealsoseeninTurkeyfromtheVanearthquakeinOctober,intheIndia‐Nepal‐
Tibet region in September, in China from numerous earthquakes in the Yunnan and Xinjiang
ProvincesandintheUSAfromtheVirginia
earthquake.
Inaddition,inthefirsthalfof2011,thenewscameoutthatthedeathtollinHaitiwasoverestimated
significantly.AreportfromaUS‐basedconsultancygroup,LTLStrategies,aspartofaUSAIDreport,
showedthatthedeathtollwasbetween46190and84961.Daniellet
al.(2010f,2011j)usingvarious
approaches concluded that a death toll of 136933
, with a range of 121843 to 167082 dead, was
reasonable. Both of these totals are a massive reduction on the 316000 deaths quoted by the
Presidenton12
th
January,2011.
2011DamagingEarthquakesinNumbers
NumberofCATDATDamagingEarthquakes: 133+.
NumberofCasualty‐bearingEarthquakes: 61+withatleast25fatal.
CountrywiththemostCATDATDamagingEarthquakes: Japan,27;China,20;Turkey,18.
TotalFatalities:Between20086and20475.
TotalShakingFatalities:±1336.
TotalInjuries:±14629.
TotalHomeless:±1.108million.
TotalEconomicLosses:$503.39billion‐$749.51billionUS
(Median=$623.50billionUS)
TotalEconomicLosses(excludingFukushimaNuclear): $394.39billion‐$587.51billionUS
(Median=$488.00billionUS)
TotalEconomicLosses(excludingTohoku): $24.39billion‐$39.51billionUS
(Median=$29.00billionUS)
TotalInsuredLosses:$43.26billion‐$67.48billionUS
(Median=$52.80billionUS)
Pleasenotethatforthepurposesofthisreportduetodifferentmeaningsofbillionandmillionworldwide:
1billion=1,000,000,000or10
9
1million=1,000,000or10
6
Finallossestimatesforthe2011TohokuEQdisaggregatedfortsunami,powerplantandearthquake‐JapaneseandCATDATdata
InBillionUSD Earthquake Tsunami Powerplant
DirectLossInland 77 0
DirectLossCoastal 48‐81 112‐145
58‐71
TotalDirectLoss 125‐158(42%) 112‐145(39%) 58‐71(19%)
IndirectLoss 69‐132 64‐113 51‐91
TotalEconomicLoss 194‐290(41%) 176‐258(36%) 109‐162(23%)
CATDATDamagingEarthquakesDatabase–2011–TheYearinReview
2
2 WhatisCATDAT?
CATDAToriginatedasaseries ofdatabasesthathasbeencollectedbytheauthorfrommanysources
over the years(2003 onwards). Itincludes global data onfloods, volcanoes and earthquakes (and
associatedeffects).Thisreportwillfocusonthedamagingearthquakes in2011,anda comparisonas
providedbythe
DamagingEarthquakesDatabasepartofCATDAT.Thisdatabasehas beenpresented
attheAustralianEarthquake EngineeringSocietyConferencein2010inPerth,Australia, intheform
of3papers,andthedatawasalsousedtoformanAsia‐Pacificcomparisonoffloodandearthquak e
socio‐economic loss in the
CECAR5 conference in Sydney, Australia, 2010. The details of the
database can be found by typing “CATDAT Damaging Earthquakes Database” into Google and
searchingfortheDanielletal.(2011)paperinthejournal,NHESS.
As of January 2012 in CATDAT v5.0328, over 19000 sources of information have been utilised to
presentdatafromover 12300historical damaging earthquakes,with over7000 earthquakes since
1900examinedandvalidatedbeforeinsertionintotheCATDATdamagingearthquakesdatabase.
Figure1‐TheprocessusedtocreatetheCATDATDamagingEarthquakesDatabase(Daniell,2011)
2.1 Whatiscontainedinthedatabase?
Eachvalidatedearthquakeincludesthefollowingparametersfilledintothebestavailabledetail:‐
• Date(Day,Month,Year,Time(LocalandUTC)).
• SeismologicalInformation(EQHypocentreLatitude;Longitude;Depth(km);Intensity(MMI);
Magnitude;Magnitudetype)
• ISO3166‐2Countrycode,includingKosovoandSouthSudan;ISOCountryName.
•
Human Development Index of country; HDI Classification; Economic Classification; Social
Classification;UrbanityIndex;Populationattimeofevent;NominalGDPattimeofevent–
splitintodevelopedordevelopingcountries.
CATDATDamagingEarthquakesDatabase–2011–TheYearinReview
3
• CATDATPreferred(BestEstimate)Deaths;Secondar y EffectDeaths;GroundShakingDeaths;
CATDAT Upper and Lower Bound Death Estimates; Global Literature Source Upper and
Lower Bound Death Estimates; Severe Injuries; Slight Injuries; CATDAT Upper and Lower
Bound Injury Estimates; Glo bal Source Upper and Lower (U/L) Bound Injury Estimates;
Homeless(andU/L
Bound);Affected(andU/LBound);Missing.
• Buildings destroyed; Buildings damaged;Buildings damaged – L4, L3, L2, L1;Infrastructure
Damaged;CriticalandLargeLossFacilities;Lifelinesdamaged.
• Secondary effects that occurred (Tsunami,Seiche, Landslide (mud, snow, rock, soil, quake
lake),Fire,Liquefaction,Flooding,FaultRupture);%ofthesocial
lossesthatwerecausedby
each secondary effect; % of economic losses that were caused by each secondary effect;
TsunamiDeaths;LandslideDeaths;FireDeaths;LiquefactionDeaths.
• Diseaseandadditionallong‐termproblems.
• Full word description of various sources contributing to the data, including associated
references.
• Sectoraland
indirectanalysisofeconomiclosses.
• Country‐based CPI at time of disaster; Country‐based Wage Index at time of disaster;
Country‐based GDP Index; USA CPI for comparison; Hybrid Natural Disaster Economic
ConversionIndex.
• CATDAT Preferred (Best Estimate) Total Economic Loss; CATDAT U/L Bound of Economic
Loss;Global
SourceU/LBoundofEconomicLoss;AdditionalEconomicLossestimatesfrom
varying sources; CATDAT Economic Loss 2011 HNDECI‐Adjusted; CATDAT Economic Loss
2011‐countrybasedCPIadjusted.
• Insured Loss; Insured Loss In 2011 dollars; Insured estimate source; Estimated Insurance
Takeout(orapprox.takeout)attimeofevent.
• Indirectand
Intangibleeconomiclosses.
• Estimatedlif ecostgivensocialvalues,workingwagesetc.atthetime.
• TotalEconomicLossasapercentageofcountry’sGDP;Sociallossestrendedbypopulation.
• CATDATEarthquakesrankedviatheMunichNatCatServicemethodology.
• CATDATEarthquakesrankedfortheCATDATEconomicDisaster
RankingandCATDATSocial
DisasterRankingbasedonrelativevaluesandnotabsolutevalues.
• LinktoReliefWebarchivewhereavailable.
• Aidcontribution;Aiddelivered;AidSource.
• Split country impacts (social and economic) where earthquake has affected more than 1
country.
• Variousratiosbetweencomponentsfortrendsanalysis.
• Normalisationstrategiesforcurrentconditions.(Danielletal.,2010g)
• Linkstotheauthor’sglobalrapidlossestimationmodel(partofhisPhD).
CATDATDamagingEarthquakesDatabase–2011–TheYearinReview
4
Figure2–TheCATDATDamagingEarthquakesDatabaseparameters(Daniell,2003‐2011a)
ThisiscontainedinaMicrosoftExcelframeworkwithexternallinkstootherresources.Itisalsoin
SQLformat.
2.2 Entrycriteria
Adamagingearthquakeis enteredintotheCATDATdatabasebythefollowingcriteriainv.5.03:‐
• Anyearthquakecausingcollapseofstructuralcomponents.
• Anyearthquakecausingdeath,injuryorhomelessness.
• Anyearthquake causingdamageorflow‐oneffectsexceeding100,000internationaldollars,
HybridNaturalDisasterEconomicConversionIndex
adjustedto2011.
• Any earthquake causing disruption to a reasonable economic or social impact as deemed
appropriate.
• A requirement of validation of the earthquake existence via 2 or more macroseismic
recordings and/or seismological information recorded by stations and at least 1 of the 4
definitionsabove.
• Validation
viaexternalsourcesifCorruptionIndex<2.7,subjecttoPolityranking.
CATDATDamagingEarthquakesDatabase–2011–TheYearinReview
5
3 DamagingEarthquakesfrom2011intheCATDATDamagingEQDatabase
3.1 WherehavetheCATDATdamagingearthquakesoccurred?
Therehavebeenatleast133damagingearthquakesin2011.Thesehaveoccurredinthefollowing
countries,asshownin thediagrambelow.Notethateventsneedtocorrespondtothecriteriaset
outinthesectionabove.ItwasseenthattheCreteearthquakeofM6.2,withminorcardamage
in
Iraklionandminornon‐structuralhousedamagecausedlessthanthecriterianeededtobeclassified
as a “CATDAT Damaging Earthquake”. There were many other “nearly” CATDAT damaging
earthquakesduring the year that are all reported on earthquake‐report.com before CATDAT
ranking.
Figure3–Thelocationofthe133+CATDATdamagingearthquakesinvariouscountriesduring2011
There have been 27 damaging earthquakes in Japan, mainly aftershocks as a result of the 11th
March Tohoku earthquake, 20 damaging earthquakes in China (up from 15 last year) that are
classified under the CATDAT criteria, 18 damaging earthquakes in Turkey and 17 damaging
earthquakes in New Zealand (mainly in Christchurch
and as aftershocks of the 21st February
earthquake).
CATDATDamagingEarthquakesDatabase–2011–TheYearinReview
6
Figure 4 – The number of earthquakes per country in the 133+ CATDAT damaging earthquakes in various
countriesduring2011
CATDATDamagingEarthquakesDatabase–2011–TheYearinReview
7
3.2 Casualty‐bearing2011earthquakes
Therehavebeenatleast25fatalearthquakesin2011.Theseareshownonthefollowingdiagram.
Figure5–Thefatalearthquakesin2011intheCATDATDamagingEarthquakesDatabase.
The most fatalities from an earthquake in 2011 were in the Japanese tsunami where over 19000
peoplewerekilled.However,mostofthesefatalitieswereduetothetsunamiwhichwasaresultof
the earthquake. It is unknown how many victims have died directly due to earthquake shaking
action. As
was reported by earthquake‐report.com from NPA back in April about the first 13135
victims, 92.5% were drowned (12143), 4.4% were crushed to death mainly in tsunami collapsed
houses(578),1.1%wereburnedto deathinvariousfires(148),withotherskilledvia hypothermia
andothercauses.Itwillnever
beknownhowmanydiedduetotheearthquake,asseparatedfrom
thetsunami;however,theautopsiesgiveusanindicatorthatwecanexpectthatabout1.0%ofthe
4.4%crushedwereprobablyinearthquakecollapsedhouses.
In addition, we can assume a proportion of the remaining 2% that were
unknown were also
earthquake‐related(ahighvalueof10%couldbeassumed).Thiswouldleaveabout1.2%orabout
158.Whenextrapolatingforthefinal6000 deathsthatwerenotstressorchronicdiseaserelated,
then the total is about 210. This value corresponds quite well to the 137
non‐tsunami impacted
deathsthathavebeenrecordedinthenon‐coastalareas.Someofthenon‐coastaldeaths,however,
wereduetoheartattack,fireorlandslide.
Asof1
st
Janu ary 2012,15844havebeenkilledand3451aremissing(19295intotal).Ofthe19295,
around 600 are assumed to have died from earthquake‐related stress and chronic disease.
Approximately 210 should be earthquake‐collapse related. Around 250 could be related to other
causessuchasfire,landslidesetc.
About94%ofdeathsweretsunamirelated.
Inaddition,atleast36otherinjury‐bear ingearthquakeshaveoccurredintheworld,makingatotal
of61knowncasualty‐bearingearthquakesfor2011.
CATDATDamagingEarthquakesDatabase–2011–TheYearinReview
8
Figure6–Thecasualtybearingearthquakesin2011intheCATDATDamagingEarthquakesDatabase.
The Van earthquakes in Turkey in October and November caused 604 deaths and 40 deaths
respectively.Mostofthesewereduetobuildingcollapse,thuscausingthelargestproportionofthe
1335 shaking‐related fatalities for the year.Christchurch with 181 deaths, mainly due to the
collapseof3reinforcedconcrete
buildings,alsowasalargeevent.
Table1–Listofcasualty‐bearingearthquakesin2011
EQName Cnt.ISO Date
BestEstimateof
Fatalities
Rangeof
Fatalities
Heavy
Injuries
Injuriesor
Slight
Injuries
Haiti ZU 12.01.2010 137000(6‐T)
(46000‐
164000)
310928
Tohoku,Sendai,
GreatEastern
JP,US,ID,
EC,PE,CL
11.03.2011
19295‐JP(18235‐T,210‐
SHK,250‐F,600‐OTH),1‐
ID,1‐US
(19000‐
19295)
5652
VanandErcis TR 23.10.2011 604(2‐HA) (604‐604) 4152
Christchurch NZ 21.02.2011 181(10‐L) (181‐185) 164 2000
Myanmar
MM,TH,
LA,CN
24.03.2011 151(10‐L) (75‐151) 212
Sikkim
IN,NP,
CN,BT,
BD
18.09.2011
111(97‐IN,7‐CN,6‐NP,
1‐BD)(some‐L)
(111‐111) many
VanAftershock TR 09.11.2011 40 (40‐40) 260
Yingjiang CN 10.03.2011 26 (26‐26) 134 180
CentralAsia
ZU,KG,
TJ
19.07.2011 14(1‐HA) (14‐14) 35 66
Lorca ES 11.05.2011 9 (9‐10) 3 400
SendaiAftershock JP 07.04.2011 4 (2‐4) 28 268
Guatemala GT 19.09.2011 4(3‐L) (1‐4) 103
EasternHonshu
Aftershock
JP 11.04.2011 4(3‐L) (3‐7) 3 7
SimavKutahya TR 19.05.2011 3(2‐HA) (2‐3) 1 121
SWPakistan PK 18.01.2011 3(2‐HA) (3‐3) 9 0
Singkil ID 05.09.2011 3(2‐HA) (3‐3) 0 0
Guerrero MX 11.12.2011 2 (2‐2) 0 4
CATDATDamagingEarthquakesDatabase–2011–TheYearinReview
9
Kahnuj IR 15.06.2011 2 (2‐2) 0 0
SendaiAftershock JP 11.03.2011 1 (1‐1) 0
inc.11/03
Toh.
MiyagiAftershock JP 11.03.2011 1 (1‐1) 0
inc.11/03
Toh.
Ica PE 28.10.2011 1(1‐L) (1‐1) 16 88
Myanmar MM,IN 04.02.2011 1 (1‐1) unk. Unk.
10kmSEof
Christchurch
NZ 13.06.2011 1(1‐HA) (1‐1) 0 45
SJava ID 03.04.2011 1(1‐HA) (1‐1) 0 0
TamilNadu IN 12.08.2011 1 (1‐1) 0 0
Papua ID 26.06.2011 1 (1‐1) 0 0
20kmNELyttleton
Aftershock
NZ 23.12.2011 0 (0‐0) 0 inc.23/12
Nagano
Aftershock
JP 11.03.2011 0 (0‐0) 0
inc.11/03
Nag.
Nagano
Aftershock2
JP 11.03.2011 0 (0‐0) 0
inc.11/03
Nag.
PahaeJaeDistrict ID 14.06.2011 0 (0‐0) 0 130
Bali ID 13.10.2011 0 (0‐0) 4 86
10kmE
Christchurch
Aftershock
NZ 23.12.2011 0 (0‐0) 0 60
Nagano JP 11.03.2011 0 (0‐0) 1 56
Fujiyama JP 15.03.2011 0 (0‐0) 3 51
SasanGir,
Junagadh
IN 20.10.2011 0 (0‐0) 6 34
Mamasani IR 05.01.2011 0 (0‐0) 22 15
Mindinao PH 07.11.2011 0 (0‐0) 10 21
Christchurch
Aftershock1
NZ 22.02.2011 0 (0‐0) 10 20
AtushiCity CN 11.08.2011 0 (0‐0) 4 17
Haiti ZU 24.06.2011 0 (0‐0) 0 20
Matsumoto JP 29.06.2011 0 (0‐0) 2 13
Sulawesi ID 24.04.2011 0 (0‐0) 1 13
SurugaBay JP 01.08.2011 0 (0‐0) 2 11
Kawauchi JP 30.07.2011 0 (0‐0) 0 11
ToksunCounty CN 08.06.2011 0 (0‐0) 0 7
TengchongCounty CN 20.06.2011 0 (0‐0) 3 3
TengchongCounty
2
CN 09.08.2011 0 (0‐0) 2 4
SouthernIbaraki
Prefecture
JP 16.04.2011 0 (0‐0) 0 6
Virginia US 23.08.2011 0 (0‐0) 0 5
LuhuoCounty CN 10.04.2011 0 (0‐0) 1 3
Christchurch
Aftershock2
NZ 22.02.2011 0 (0‐0) 1 2
SasanGir,
Junagadh
IN 12.11.2011 0 (0‐0) 0 3
Honshu JP 09.03.2011 0 (0‐0) 0 2
EasternHonshu
Aftershock
JP 12.04.2011 0 (0‐0) 0 2
Elazig TR 23.06.2011 0 (0‐0) 0 2
MiyagiAftershock JP 19.08.2011 0 (0‐0) 0 2
Oklahoma US 06.11.2011 0 (0‐0) 0 2
CATDATDamagingEarthquakesDatabase–2011–TheYearinReview
10
GifuPrefecture JP 14.12.2011 0 (0‐0) 1 0
Yangjiang1 CN 01.01.2011 0 (0‐0) 0 1
Yangjiang3 CN 01.02.2011 0 (0‐0) 0 1
Akita JP 01.04.2011 0 (0‐0) 0 1
Ibaraki JP 20.11.2011 0 (0‐0) 0 1
CATDATDamagingEarthquakesDatabase–2011–TheYearinReview
11
3.3 2011earthquakeswithover100peoplehomelessorrequiringshelter
TheearthquakeswhichimpactedthemostpeopleweretheTohokuearthquake/tsunami,theSikkim
earthquakeintheIndia/Nepal/China/Bhutan/BangladeshregionandtheearthquakeinVan,Turkey.
Althoughgenerally linkedtocasualties,somemajorearthquakeshaveveryfewcasualties,yethigh
numbers of respective homeless.For earthquakes with smaller numbers of homeless people,
estimates
arenotusuallyprovidedandneedtobecalculatedbyredtaggedbuildings,withalowest
estimate being those people living in destroyed buildings. A number of earthquakes in 2011 had
unknownhomelesslevels.
Thenumberofbuildingsdamagedordestroyedineachofthe133damagingearthquakesisshown
inthefollowingdiagram.Over1,000,000buildingsweredamagedintheJapanearthquake/tsunami.
Figure7–Thenumberofbuildingsdamagedordestroyedineach2011CATDATdamagingearthquake
Alsoshownistherelativeextentofbuildingdamageincludingdestroyedbuildings,asaratioof0.85
anddamagedbuildingswith0.15.ThisshowstheVan,Sikkim,ChristchurchandJapanearthquakes
ashavingthegreatestextentofdamagethisyear.
CATDATDamagingEarthquakesDatabase–2011–TheYearinReview
12
Figure8–Therelativebuildingdamageindexineach2011CATDATdamagingearthquake
The Japan earthquake caused the most homeless in 2011 with somewhere between 300000 and
550000 people homeless at some point in the disaster. Many moved into other forms of
accommodation. Although the casualty toll was not high in Turkey, the calculated number of
homelesswasabout270000,exacerbatedbywinterweather
conditionsandthelowdevelopmentof
theregion.TheSikkimearthquakealsocausedjustunder100000homeless.Othermajorhomeless
tollswereseeninsomeChineseearth quakes.Thenumberofhomelessineachdamagingearthquake
aresummarisedinthefollowingdiagram.
Figure9–Thenumberofhomelesspeopleineach2011CATDATdamagingearthquake
CATDATDamagingEarthquakesDatabase–2011–TheYearinReview
13
Althoughtheoveralldamagewasmuchreducedbygoodearthqu akebuildingpractice inNZ,dueto
thered taglevelastheresultofliquefactionandhigherpost‐earthquakestandardsinNewZealand
than in many other countries, the Christchurch, N.Z., earthquake has a large number of people
displaced.Mosthave
movedinwithfriendsandfamily,orhavemoved;however,theystillcountas
displacedfromtheirpre‐earthquakestate.6592propertiesarecurrentlyredzonedbyCERA.
Table2–Listofhomeless‐bearingearthquakesin2011
EQName Cnt.ISO Date HomelessRange AffectedRange
Haiti HT 12.01.2010
1850000
(1000000‐2100000)
3200000
(3000000‐4500000)
Tohoku,Sendai,Great
Eastern
JP,US,ID,
EC,PE,CL
11.03.2011
450000(300000‐
550000)
20million+
VanandErcis TR 23.10.2011
272157(200000‐
320000)
1000000
Sikkim
IN,NP,
CN,BT,BD
18.09.2011 85000(70000‐100000) 2000000
Yingjiang CN 10.03.2011 72460 344600
Yangjiang1 CN 01.01.2011 54000 148000
Christchurch NZ 21.02.2011 40000 350000
Mamasani IR 05.01.2011 35000 Complex:RefertoCATDAT
Nilka,Xinjiang CN 01.11.2011 20800 450000
VanEdremit TR 09.11.2011 20000(inc.In23/10) Complex:RefertoCATDAT
Myanmar
MM,TH,
LA,CN
24.03.2011 13000 18000
SimavKutahya TR 19.05.2011 10000 41000
Lorca ES 11.05.2011 5000 150000
AtushiCity CN 11.08.2011 5000 45000
ZhaotongCity CN 12.02.2011 4000 19500
Anqing CN 19.01.2011 3635 37400
CentralAsia ZU,KG,TJ 19.07.2011 3500 Complex:RefertoCATDAT
Ica PE 28.10.2011 2801 13244
PahaeJaeDistrict ID 14.06.2011 2000 18000
LuhuoCounty CN 10.04.2011 1850 29940
ShacheCounty CN 01.12.2011 1450 72576
Yangjiang3 CN 01.02.2011 1000 80600
10kmSEofChristchurch NZ 13.06.2011 1000 Complex:RefertoCATDAT
TengchongCounty2 CN 09.08.2011 1000 180000
10kmEChristchurch
Aftershock
NZ 23.12.2011 1000 Complex:RefertoCATDAT
NangqianCounty CN 26.06.2011 700 79824
Singkil ID 05.09.2011 600 Complex:RefertoCATDAT
SasanGir,Junagadh IN 20.10.2011 600 Complex:RefertoCATDAT
Papua ID 26.06.2011 256 Complex:RefertoCATDAT
SantaRosaSwarm19/07‐
27/08
GT 20.07.2011 250 Complex:RefertoCATDAT
TengchongCounty CN 20.06.2011 200 22000
ToksunCounty CN 08.06.2011 168+ 16174
Mindinao PH 07.11.2011 150 1014
Ruichang,Jiangxi CN 10.09.2011 120 5800
EasternHonshuAftershock JP 11.04.2011 many Complex:RefertoCATDAT
CATDATDamagingEarthquakesDatabase–2011–TheYearinReview
14
EasternHonshuAftershock JP 12.04.2011 many Complex:RefertoCATDAT
SendaiAftershock JP 07.04.2011 some 700000
Elazig TR 23.06.2011 some Complex:RefertoCATDAT
Oklahoma US 06.11.2011 100 Complex:RefertoCATDAT
Yangjiang2 CN 01.01.2011 inc01/01 inc01/01
Guatemala GT 19.09.2011 70 2500
CostaRica CR 12.07.2011 50 Complex:RefertoCATDAT
Huehuetenango GT 29.12.2011 15 125
CATDATDamagingEarthquakesDatabase–2011–TheYearinReview
15
3.4 EconomicLossesfromearthquakesin2011over$5millionUS
Economic losses from earthquakes in 2011 have been dominated by the Tohoku earthquake,
tsunami and nuclear disaster.The combination of these direct losses with the predicted indirect
lossestobeborneoverthenextfewyearshasbeencalculatedtobearound$594billionUS,witha
range of between $479
billion US and $710 billion US. Of these, direct losses will reach between
$294billionUSand$374billionUS.
Approximately70%ofthecapitalstockisinlandascomparedtoaround30%ofthecapital stockon
the coast in the provinces of Miyagi, Iwate, Fukushima and Ibaraki, according
to the Japanese
CabinetOffice.Extrapolatingthedamageinotherprefectures,theJapaneseCabinetOfficeestimate
should be about $231 billion once $23 billion loss in other prefectures is added. In addition, the
estimate of the Miyagi Prefecture of incurred direct losses (incomplete as of 17/10/2011) is 11%
greaterthanthe
originalCabinetestimate.Withcurrencychangesandthisincrease,thedirectloss
estimate at this point from the Japanese government appears to be $271 billion (without the
additional$58‐71billionexpectedfromFukushima)(Danielletal.,2011b).
Inthecaseofthe2011Tohokuearthqu akeandtsunami,itis
difficulttoknowthefinaldiscretisation
ofearthquakeandtsunamilosses;however,thepossibleoutcome isabout39%economiclossesdue
totsunami($127billion)and43%duetotheearthquake($144billion),withabout18%duetothe
Fukushimadisaster($59billion).ThedatafromMiyagiprefecturehasshownthese
percentagesto
be realistic. On the other hand, approximately 94.5% of the deaths are expected to be tsunami
related,withonlyasmallpercentage(1.2%)expectedduetoearthquakeshaking.DirectLossesare
in the order of $335 billion, with indirect losses around $260 billion expected with all impacts
combined
(Danielletal.,2011b).
Table 3 – Final loss estimates for the 2011 Tohoku EQ disaggregated for tsunami, powerplant and
earthquakeusingJapaneseandCATDATdataasof18
th
October
InBillionUSD Earthquake Tsunami Powerplant
DirectLossInland 77 0
DirectLossCoastal 48‐81 112‐145
58‐71
TotalDirectLoss 125‐158(42%) 112‐145(39%) 58‐71(19%)
IndirectLoss 69‐132 64‐113 51‐91
TotalEconomicLoss 194‐290(41%) 176‐258(36%) 109‐162(23%)
TheChristchurchearthquakesonthe21
st
February,13
th
Juneand23
rd
Decemberalsohadsignificant
economiclossestotallingwellover$20billionUS.Asa%ofGDP,thisearthquakecausedthehighest
lossesin2011. Muchof thisdamage canbedeemed tohavebeencaused byliquefaction, withat
least10000homesexpectedtobedeemedtobeon
unliveableland.
TheSikkimearthquakeonthe18
th
September2011wasdeemedtohavecausedatleast1lakhcrore
rupees (1000 billion rupees or $22.3 billion US) damage in Sikkim, as estimated early after the
disaster(SikkimMinistryon21
st
September2011).However,asthenetcapitalstockisatthemost
approximately$3.9billionUS(about200billionrupees)inSikkimaccordingtoCATDAT,itishardto
believetheinitialassessmentoftheministry;thusthisvaluehasbeenignored.
However,amorereliableestimateisapproximately$1.7
billionUSdamagefortotaldamageinIndia.
Inadditionabout$200millionUSdamagewascausedinTibet(China),andslightlyhigherineastern
CATDATDamagingEarthquakesDatabase–2011–TheYearinReview
16
Nepal. As well, losses in Bhutan occurred with around 6000 buildings damaged. In total, an
estimated$2.25billionUSdamageoccurred.
Althoughnotcausingahighabsolutevalueofdamage,theVanearthquakeinTurkeycausedalarge
impact on the Van Province. The Van Province GDP can be assumed to
be around 3.3 billion USD
(2011).Generallysuch disastershavetakenabout15‐33%ofprovincialGDPinthepast,andusinga
factor system to calculate this in the Van Province, around 550 million‐1.25 billion USD is a
reasonableestimate.Outlierestimatessuggestahigherrangeofup
to2.2billionUSD.Vanisoneof
the poorest regions of Turkey. In the rural areas, sheep and cattle farming is a common form of
income.
The Nagano earthquake of 11
th
March, Fujiyama earthquake of 15
th
March and the Tohoku
aftershockonthe7
th
Aprilalsocausedsignificantlosses.
The damaging earthquakes of China were dominated by the economic losses from the Yingjiang
earthquakeof$407millionUS(2.687billionCNYor26.87・
元).
In total, 59 earthquakes recorded losses in excess of $5m USD in 2011, as compared to 33
earthquakesin2010.Manyoftheserecordedlosseswerecausedbyaftershocks inChristchurchand
Tohoku.Showninthefollowingdiagramarethelossesofearthquakesin2011.
Figure10–Thedirecteconomiclossesineach2011CATDATdamagingearthquake
CATDATDamagingEarthquakesDatabase–2011–TheYearinReview
17
Thenexttableshowsthelossrangeofthemajoreconomiclosseventsin2011.
Table 4 – List of economic losses in earthquakes in 2011 with over $5 million USD or other notable losses
(excludingnucleardisasters)
Earthquake CountryISO DateUTC TotalLossRange(USD)
GDP
(PPP)
(%)
Maule CL 27.02.2010
$30000m($27500m‐$32500m)Total,
$24200mDirect
10.86
Tohoku,Sendai,GreatEastern
EarthquakeandTsunami
JP,US,ID,EC,
PE,CL
11.03.2011
$411000m($370000m‐$548000m)Total
$270300m($237000m‐$303000m)
Direct
8.76
Christchurch NZ 21.02.2011 $16000.00m($15000.00m‐$20000.00m) 12.95
10kmSEofChristchurch NZ 13.06.2011 $3000.00m($2500.00m‐$4830.00m) 2.43
Sikkim
IN,NP,CN,BT,
BD
18.09.2011 $2260.00m($1400.00m‐$2700.00m) <0.1
SendaiAftershock JP 07.04.2011 $2000.00m($1500.00m‐$3000.00m) <0.1
VanandErcis TR 23.10.2011 $1100.00m($550.00m‐$2000.00m) <0.1
Nagano JP 11.03.2011 $1000.00m($500.00m‐$1500.00m) <0.1
Fujiyama JP 15.03.2011 $1000.00m($700.00m‐$2000.00m) <0.1
Yingjiang CN 10.03.2011 $408.67m($408.67m‐$408.67m) <0.1
Matsumoto JP 29.06.2011 $300.00m($200.00m‐$500.00m) <0.1
10kmEChristchurchAftershock NZ 23.12.2011 $300.00m($250.00m‐$500.00m) 0.24
SimavKutahya TR 19.05.2011 $260.00m($260.00m‐$260.00m) <0.1
Virginia US 23.08.2011 $250.00m($200.00m‐$300.00m) <0.1
Myanmar MM,TH,LA,CN 24.03.2011 $120.45m($120.45m‐$120.45m) 0.15
Nilka,Xinjiang CN 01.11.2011 $106.67m($106.67m‐$106.67m) <0.1
Lorca ES 11.05.2011 $90.00m($90.00m‐$215.00m) <0.1
VanEdremit TR 09.11.2011 $75.00m($55.00m‐$100.00m) <0.1
ChristchurchAftershock1 NZ 22.02.2011 $50.00m($35.00m‐$100.00m) <0.1
10kmEofChristchurch NZ 13.06.2011 $50.00m($50.00m‐$50.00m) <0.1
Oklahoma US 06.11.2011 $50.00m($15.00m‐$75.00m) <0.1
TengchongCounty CN 20.06.2011 $43.00m($43.00m‐$43.00m) <0.1
Anqing CN 19.01.2011 $35.87m($35.87m‐$35.87m) <0.1
LorcaForeshock ES 11.05.2011 $35.00m($35.00m‐$35.00m) <0.1
10kmNEDiamondHarbour
Aftershock
NZ 16.04.2011 $30.00m($7.00m‐$40.00m) <0.1
20kmNELyttletonAftershock NZ 23.12.2011 $30.00m($20.00m‐$50.00m) <0.1
AtushiCity CN 11.08.2011 $28.53m($28.53m‐$28.53m) <0.1
10kmSWofChristchurch NZ 19.01.2011 $25.98m($17.32m‐$34.64m) <0.1
ChristchurchAftershock2 NZ 22.02.2011 $25.00m($25.00m‐$25.00m) <0.1
CentralAsia ZU,KG,TJ 19.07.2011 $25.00m($20.00m‐$30.00m) <0.1
LuhuoCounty CN 10.04.2011 $24.69m($24.69m‐$24.69m) <0.1
Ica PE 28.10.2011 $24.48m($12.24m‐$48.95m) <0.1
TengchongCounty2 CN 09.08.2011 $23.35m($23.35m‐$23.35m) <0.1
20kmSWofChristchurch NZ 04.02.2011 $21.38m($14.25m‐$28.50m) <0.1
Kecsked HU 29.01.2011 $15.00m($5.00m‐$15.00m) <0.1
Hornby NZ 21.06.2011 $15.00m($12.00m‐$25.00m) <0.1
ToksunCounty CN 08.06.2011 $14.23m($14.23m‐$14.23m) <0.1
ChristchurchAftershock NZ 09.10.2011 $13.00m($10.00m‐$18.00m) <0.1
Ruichang,Jiangxi CN 10.09.2011 $12.25m($12.25m‐$12.25m) <0.1
NangqianCounty CN 26.06.2011 $10.04m($10.04m‐$10.04m) <0.1
10kmEChristchurchAftershock NZ 20.03.2011 $10.00m($5.00m‐$25.00m) <0.1
CATDATDamagingEarthquakesDatabase–2011–TheYearinReview
18
Singkil ID 05.09.2011 $9.38m($5.86m‐$9.38m) <0.1
ZhaotongCity CN 12.02.2011 $8.51m($8.51m‐$8.51m) <0.1
ShacheCounty CN 01.12.2011 $7.64m($7.64m‐$7.64m) <0.1
Elazig TR 23.06.2011 $7.60m($1.69m‐$10.14m) <0.1
Yangjiang1 CN 01.01.2011 $7.54m($7.54m‐$7.54m) <0.1
VanAftershock TR 08.11.2011 $6.57m($1.46m‐$8.76m) <0.1
20kmSWofChristchurch NZ 05.06.2011 $6.00m($3.00m‐$11.00m) <0.1
Guerrero MX 11.12.2011 $5.20m($2.40m‐$12.00m) <0.1
Gifu JP 26.02.2011 $5.00m($5.00m‐$5.00m) <0.1
Canterbury NZ 10.05.2011 $5.00m($2.00m‐$10.00m) <0.1
CookStrait NZ 03.12.2011 $5.00m($2.00m‐$10.00m) <0.1
AmurskayaOblast,Russia RU 14.10.2011 $5.00m($2.00m‐$10.00m) <0.1
SendaiAftershock JP 11.03.2011 inc.11/3Tohoku <0.1
MiyagiAftershock JP 11.03.2011 inc.11/3Tohoku <0.1
NaganoAftershock JP 11.03.2011 inc.11/3Nagano <0.1
NaganoAftershock2 JP 11.03.2011 inc.11/3Nagano <0.1
VanAftershock1 TR 23.10.2011 inc.23/10Van <0.1
VanAftershock2 TR 23.10.2011 inc.23/10Van <0.1
VanAftershock3 TR 25.10.2011 inc.23/10Van <0.1
KutahyaSimavAftershock TR 27.05.2011 $3.48m($0.77m‐$4.63m) <0.1
Van/MerkezAftershock TR 15.11.2011 $3.27m($0.73m‐$4.37m) <0.1
Tcuman AR 21.02.2011 $2.50m($1.00m‐$5.00m) <0.1
Cilacap ID 03.04.2011 $2.44m($2.44m‐$2.44m) <0.1
PahaeJaeDistrict ID 14.06.2011 $2.34m($0.82m‐$2.34m) <0.1
Gansu,Sichuan CN 31.10.2011 $2.15m($2.15m‐$2.15m) <0.1
Guatemala GT 19.09.2011 $2.00m($1.50m‐$2.40m) <0.1
Myanmar MM,IN 04.02.2011 $1.10m($0.20m‐$1.50m) <0.1
Hakkari/Yuksekova TR 27.10.2011 $0.99m($0.22m‐$1.31m) <0.1
Hakkari/Cukurca TR 02.11.2011 $0.99m($0.22m‐$1.31m) <0.1
Soroako ID 15.02.2011 $0.93m($0.79m‐$1.07m) <0.1
Yunnan/SichuanBorder CN 15.04.2011 $0.91m($0.91m‐$0.91m) <0.1
Yangjiang3 CN 01.02.2011 $0.76m($0.60m‐$1.00m) <0.1
20kmNSpringfieldAftershock NZ 29.04.2011 $0.75m($0.50m‐$1.00m) <0.1
DingxiCityZhangxianMinxian CN 01.11.2011 $0.71m($0.71m‐$0.71m) <0.1
KutahyaSimavAftershock3 TR 28.05.2011 $0.62m($0.14m‐$0.83m) <0.1
Sulawesi ID 24.04.2011 $0.60m($0.50m‐$0.80m) <0.1
KutahyaSimavAftershock3 TR 03.07.2011 $0.58m($0.13m‐$0.77m) <0.1
Yangjiang2 CN 01.01.2011 $0.50m($0.50m‐$0.50m) <0.1
CoalBumpPaonia US 17.02.2011 $0.50m($0.50m‐$0.50m) <0.1
KecamatanCisarua ID 28.08.2011 $0.50m($0.20m‐$0.70m) <0.1
SantaRosaSwarm19/07‐27/08 GT 20.07.2011 $0.50m($0.30m‐$1.00m) <0.1
MarmaraDenizi TR 25.07.2011 $0.48m($0.11m‐$0.64m) <0.1
Mindinao PH 07.11.2011 $0.37m($0.37m‐$0.37m) <0.1
Bali ID 13.10.2011 $0.35m($0.35m‐$0.35m) <0.1
Bilecik/Merkez TR 11.07.2011 $0.27m($0.06m‐$0.36m) <0.1
CostaRica CR 12.07.2011 $0.25m($0.20m‐$0.40m) <0.1
EgeDenizi TR 23.04.2011 $0.20m($0.08m‐$0.25m) <0.1
Eritrea–NabroVolcano ER,ET 12.06.2011 $0.12m($0.04m‐$0.38m) <0.1
Eritrea–NabroVolcano ER,ET 17.06.2011 $0.12m($0.04m‐$0.38m) <0.1
CATDATDamagingEarthquakesDatabase–2011–TheYearinReview
19
3.5 InsuredLossesfromearthquakesin2011sofar.
The losses in the reinsura nce domain for 2011 have been the largest cumulative annual loss in
historyforearthquakes.Thiswillbeseeninthefollowingsection.
Figure11–Theinsuredeconomiclossesineach2011CATDATdamagingearthquake
Thetablebelowshowstheinsuredlossrangesforeachdamagingearthquakewithinsurancelossin
2011.Manymoredetailsareavailableonearthquake‐report.com.
Table5–Listofinsuredlossesinearthquakesin2011sofarover$1m
Earthquake CountryISO Date InsuredLossRange
Maule CL 27.02.2010 $8500m($7566m‐$12000m)
Tohoku,Sendai,GreatEastern
JP,US,ID,EC,
PE,CL
11.03.2011 $36000.00m($29400.00m‐$45000.00m)
Christchurch NZ 21.02.2011 $13000.00m($11000.00m‐$16250.00m)
10kmSEofChristchurch NZ 13.06.2011 $2340.00m($1950.00m‐$3924.38m)
Fujiyama JP 15.03.2011 $400.00m($110.00m‐$500.00m)
10kmEChristchurchAftershock NZ 23.12.2011 $243.75m($203.13m‐$406.25m)
SendaiAftershock JP 07.04.2011 $220.00m($165.00m‐$330.00m)
Nagano JP 11.03.2011 $110.00m($55.00m‐$165.00m)
Lorca ES 11.05.2011 $99.00m($99.00m‐$125.00m)
Virginia US 23.08.2011 $50.00m($50.00m‐$100.00m)
VanandErcis TR 23.10.2011 $44.00m($24.20m‐$200.00m)
ChristchurchAftershock1 NZ 22.02.2011 $40.63m($28.44m‐$81.25m)
10kmEofChristchurch NZ 13.06.2011 $40.63m($40.63m‐$40.63m)
Matsumoto JP 29.06.2011 $33.00m($22.00m‐$55.00m)
10kmNEDiamondHarbour
Aftershock
NZ 16.04.2011 $24.38m($5.69m‐$32.50m)
20kmNELyttletonAftershock NZ 23.12.2011 $24.38m($16.25m‐$40.63m)
ChristchurchAftershock2 NZ 22.02.2011 $20.31m($20.31m‐$20.31m)