COLUMN CHROMATOGRAPHY docx
Bạn đang xem bản rút gọn của tài liệu. Xem và tải ngay bản đầy đủ của tài liệu tại đây (5.2 MB, 218 trang )
COLUMN
CHROMATOGRAPHY
Edited by Dean F. Martin
and Barbara B. Martin
Column Chromatography
/>Edited by Dean F. Martin and Barbara B. Martin
Contributors
Sylwester Czaplicki, Zhang Xiaopo, Dean Frederick Martin, Yasser Moustafa, Rania Morsi, Alaíde S. Barreto, Gláucio
Diré Feliciano, Özlem Bahadır Acıkara, Gulcin Saltan Citoglu, Serkan Özbilgin, Burçin Ergene, Ana Cláudia F. Amaral
Published by InTech
Janeza Trdine 9, 51000 Rijeka, Croatia
Copyright © 2013 InTech
All chapters are Open Access distributed under the Creative Commons Attribution 3.0 license, which allows users to
download, copy and build upon published articles even for commercial purposes, as long as the author and publisher
are properly credited, which ensures maximum dissemination and a wider impact of our publications. However, users
who aim to disseminate and distribute copies of this book as a whole must not seek monetary compensation for such
service (excluded InTech representatives and agreed collaborations). After this work has been published by InTech,
authors have the right to republish it, in whole or part, in any publication of which they are the author, and to make
other personal use of the work. Any republication, referencing or personal use of the work must explicitly identify the
original source.
Notice
Statements and opinions expressed in the chapters are these of the individual contributors and not necessarily those
of the editors or publisher. No responsibility is accepted for the accuracy of information contained in the published
chapters. The publisher assumes no responsibility for any damage or injury to persons or property arising out of the
use of any materials, instructions, methods or ideas contained in the book.
Publishing Process Manager Viktorija Zgela
Technical Editor InTech DTP team
Cover InTech Design team
First published April, 2013
Printed in Croatia
A free online edition of this book is available at www.intechopen.com
Additional hard copies can be obtained from
Column Chromatography, Edited by Dean F. Martin and Barbara B. Martin
p. cm.
ISBN 978-953-51-1074-3
free online editions of InTech
Books and Journals can be found at
www.intechopen.com
Contents
Preface VII
Chapter 1 Ion Exchange Chromatography - An Overview 1
Yasser M. Moustafa and Rania E. Morsi
Chapter 2 Ion-Exchange Chromatography and Its Applications 31
Özlem Bahadir Acikara
Chapter 3 Affinity Chromatography and Importance in Drug
Discovery 59
Özlem Bahadir Acikara, Gülçin Saltan Çitoğlu, Serkan Özbilgin and
Burçin Ergene
Chapter 4 Chromatography in Bioactivity Analysis of Compounds 99
Sylwester Czaplicki
Chapter 5 Chromatographic Separations with Selected Supported
Chelating Agents 123
Dean F. Martin
Chapter 6 A General Description of Apocynaceae Iridoids
Chromatography 149
Ana Cláudia F. Amaral, Aline de S. Ramos, José Luiz P. Ferreira, Arith
R. dos Santos, Deborah Q. Falcão, Bianca O. da Silva, Debora T.
Ohana and Jefferson Rocha de A. Silva
Chapter 7 Analysis of the Presence of the Betulinic Acid in the Leaves of
Eugenia florida by Using the Technique GC/MS, GC/FID and
HPLC/DAD: A Seasonal and Quantitative Study 183
Alaíde S. Barreto, Gláucio D. Feliciano, Cláudia Cristina Hastenreiter
da Costa Nascimento, Carolina S. Luna, Bruno da Motta Lessa,
Carine F. da Silveira, Leandro da S. Barbosa, Ana C. F. Amaral and
Antônio C. Siani
Chapter 8 Natural Products from Semi–Mangrove Plants in China 193
Xiaopo Zhang
ContentsVI
Preface
As Moustafa and Morsi remind us in Chapter One, it has been just over 100 years since a Rus‐
sian botanist, M. Tswett discovered chromatography. It seems timely to review the current
status of the field of chromatography and appreciate the many improvements that have been
made in the field. To do this thoroughly, of course, would require many volumes, but within
the limits of space, the chapters that follow surely do indicate the range of techniques and
some of the important applications. It is to be hoped that careful readers will reflect on these
and consider other applications.
Accordingly, Chapters Two through Five look at different techniques of chromatography with
a consideration of applications. These include ion-exchange chromatography (Chapter Two),
the use of chromatography to characterize the bioactivity of compounds (Chapter Three), af‐
finity chromatography and the utilization in drug discovery (Chapter Four), and the use of
column chromatography with chelating agents attached to useful substrates (Chapter Five).
Finally, this volume provides three examples of the range of utilization of chromatography in
the study of natural products. This section provides useful and, it is hoped, inspirational ex‐
amples of how far the field of chromatography has come with respect to natural products
since Tswett’s discovery. These examples are considered in Chapters Six, Seven, and Eight.
This book is characterized by three important features. The authors represent an impressive
collection of international workers from Brazil, China, Egypt, Poland, Turkey, and the United
States. The majority of the chapters reflect the importance of collaborative efforts in contempo‐
rary research. Finally, some chapters are especially useful because of the experimental details
that are provided.
And it is to be hoped that readers will find that the chapters are both informative and inspira‐
tional.
Dean F. Martin
Barbara B. Martin
Chapter 1
Ion Exchange Chromatography - An Overview
Yasser M. Moustafa and Rania E. Morsi
Additional information is available at the end of the chapter
/>1. Introduction
Chromatography is the separation of a mixture of compounds into its individual components
based on their relative interactions with an inert matrix. However, chromatography is more
than a simple technique, it is an important part of science encompassing chemistry, physical
chemistry, chemical engineering, biochemistry and cutting through different fields. It is worth
to be mentioned here that the IUPAC definition of chromatography is "separation of sample
components after their distribution between two phases".
1.1. Discovery and history of chromatography [1, 2]
M. Tswett (1872-1919), a Russian botanist, discovered chromatography in 1901 during his
research on plant pigments. According to M. Tswett: "An essential condition for all fruitful
research is to have at one's disposal a satisfactory technique". He discovered that he could
separate colored leaf pigments by passing a solution through a column packed with adsorbent
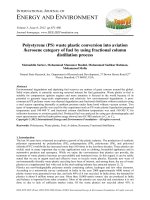
particles. Since the pigments separated into distinctly colored bands as represented in Figure
1, he named the new method “chromatography” (chroma – color, graphy –writing). Tswett
emphasized later that colorless substances can also be separated using the same principle.
The separation results from the differential migration of the compounds contained in a
mobile phase through a column uniformly packed with the stationary matrix. A mobile
phase, usually a liquid or gas, is used to transport the analytes through the stationary
phase while the matrix, or stationary phase, is generally an inert solid or gel and may be
associated with various moieties, which interact with the analyte(s) of interest. Interac‐
tions between the analytes and stationary phase are non-covalent and can be either ionic
or non-ionic in nature depending on the type of chromatography being used. Compo‐
nents exhibiting fewer interactions with the stationary phase pass through the column more
quickly than those that interact to a greater degree.
© 2013 Moustafa and Morsi; licensee InTech. This is an open access article distributed under the terms of the
Creative Commons Attribution License ( which permits
unrestricted use, distribution, and reproduction in any medium, provided the original work is properly cited.
Tswett’s initial experiments involved direct visual detection and did not require a means
of quantitation. Nowadays, chromatography is not only a separation technique. In most
versions, it is hyphenated analytical techniques combining the separation with the
identification and quantitative determination of the separated components. In this form,
chromatography has become the most widely used technique in the chemical analysis of
complex mixtures.
Many versions of chromatography are used. The various chromatographic techniques are
subdivided according to the physical state of these two phases, the mobile and the
stationary phases. These are: liquid chromatography including high performance, ion,
micellar, electrokinetic, thin-layer, gel-permeation, and countercurrent versions; gas
chromatography and supercritical fluid chromatography. Various forms of chromatogra‐
phy can be used to separate a wide variety of compounds, from single elements to large
molecular complexes. By altering the qualities of the stationary phase and/or the mobile
phase, it is possible to separate compounds based on various physiochemical characteris‐
tics. Among these characteristics are size, polarity, ionic strength, and affinity to other
compounds. Chromatography also permits a great flexibility in the technique itself. The
flow of the mobile phase might be controlled by gravity, pressure, capillary action and
electro-osmosis; the separation may be carried out over a wide temperature range and
sample size can vary from a few atoms to many kilograms. Also, the shape of the system
in which the separation takes place can be varied, using columns of various length and
diameter or flat plates. Through all this, evaluation chromatography has been trans‐
formed from an essentially batch technique into an automated instrumental method.
Through its continuous growth, chromatography became the most widely used analytical
separation technique in chemistry and biochemistry. Thus, it is not exaggeration to call it
the technique of the 20th Century.
Figure 1. Schematic diagram of the principles of chromatography as discovered by Tswett (1901).
Column Chromatography
2
2. Ion chromatography
Classical liquid chromatography based on adsorption- desorption was essentially a non-linear
process where the time of retardation (retention time) and the quantitative response depend
on the position on the adsorption isotherm. Essentially, it was a preparative technique: the aim
was to obtain the components present in the sample in pure form which could then be
submitted to further chemical or physical manipulations [3].
Ion exchange chromatography (or ion chromatography, IC) is a subset of liquid chromatog‐
raphy which is a process that allows the separation of ions and polar molecules based on their
charge. Similar to liquid chromatography, ion chromatography utilizes a liquid mobile phase,
a separation column and a detector to measure the species eluted from the column. Ion-
exchange chromatography can be applied to the determination of ionic solutes, such as
inorganic anions, cations, transition metals, and low molecular weight organic acids and bases.
It can also be used for almost all kinds of charged molecule including large proteins, small
nucleotides and amino acids. The IC technique is frequently used for the identification and
quantification of ions in various matrices.
2.1. Ion chromatography process [4]
The basic process of chromatography using ion exchange can be represented in 5 steps (as‐
suming a sample contains two analytes A & B): eluent loading, sample injection, separation
of sample, elution of analyte A, and elution of analyte B, shown and explained below. Elu‐
tion is the process where the compound of interest is moved through the column. This hap‐
pens because the eluent, the solution used as the solvent in chromatography, is constantly
pumped through the column. The representative schemes below are for an anion exchange
process. (Eluent ion = , Ion A= , Ion B = )
Step 1: The eluent loaded onto the column displaces any anions bonded to the resin and
saturates the resin surface with the eluent anion.
This process of the eluent ion (E
-
) displacing an anion (X
-
) bonded to the resin can be expressed
by the following chemical interaction:
Resin
+
-X
-
+ E
-
<=> Resin
+
-E
-
+ X
-
Step 2: A sample containing anion A and anion B are injected onto the column. This sample
could contain many different ions, but for simplicity this example uses just two different ions
as analytes in the sample.
Ion Exchange Chromatography - An Overview
/>3
Step 3: After the sample has been injected, the continued addition of eluent causes a flow
through the column. As the sample elutes (or moves through the column), anion A and anion
B adhere to the column surface differently. The sample zones move through the column as
eluent gradually displaces the analytes.
Step 4: As the eluent continues to be added, the anion A moves through the column in a band
and ultimately is eluted first.
This process can be represented by the chemical interaction showing the displacement of the
bound anion (A¯) by the eluent anion (E¯).
Resin
+
-A¯ + E¯ <=> Resin
+
- E¯ + A¯
Step 5: The eluent displaces anion B, and anion B is eluted off the column.
Resin
+
-B
-
+ E- <=> Resin
+
-E- + B
-
The overall 5 step process can be represented pictorially as shown in Figure 2:
Column Chromatography
4
Figure 2. Schematic representation of IC process.
A typical ion chromatography consists of several components as shown in Figure 3. The eluent
is delivered to the system using a high-pressure pump. The sample is introduced then flows
through the guard and into the analytical ion-exchange columns where the ion-exchange
separation occurs. After separation, the suppressor reduces the conductivity of the eluent and
increases the conductivity of the analytes so they are delivered to the detector. A computer
and software are used to control the system, acquire and process the data. Since the introduc‐
tion of ion chromatography in 1975, many developments were carried out to improve sup‐
pressor technology to provide better sensitivity and consistency for the analysis of a wide
variety of compounds [5].
Figure 3. Schematic representation of Ion chromatography instrumentation.
3. Instrumentation [6-9]
Typical IC instrumentation includes: pump, injector, column, suppressor, detector and
recorder or data system as represented in Figure 4.
Ion Exchange Chromatography - An Overview
/>5
Figure 4. Typical ion chromatography instrument.
3.1. Pump
The IC pump is considered to be one of the most important components in the system which
has to provide a continuous constant flow of the eluent through the IC injector, column, and
detector. The most practical system for the delivery of the mobile phase is that which can
combine several liquids in different proportions at the command of the operator. This blending
capability speeds the process of selecting the optimum eluent mixture required for isocratic
analysis. There is a series of mobile phase reservoirs that can contain a range of different mobile
phases that can be used individually, blended or for mobile phase programming purposes
"gradient elution". In general liquid chromatography, the reservoirs can be stainless steel but
in ion chromatography where the mobile phases can have extreme pH values, the reservoirs
need to be made of glass or preferably a suitable plastic such as PEEK (polyether-ether-ketone).
The advantage of PEEK is that it is also inert to many organic solvents that may need to be
used in the mobile phase. In fact, all components of an ion chromatograph that may come in
contact with either phase of the distribution system should be constructed from appropriate
inert material. This includes all mobile phase conduits, valves, pumps, sampling devices,
columns, detector sensor cells, etc. The solvent reservoirs are connected to a solvent selection
valve and a solvent programmer where a particular solvent or particular solvent program can
be selected. The solvent then passes from the selector/programmer to a high pressure pump.
The mobile phase passes from the pump to the sampling device, usually a simple rotating
valve that on rotation places the sample in line with the mobile flow which then passes onto
the column. The exit flow from the column passes either to an ion suppressor (which will be
Column Chromatography
6
discussed later) or directly to the detector. Gas may come out of the solution at the column exit
or in the detector, resulting in sharp spikes. Spikes are created by microscopic bubbles which
change the nature of the flowing stream making it heterogeneous. The drift may occur as these
microscopic bubbles gradually collected and combined in the detector cell. The best results
can be obtained by applying vacuum to each solvent for about 5 min. with subsequent helium
purging and storing under helium atmosphere.
3.1.1. Pumps types
The constant-flow pumps is the most widely used in all common IC applications. Flow rate
stability is an important pump feature that distinguishes pumps. For size exclusion chroma‐
tography, the flow rate has to be extremely stable. External electronic control is a very desirable
feature when automation or electronically controlled gradients are to be run.
3.1.2. Constant flow pumps
Constant-flow systems are generally of two basic types: reciprocating piston and positive
displacement (syringe) pumps. Reciprocating piston pump can maintain a liquid flow for
indefinitely long time.
3.1.3. Reciprocating piston pumps
The pumping rate is controlled by piston retracts or by the cam rotating speed. The main
drawback of this type of pump is sinusoidal pressure pulsations which lead to the necessity
of using pulse dampers.
3.1.4. Dual piston pumps
Provides a constant and almost pulse free flow. Both pump chambers are driven by the same
motor through a common eccentric cam; this common drive allows one piston to pump while
the other is refilling. As a result, the two flow-profiles overlap each other significantly reducing
the pulsation downstream of the pump; this is visualized below.
Its advantages are: unlimited solvent reservoir allowing long-term unattended use; quick
changeover and clean out capability; wide flow rate range (0.01 to 10 ml/min) is provided
without gear change. While its drawbacks are: incompletely compensated pulsations might
be observable at high refractive index detector sensitivities, especially at low flow rates; pump
reliability depends on the cleanliness of the mobile phase and continued sealing capability of
four check valves on each cycle (e.g. several times per minute).
Recent improvements include: A computer-designed camshaft is used to achieve maximum
overlap of pump strokes, resulting in virtually undetectable pulsation or ripple and small-
volume check valves are used to allow the pumps to function reliably at flow rates as low as
0.001 ml/min.
Ion Exchange Chromatography - An Overview
/>7
3.2. Injector
Sample introduction can be accomplished in various ways. The simplest method is to use an
injection valve. In more sophisticated LC, automatic sampling devices are incorporated where
sample introduction is done with the help of auto-samplers and microprocessors.
In liquid chromatography, liquid samples may be injected directly and solid samples need
only to be dissolved in an appropriate solvent. The solvent need not to be the mobile phase,
but frequently it is judiciously chosen to avoid detector interference, column/component
interference or loss in efficiency. It is always best to remove particles from the sample by
filtering, or centrifuging since continuous injection of particulate materials will eventually
cause blockage of injection devices or columns.
Injectors should provide the possibility of injecting the liquid sample within the range of 0.1
to 100 ml of volume with high reproducibility and under high pressure (up to the 4000 psi).
They should also produce minimum band broadening and minimize possible flow disturban‐
ces. The most useful and widely used sampling device for modern LC is the microsampling
injector valve. With these sampling valves, samples can be introduced reproducibly into
pressurized columns without significant interruption of flow, even at elevated temperatures.
With commercially available automatic sampling devices, large numbers of samples can be
routinely analyzed by LC without operator intervention. Such equipment is popular for the
analysis of routine samples (e.g., quality control of drugs), particularly when coupled with
automatic data-handling systems. Automatic injectors are indispensable in unattended
searching (e.g., overnight) for chromatographic parameters such as solvent selectivity, flow
rate, and temperature optimization.
Most of the autosamplers have a piston metering syringe type pump to suck the preestablished
sample volume into a line and then transfer it to the relatively large loop (~100 ml) in a standard
six-port valve. The simplest autosamplers utilize the special vials with pressuarization caps.
A special plunger with a needle, push the cap down to the vial and displace the sample through
the needle into the valve loop. Most of the autosamplers are microprocessor controlled and
can serve as a master controller for the whole instrument
3.3. Columns
The principle of ion exchange chromatography is that, charged molecules bind electrostatically
to oppositely charged groups that have been bound covalently on the matrix. Ion exchange
chromatography is a type of adsorption chromatography so that, charged molecules adsorb
to ion exchangers reversibly so, the molecules can be bounded or eluted by changing the ionic
environment. Ion exchangers can be used in column chromatography to separate molecules
according to charge; actually other features of the molecule are usually important so that the
chromatographic behavior is sensitive to the charge density, charge distribution, and the size
of the molecule. An ion exchanger is usually a three-dimensional network or matrix that
contains covalently liked charged groups. If a group is negatively charged, it will exchange
positive ions and is a cation exchanger. An example of a group used in cation exchanger is the
carboxy-methyl group. However, if a group is positively charged, it will exchange negative
Column Chromatography
8
ions and is an anion exchanger. An example of a group used in anion exchanger is the di-ethyl-
amino-ethyl group (DEAE). The matrix (stationary phase) can be made of various materials,
commonly used materials are dextran, cellulose, and agarose.
The separation on an ion exchanger is usually accomplished in two stages: first, the substances
to be separated are bound to the exchanger using conditions that give stable and tight binding;
then the column is eluted with buffers of different pH, ionic strength or composition and the
components of the buffer compete with the bound material for the binding sites. To choice
whether the ion exchanger is to be anionic or cationic depend on the material to be separated.
If the materials to be bound to the column have a single charge (i.e., either plus or minus), the
choice is clear. However, many substances (e.g., proteins), carry both negative and positive
charges and the net charge depends on the pH. In such cases, the primary factor is the stability
of the substance at various pH values. Most proteins have a pH range of stability (i.e., in which
they don’t denature) in which they are either positively or negatively charged. So, if a protein
is stable at pH value above the isoelectric point, an anion exchanger should be used; but if
stable at values below the isoelectric point, a cation exchanger is required. Ion exchange
columns vary widely in size, packing material and material of construction. Depending on its
ultimate use and area of application, the column material may be stainless steel, titanium, glass
or an inert plastic such as PEEK. The column can vary in diameter from about 2mm to 5 cm
and in length from 3 cm to 50 cm depending on whether it is to be used for normal analytical
purposes, microanalysis, high speed analyses or preparative work. The life of a column will
depend largely on the type of samples it is used to separate but the conditions under which
the separations are carried out will also place limits on it useful lifetime.
Guard column is placed anterior to the separating column. This serves as a protective factor
that prolongs the life and usefulness of the separation column. They are dependable columns
designed to filter or remove particles that clog the separation column and compounds and ions
that could ultimately cause "baseline drift", decreased resolution, decreased sensitivity or
create false peaks
3.4. Suppressor
The suppressor reduces the background conductivity of the chemicals used to elute samples
from the ion-exchange column which improves the conductivity measurement of the ions
being tested. IC suppressors are membrane-based devices which are designed to convert the
ionic eluent to water as a means of enhancing the sensitivity. It can be used with universal
detectors to act as a desalting device, thereby removing the interference resulting from the
presence of ionic salts in the eluent. Suppressors are normally used with purely aqueous
eluents, so there is a need to establish whether these suppressors can be used with the aqueous/
organic eluents needed to elute organic analytes which are retained on the stationary phase
during their interaction. Eluents using ionic gradients and containing organic solvents can be
suppressed satisfactorily using either chemical suppression with a micromembrane suppres‐
sor or electrolytic suppression using a self-regenerating suppressor. For utilization in industry,
the electrolytic suppressor is usually more appropriate since it can employ water as the
suppressor regenerant and is fully automated in terms of response to changing eluent
Ion Exchange Chromatography - An Overview
/>9
conditions. Care needed to be taken with controlling the suppressor current in order to avoid
damage to the suppressor and also the generation of ionic components from oxidation of the
organic solvents (especially methanol) present in the eluent. Further potential problems,
arising when using suppressors as de-salting devices with organic analytes, are the possibility
of analytes loss in the suppressor as a result of adsorption or precipitation effects and disper‐
sion of the analyte band in the suppressor.
Weakly acidic analytes are anionic in the presence of the high pH eluents used with anion-
exchange IC, but become protonated in the suppressor and are therefore prone to hydrophobic
adsorption or precipitation. Similarly, weakly basic analytes are separated as cations with low
pH eluents but are deprotonated in the suppressor to form neutral species. The micro-
membrane suppressor consists of layered ion-exchange membranes and fibrous chamber
screens with the regenerant chamber screen modified to possess a high ion-exchange capacity
which serves as a reservoir for regenerant ions. There is also a possibility of losses of analytes
resulting from penetration of the analyte through the suppressor membrane into the regener‐
ant chamber. Theoretically, anionic analytes are not able to penetrate the cation-exchange
membranes of the anion suppressor due to the effects of Donnan exclusion.
Introduction of a suppression device between the column and the detector can be expected to
cause some degree of peak broadening due to diffusional effects. The shape of the analyte band
will also be influenced by hydrophobic adsorption effects, especially when the adsorption and
desorption processes are slow. Examination of peak shapes and analyte losses can therefore
provide important insight into the use of suppressors with organic analytes which are weakly
acidic or weakly basic. It can be expected that peak area recovery rates after suppression are
governed by a combination of hydrophobic interactions with the suppressor and permeation
through the membranes with the balance between these mechanisms being determined by
eluent composition, suppression conditions and analyte properties.
3.5. Detectors
Current LC detectors have a wide dynamic range normally allowing both analytical and
preparative scale runs on the same instrument.
An ideal detector should have the following properties: low drift and noise level (particularly
crucial in trace analysis), high sensitivity, fast response, wide linear dynamic range, low dead
volume (minimal peak broadening), cell design which eliminates remixing of the separated
bands, insensitivity to changes in type of the solvent, flow rate and temperature, operational
simplicity and reliability. It should be non-destructive.
Electrical conductivity detector is commonly use. The sensor of the electrical conductivity
detector is the simplest of all the detector sensors and consists of only two electrodes situated
in a suitable flow cell. The sensor consists of two electrodes sealed into a glass flow cell. In the
electric circuit, the two electrodes are arranged to be the impedance component in one arm of
a Wheatstone bridge. When ions move into the sensor cell, the electrical impedance between
the electrodes changes and the 'out of balance signal' from the bridge is fed to a suitable
electronic circuit. The 'out of balance' signal is not inherently linearly related to the ion
Column Chromatography
10
concentration in the cell. Thus, the electronic circuit modifies the response of the detector to
provide an output that is linearly related to the ion concentration.
The amplifier output is then either digitized, and the binary number sent to a computer for
storage and processing, or the output is passed directly to a potentiometric recorder. This
would result in a false change in impedance due to the generation of gases at the electrode
surfaces. The frequency of the AC potential that is applied across the electrodes is normally
about 10 kHz. In its simplest form, it can consist of short lengths of stainless steel tube insulated
from each other by PTFE connecting sleeves.
Amperometric detection is a very sensitive technique. In principle, voltammetric detectors
can be used for all compounds which have functional groups which are easily reduced or
oxidized. Apart from a few cations (Fe
3+
, Co
2+
), it is chiefly anions such as cyanide, sulfide and
nitrite which can be determined in the ion analysis sector. The most important applications lie
however in the analysis of sugars by anion chromatography and in clinical analysis using a
form of amperometric detection know as Pulsed Amperometric Detection (PAD).
Mass Spectrometry: Mass to charge ratio (m/z) allows specific compound ID determination.
Several types of ionization techniques: electrospray, atmospheric pressure chemical ionization,
electron impact. The detector usually contains low volume cell through which the mobile phase
passes carrying the sample components.
Detector sensitivity is one of the most important properties of the detector. The problem is to
distinguish between the actual component and artifact caused by the pressure fluctuation,
bubble, compositional fluctuation, etc. If the peaks are fairly large, one has no problem in
distinguishing them however, the smaller the peaks, the more important that the baseline be
smooth, free of noise and drift. Baseline noise is the short time variation of the baseline from
a straight line. Noise is normally measured "peak-to-peak": i.e., the distance from the top of
one such small peak to the bottom of the next. Noise is the factor which limits detector
sensitivity. In trace analysis, the operator must be able to distinguish between noise spikes and
component peaks. For qualitative purposes, signal/noise ratio is limited by 3. For quantitative
purposes, signal/noise ratio should be at least 10. This ensures correct quantification of the
trace amounts with less than 2% variance. The baseline should deviate as little as possible from
a horizontal line. It is usually measured for a specified time, e.g., 1/2 hour or one hour and
called drift. Drift usually associated to the detector heat-up in the first hour after power-on.
Sensitivity can be associated with the slope of the calibration curve. It is also dependent on the
standard deviation of the measurements. The higher the slope of your calibration curve the
higher the sensitivity of your detector for that particular component, but high fluctuations of
your measurements will decrease the sensitivity. The more selective the detection, the lower
is signal/noise and the higher the sensitivity. The detector response is linear if the difference
in response for two concentrations of a given compound is proportional to the difference in
concentration of the two samples.
Ion Exchange Chromatography - An Overview
/>11
3.6. Data system
The main goal in using electronic data systems is to increase analysis accuracy and precision,
while reducing operator attention. In routine analysis, where no automation (in terms of data
management or process control) is needed, a pre-programmed computing integrator may be
sufficient. For higher control levels, a more intelligent device is necessary, such as a data station
or minicomputer.
4. Advanced applications of ion chromatography
Ion chromatography is basically a chromatographic method that has become a routine
analytical method. It is regarded as a versatile analytical technique for separating and quan‐
tifying ions. The concept of IC was successively widened with advancements of the rapid
development in separation, column stationary phase, great variety of detectors, data analysis
and hyphenated techniques. Moreover, it could include other separation methods (e.g., ion
interaction and ion exclusion) for simultaneous separation of analyte components. IC analysis
has matured to a well-established rugged, sensitive and reliable analysis technique for a wide
variety of chemical compounds present in various matrices. On this manner, many papers
have been published during the last few years dealing with new modalities in sample
pretreatment, separation, detection, etc., for improving samples analysis. The following section
deals with the recent development in instrumentations and applications to fit the desired fields
of applications.
4.1. Qualitative and quantitative analysis of cations and anions
The demand for the determination of ionic species in various water samples is growing rapidly
along with increasing environmental problems and it is clearly important to develop an
appropriate analytical method for their determination. IC represents one of the most efficient
methods that provide accurate and rapid determination of ionic species in water samples.
Basically, anions and cations can be independently separated. Recent advances in ion chro‐
matography (IC) make it a superior analytical method; it has been expanded for the simulta‐
neous determination of inorganic anions and cations. Column switching has become a capable
technique for the simultaneous determination of inorganic anions and cations in a single
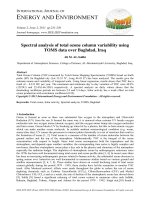
chromatographic run. Amin et al. [10] demonstrated a convenient and applicable method for
various natural fresh water samples analysis (Figure 5). They proposed an ion chromatography
(IC) method for the determination of seven common inorganic anions (F
−
, H
2
PO
4
−
, NO
2
−
, Cl
−
,
Br
−
, NO
3
−
, and SO
4
2−
) and/or five common inorganic cations (Na
+
, NH
4+
, K+, Mg
2+
, and Ca
2+
)
using a single pump, a single eluent and a single detector. The system used cation-exchange
and anion-exchange columns connected in series via a single 10-port switching valve. The 10-
port valve was switched for the separation of either cations or anions in a single chromato‐
graphic run. Using a specific eluent, 1.0 mM trimellitic acid (pH 2.94), seven anions and the
five cations could be separated on the anion-exchange column and the cation-exchange
column, respectively. The elution order was found to be F
−
< H
2
PO
4
−
< NO
2
−
< Cl
−
< Br
−
< NO
3
−
Column Chromatography
12
< SO
4
2−
for the anions and Na
+
< NH
4
+
< K
+
< Mg
2+
<Ca
2+
for the cations. Complete separation of
the above anions or cations was demonstrated within 35 min each. Detection limits calculated
were 0.05–0.58 ppm for the anions and 0.05–0.38 ppm for the cations, whereas repeatability
values were below 2.26, 2.76, and 2.90% for peak height, peak area and retention time,
respectively.
Figure 5. Schematic diagram of the instruments used for simultaneous separation of anions and cations [10].
4.2. Qualitative and quantitative analysis of halides
4.2.1. Bromate
Bromate has been classified as a human carcinogen by both the IARC (International Agency
for the Research on Cancer) and the USEPA (United States Environmental Protection Agency)
and is known to be toxic to fish and other aquatic life [11, 12]. Bromate could be produced in
aquatic systems upon the oxidation of aqueous bromide. Controlled ozonation has been
considered as an effective disinfectant tool in aquatic systems [13] but when sea water is
subjected to ozonation, oxy-bromide ozonation by-products (OBP) are produced and these are
important both in terms of their disinfection ability and also in relation to their potential
toxicity. When seawater is oxidized, aqueous bromide (Br-) is initially converted to hypobro‐
mite (OBr¯) which can then either be reduced back to bromide or oxidized further to bromate
(BrO3-) which is known to be toxic to fish and other aquatic life and classified as a human
carcinogen. There has been thus a considerable interest in bromate analysis so that trace
analysis of bromate in water has received considerable attention in recent years.
Ion Exchange Chromatography - An Overview
/>13
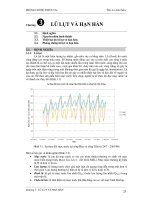
Zakaria et al. [12] used a multi-dimensional matrix-elimination ion chromatography approach,
two-dimensional and three-dimensional configurations as described in Figure 6, for the
determination of bromate in seawater samples. The designed configurations were used
effectively to eliminate the interference caused by the high concentration of ubiquitous ions
present in seawater such as chloride and sulfate. A two-dimensional approach utilizing a high
capacity second dimension separation, comprising two columns connected in series, was
applied successfully and permitted the determination of bromate in undiluted seawater
samples injected directly onto the ion chromatography system. A three-dimensional method
utilizing two 10-port switching valves (Figure 6b) to allow sharing of the second suppressor
and detector between the second and third dimension separations showed better resolution
and detection for bromate and reduced the limit of detection to 60 µg/L for spiked seawater
samples. Experimentally, the analyzed ozonated seawater samples exhibited a non-linear
increase in bromate level on increasing ozonation time. A bromate concentration in excess of
1770 µg/L was observed following ozonation of the seawater sample for 120 min. The devel‐
oped method provides the elimination of high concentration of interfering species, such as
chloride and sulfate, by taking specific fractions from each separation column and re-injecting
onto a subsequent column.
Using this approach, the limit of detection for bromate was 1050 µg/L using a 500 µL injection
loop. Good linearity was obtained for bromate with correlation coefficients for the calibration
curves of 0.9981 and 0.9996 based on peak height and area, respectively. The limit of detection
achieved was more than sufficient to determine levels of bromate known to be toxic to aquatic
species of interest in aquaculture applications. The developed method is therefore applicable
to aquaculture, especially where water is recycled and repeatedly ozonated, leading to the
probability of accumulation of bromate. Furthermore the described method is generally
applicable to other high ionic strength samples, although re-optimization of cutting times
would be required. The system is also potentially applicable for the analysis of other low
concentration ionic species, including other oxyhalides such as chlorate.
4.2.2. Iodide and iodate
One of the problems of iodide estimation by conductivity detection is the expected interference
from other ions and poor sensitivity of detection which rendered its estimation in complex
samples difficult to apply. On the other hand, several methods have been developed for the
estimation of iodate ion in water, however, one drawback of these methods is that it can give
false estimation of iodate with oxidizing agents such as bleaching powder, which too can
generate iodine from the reaction with I¯. It is therefore necessary to devise a sensitive and
selective precise test for the separation and detection of iodate species in different samples
matrices. Kumar et al. [14] applied successfully an ion chromatographic method with conduc‐
tivity detection for iodate estimation in common salt after sample pretreatment with on-guard
silver cartridge for the removal of the large excess of chloride ion. Unfortunately, fresh Ag
cartridge is required for each sample which would render the method expensive for routine
use.
Column Chromatography
14
Figure 6. Schematic diagram of instrumentation used to perform the multi-dimensional IC. (a) 10-Port valve positions
for detection of 2nd dimension separation (i.e. effluent from column 2 diverted through conductivity detector 2). (b)
10-Port valve positions for injection of 2
nd
dimension cut fractions onto 3
rd
dimension column with subsequent detec‐
tion using conductivity detector 2 [12].
Ion Exchange Chromatography - An Overview
/>15
Ion chromatography employing anion-exchange column with amperometric detection is
demonstrated to be well suited for quantitative estimation of iodide and iodate in iodised salt
[15].The success of the technique, which dispenses with the need for pre-treatment for chloride
removal, hinges on the excellent resolution achieved and the high selectivity and sensitivity
of detection of iodide by amperometry. The system consisted of a gradient pump with vacuum
degas option, an electrochemical detector, liquid chromatography module, eluant organiser
and rheodyne injection loop and PVDF (polyvinylidene fluoride) filters with pore size of 0.45
µm. The flow-through detection cell is made of a 1.0-mm diameter silver working electrode
and a pH-Ag|AgCl combination reference electrode. The titanium body of the cell served as
the counter electrode. Separations were accomplished on a 250 mm × 4 mm i.d. column coupled
with a 50 mm × 4 mm i.d. guard column. Such a column contains a hydrophilic, anion-exchange
resin that is well suited to the chromatography of the relatively hydrophobic iodide anion.
Elution was carried out under isocratic condition using HNO
3
(50 mM) at a flow rate of 1.5
mL/min. The injection loop volume was fixed at 50 µL and the sample run time was 10 min.
Ion chromatographic analysis with conductivity detection was undertaken on the same
column using 22 mM NaOH as eluant and flow rate of 1 mL/minute. The injection loop volume
was fixed at 10 µL and the sample run time was 10 min.
This technique is easy to use and its most important merit is that it can readily indicate absence
of iodate in case adulterants that give false positive iodometric test are used in its place. The
method also enables trace quantities of iodide to be detected even in the presence of large
excess of chloride ion. Interferences from impurities normally present in salt were insignificant.
4.2.3. Perchlorate
In chromatographic analysis, the highly retained species present a challenge for ion chroma‐
tographic analysis due to peak broadening which leads to low resolution between analytes of
interest and to relatively poor detection limits. This problem is often more acute with mono‐
valent anions than with monovalent cations because common anions are often large, and the
greater radius to charge ratio facilitates partitioning to the hydrophobic stationary phase. The
introduction of macrocycle-based ion chromatography has provided useful new techniques
for analysis of both cations and anions. For example, capacity gradient ion chromatography
[16] is beneficial in decreasing retention times and thus peak broadening for highly retained
anions, making possible the analysis of a broad host of anions. Lamb et al. [17] focused on the
introduction of macrocycles into ion chromatographic systems for increased versatility in the
separation of both cations and anions. They described extensively the use of macrocycles based
ion chromatography in the analysis of perchlorate ion.
As more information on the extent of the contamination and the dangerous effects of perchlo‐
rate consumption has become available, much concern has arisen over perchlorate contami‐
nation in public water systems. Furthermore, the US Environmental Protection Agency
(USEPA) has periodically reduced the acceptable limit for safe consumption. Currently, the
limit stands at 0.7 µg/kg/day, which corresponds to 24.5 µg/L for a 70 kg human drinking 2 L
of water per day. The method described by Lamb et al. [17] provides effective perchlorate
determinations (shown in Figure 7) using standard conductimetric detection by combining an
Column Chromatography
16
18-crown-6-based mobile phase with an underivatized reversed-phase mobile phase ion
chromatography (MPIC) column. One unique feature of this method is the flexibility in column
capacity that is achieved through simple variations in eluent concentrations of 18-crown-6 and
KOH, facilitating the separation of target analyte anions; perchlorate. Using a standard anion
exchange column as concentrator makes possible the determination of perchlorate as low as
0.2 µg/L in low ionic strength matrices. Determination of perchlorate at the sub-ug/L level in
pure water and in hardwater samples with high background ion concentrations can be
achieved this way. However, like other IC techniques, this method is challenged to achieve
analyses at the µg/L level in the demanding high ionic strength matrix described by the United
States Environmental Protection Agency (USEPA) (1000 mg/L chloride, sulfate and carbonate)
[17]. This challenge was approached by use of the Cryptand C1 concentrator column to
effectively preconcentrate perchlorate while reducing background ion concentrations in the
high ionic strength matrix. The method makes possible the determination of perchlorate at the
5 µg/L level in the highest ionic strength matrix described by the EPA. In short, this method
provides an alternative method for the analysis of perchlorate at concentration levels as low
as 5 µg/L in high background samples and to well below 1 µg/L in pure water and low salt
samples.
Figure 7. Optimal system configuration using AG4 guard column as the concentrator column. Five milliliters of Milli-Q
water spiked with ClO4¯ was loaded onto the concentrator column at varying concentrations of perchlorate. Eluent:
0.5M 18-crown-6 and 5mM KOH. Injection: 5mL loaded onto concentrator column, flow rate: 1.0 mL/min, tempera‐
ture: 20
o
C [17].
Ion Exchange Chromatography - An Overview
/>17