Báo cáo khoa học: Thermal behaviour of cubic phases rich in 1-monooleoyl-rac-glycerol in the ternary system docx
Bạn đang xem bản rút gọn của tài liệu. Xem và tải ngay bản đầy đủ của tài liệu tại đây (608.4 KB, 10 trang )
Thermal behaviour of cubic phases rich in 1-monooleoyl-
rac
-glycerol
in the ternary system
1-monooleoyl-
rac
-glycerol/
n
-octyl-b-
D
-glucoside/water
Gerd Persson
1
,Ha
˚
kan Edlund
1
and Go¨ ran Lindblom
2
1
Department of Natural and Environmental Sciences, Mid Sweden University, Sundsvall, Sweden,
2
Department of Biophysical
Chemistry, Umea
˚
University, Umea
˚
, Sweden
Using synchrotron X-ray diffraction the thermal behaviour
was studied of the cubic phases in the 1-monooleoyl-rac-
glycerol (MO)/n-octyl-b-
D
-glucopyranoside (OG)/
2
H
2
O
system with 58 or 45 wt % MO concentration and varying
OG/
2
H
2
O contents. These MO contents correspond to a
Pn3m cubic single-phase or a Pn3m cubic phase in excess
water on the binary MO/water axis of the ternary phase
diagram. The cubic liquid crystalline phases are stable with
small fractions of OG, while higher OG concentrations
trigger a cubic-to-lamellar phase transition. Moreover, with
increasing OG concentration the initial Pn3m structure is
completely converted to an Ia3d structure prior to the L
a
phase being formed. Upon heating this effect is reversed,
resulting in an Ia3d-to-Pn3m phase transition. For some
samples additional peaks were observed in the diffracto-
grams upon heating, resulting from the metastability
notoriously shown by bicontinuous cubic phases. This
judgement is supported by the fact that upon cooling these
peaks were absent. Remarkably, both the Ia3d and the Pn3m
cubic structures could be in equilibrium with excess water in
this ternary system. A comparison is made with previous
results on n-dodecyl-b-
D
-maltoside (DM), showing that
cubic phases with OG have higher thermal and composi-
tional stability than with DM.
Keywords: 1-monooleoyl-rac-glycerol; n-octyl-b-
D
-gluco-
side; monoolein-rich cubic phases; thermal behaviour.
Access to the complete structure of membrane proteins is
one of the cornerstones in obtaining a better understanding
of their function in the biological cell. For larger proteins the
most important method for achieving this information is
X-ray diffraction, which require high quality crystals of the
protein. It is frequently possible to crystallise water-soluble
proteins, which can be inferred from the large number of
structures determined so far [1]. However, it is considerably
more difficult to get suitably good crystals of membrane
proteins, mainly due to the need to remove them from
their native membrane environment, and solubilize them in
mild detergent micelles. The solubilization process may lead
to denaturation of the proteins, thus destroying them.
Therefore, one of the foremost current issues is concerned
with the problem of obtaining such crystals. A new
approach to solve this problem was introduced by Landau
and Rosenbusch in 1996 [2]. Their method includes the use
of a bicontinuous cubic liquid crystalline phase as the
crystallization medium. The general idea behind this
approach was to introduce the proteins into an envi-
ronment that mimics the native milieu [2], and the bicon-
tinuous cubic phases formed by 1-monooleoyl-rac-glycerol
(MO) [3,4] was utilized to meet these basic requirements.
The exact mechanisms involved in the crystallization
process are yet to be elucidated, although an attempt
to describe the process has been published [5]. It should
be noted that since the introduction of this method, only
two to three membrane proteins have been successfully
crystallised [2,6–8]. Therefore, for the method to be
generally functional it is necessary to have a detailed
understanding, at the molecular level, of what is driving
the protein crystallization. To utilize this method fully,
several crucial issues need to be solved. From a colloid or
surfactant chemistry point of view knowledge about the
microstructure of the liquid crystalline phases involved, and
information about the possible effect(s) different additives
may have on the liquid crystalline phases present are
very important. A recent paper presented the compati-
bility of a number of substances with the MO cubic phases
[9], but among these additives only one was a surfactant
(cetyltrimethylammonium bromide). Moreover, the most
frequently used surfactant for the solubilization of the
membrane proteins is n-octyl-b-
D
-glucopyranoside (OG).
However, to our knowledge, only a few attempts to partially
investigate the effect of OG on the stability of the MO cubic
phases have been published [10,11], and it seems appropriate
Correspondence to G. Persson, Department of Natural and
Environmental Sciences, Mid Sweden University, Holmgatan 10,
SE-851 70 Sundsvall, Sweden.
Fax: + 46 60 148802, Tel.: + 46 60 148932,
E-mail:
Abbreviations:DM,n-dodecyl-b-
D
-maltoside; DSC, differential
scanning calorimetry; MO, 1-monooleoyl-rac-glycerol; OG,
n-octyl-b-
D
-glucopyranoside; PMOS, phosphomolybdic
acid in sulphuric acid solution; SAXD, small-angle X-ray diffraction;
TLC, thin-layer chromatography.
(Received 8 July 2002, revised 27 October 2002,
accepted 11 November 2002)
Eur. J. Biochem. 270, 56–65 (2003) Ó FEBS 2003 doi:10.1046/j.1432-1033.2003.03361.x
to extend these studies further. In a previous paper we
presented the entire phase diagram for the ternary system
MO/OG/
2
H
2
O [12], from which it can be concluded that
only a small fraction of OG is sufficient to convert the
MO-rich cubic phases to a lamellar liquid crystalline (L
a
)
structure, and that these cubic phases are also found in
equilibrium with excess water (cf. the binary MO/water-
system). In this report, the thermal behaviour of such cubic
phases rich in MO has been investigated by X-ray diffrac-
tion. The study comprises both one- and two-phase regions,
including cubic phases in equilibrium with excess aqueous
solution.
Materials and methods
Materials
1-Monooleoyl-rac-glycerol (MO) (> 99% purity) and
n-octyl-b-
D
-glucopyranoside (OG) (> 98% purity) were
purchased from Sigma Aldrich Chemie GmbH, Germany
and the substances were used without further purification.
2
H
2
O (99.9% in
2
H) was obtained from Cambridge Isotope
Laboratories, USA.
Sample preparation
Samples were prepared by weighing the appropriate
amounts of each substance into 8-mm glass tubes, which
were sealed with removable caps. The samples were
homogenized by rotation and stored in the dark at 25 °C.
All samples were inspected both visually and between
crossed polarizers to check homogeneity and optical
anisotropy. The samples were then placed in 1.5-mm
capillaries. All samples were stored in 5 °C for 12 h and
then at 25 °C for 4 days prior to measuring.
Methods
Small-angle X-ray diffraction (SAXD). The small angle
X-ray diffraction, SAXD, experiments were performed at
the Austrian Academy SAXS station at the ELETTRA
synchrotron (Trieste, Italy) using the 8 keV beam, corres-
ponding to a wavelength of 0.15 nm. The temperature was
controlled by an in-line differential scanning calorimeter
(DSC), and the temperature-scanning rate used was
1 °CÆmin
)1
during heating, while the cooling rate was
approximately 5 °CÆmin
)1
. To ensure that a powder pattern
was obtained, the capillary was rotated with an angular
velocity of 1.26 radÆs
)1
using a purpose-built device. To
minimize the exposure time we used a sampling time of
10 sÆmin
)1
and the shutter was closed during the residual
50 s. The space group of the structure of the cubic liquid
crystalline phase was achieved from the locations of the
peaks in the SAXD diffraction patterns [13]. For the two
space groups identified in this work (Pn3m and Ia3d)the
first four Bragg reflections appear at spacing ratios of
Ö2:Ö3:Ö4:Ö6andÖ6:Ö8:Ö14 : Ö16, corresponding to
the Miller indices (110), (111), (200), (211) and (211), (220),
(321), (400), respectively. The cubic cell lattice parameter, a,
is obtained as the slope of a plot of the reciprocal spacings
(1/d
hkl
) of the Bragg reflections vs. m ¼ (h
2
+ k
2
+ l
2
)
1/2
,
where h, k and l are the Miller indices.
Thin layer chromatography (TLC). The SAXD samples
were checked for purity and radiation damage by thin layer
chromatography (TLC) in a mixture of hexane, diethyl ether
and acetic acid in the ratio 80 : 20 : 1 (v/v/v), using a 20 cm
long and 0.2 mm thick silica plate (Fluka). Spots were
developed by spraying the plate with 2.5% (v/v) phospho-
molybdic acid in sulphuric acid solution (PMOS), followed
by heating. The appearance of two unidentified spots and
another corresponding to oleic acid showed that there was
some degradation of MO. However, comparison with
unexposed samples show that this very small degradation is
not a result of the exposure to X-rays, but rather a result of
the presence of water which leads to hydrolysis of MO [14].
Results
Cubic phases
Cubic liquid crystalline phases with a number of different
structures have been reported [13,15, and references therein].
These are usually grouped into two main types, namely the
discrete and bicontinuous structures. The discrete structure
is also known as the micellar type, since it is constructed
from micellar entities, normal or reversed, arranged in a
cubic lattice. In cubic phases of the bicontinuous category a
surfactant bilayer is associated with an infinite minimal
periodical surface resulting in a structure that is continuous
with respect to both water and amphiphile. These bicontin-
uous phases can also be of the normal or reverse kind [16].
Within the two main groups of cubic structures several
spatial arrangements are possible, leading to a number of
different space groups [13].
In the binary system of MO/water at 25 °C two reversed
bicontinuous cubic phases, belonging to the space groups
Ia3d and Pn3m, are present [17,18]. Upon addition of small
amounts of OG the Pn3m structure is transformed via Ia3d
to an L
a
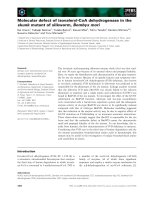
structure. From Fig. 1 it can be inferred that, at
25 °C, the molar ratios between OG and MO (calculated on
the total lipid concentration) needed for inducing the Ia3d
and lamellar phases are in the order of 1 : 90 and 1 : 16,
respectively.
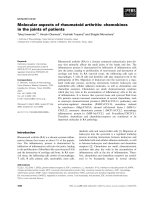
Figure 2 shows partial phase diagrams, where the OG
concentration is plotted against temperature at a constant
MO concentration of 57.8 wt %. The compositions of the
samples studied are found in Fig. 1 (located on an almost
Fig. 1. Section of the ternary MO/OG/
2
H
2
O phase diagram at 25 °C,
showing the location of the samples studied. Pn3m, MO-rich cubic phase
of space group Pn3m; Ia3d, MO-rich cubic phase of space group Ia3d;
L
a
+ Ia3d, lamellar + cubic two-phase area; L
a
, tentative boundary
of the lamellar phase [12].
Ó FEBS 2003 Thermal behaviour of MO-rich MO/OG cubic phases (Eur. J. Biochem. 270)57
straight line in the figure). We assume that a heating rate of
1 °CÆmin
)1
is slow enough to allow for the phase-transitions
to occur, while the cooling rate is set by the equipment. The
cooling was performed to determine whether the initial
structure would reappear on a reasonable time scale, since
cubic structures are prone to be meta-stable. Table 1
summarizes heating scans of SAXD measurements at
different compositions (A–E) with the corresponding lattice
parameters. It can be concluded that the general behaviour
upon heating, in this area of the phase diagram, is to shift
the aggregate structure towards a more curved surface in the
liquid crystalline phase (Fig. 2A). Moreover, the lattice
parameters of both cubic phases tend to decrease with
increasing temperature. For the Ia3d phase a increases with
the OG content, while for the Pn3m structure it seems to
decrease compared to the structure in the binary system [4].
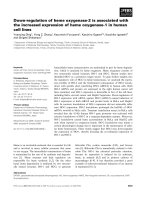
An additional, very strong, peak is observed for sample
A, located between (110) and (111) peaks in the Pn3m
pattern in the temperature range 25–35 °C (Figs 3 and 4B).
Extra peaks are also observed for samples B (weak) and C
(medium) that are located between (220) and (321) peaks in
the Ia3d pattern at temperatures 25–30 °C and 20–35 °C,
respectively. We have not observed any optical anisotropy
in this temperature range for these samples. Upon cooling,
Fig. 2. Temperature vs. composition for the samples A to E as deter-
minedbySAXD.(A) Heating scans at a rate of 1 °Cmin
)1
; (B) cooling
scans at a rate of approx. 5 °CÆmin
)1
. The MO concentration is
approx.58wt%.(d) Pn3m, (black circle containing white cross)
Pn3m + additional peak, (s) Ia3d, (white circle containing black
dot), Ia3d + additional peak, (shaded circle) Ia3d + Pn3m,(shaded
triangle) Ia3d +L
a
.
Table 1. Sample composition and the lattice parameter, a, obtained
upon heating scans. Heating rate 1 °CÆmin
)1
. To ensure that a powder
pattern was obtained, the capillary was rotated with an angular velo-
city of 1.26 radÆs
)1
.
Sample
wt %
MO/OG/
2
H
2
O
T
(°C)
Pn3m
(nm)
Ia3d
(nm)
La
(nm)
A 57.81/0.34/41.85 20 9.66
30 9.64
40 9.50
45 9.20
B 57.81/1.31/40.88 21 14.29
30 14.31
40 13.93
50 13.91
55 8.68 13.81
60 8.46
65 8.48
C 57.44/2.54/40.02 22 15.55
31 15.55
41 14.99
45 15.15
D 57.7/3.37/38.93 21 16.16 4.86
25 16.23 4.81
35 16.08 4.79
40 15.46 4.71
45 14.31 4.62
50 14.90
E 57.95/4.20/37.85 21 18.25 4.86
25 17.92 4.88
35 17.86 4.84
45 15.55 4.69
50 15.55 4.64
55 14.31
F 44.77/0.30/54.93 21 9.78
30 9.84
40 9.68
45 9.38
G 44.67/1.14/54.19 21 10.89
30 10.76
40 10.52
45 10.03
H 44.54/2.29/53.17 21 11.12 17.15
30 17.30
40 17.06
45 16.95
58 G. Persson et al.(Eur. J. Biochem. 270) Ó FEBS 2003
these metastable structures do not occur in these three
samples, and no unexpected peak occurs either in the
heating scans of samples D and E.
The origin of the extra peaks observed is unclear and
we can only speculate at their origin. One plausible
explanation is that they result from another cubic
Fig. 3. Diffractograms of the samples (A–E) shown in Fig. 1. (a) Heating rate of 1 °CÆmin
)1
, (b) cooling rate of approx. 5 °CÆmin
)1
.
Ó FEBS 2003 Thermal behaviour of MO-rich MO/OG cubic phases (Eur. J. Biochem. 270)59
structure. The energy needed for the Pn3m–Ia3d phase
transition is very small [3].
A peculiarity was observed upon cooling the samples C
and D where Pn3m and Ia3d patterns coexist instead of the
Ia3d and lamellar patterns observed in the heating scans
(Fig. 3 and Table 2). We have not investigated whether a
lamellar structure will appear at sufficiently long waiting
time. All these observations are most probably caused by
the notorious problem of reaching a true thermodynamic
equilibrium for bicontinuous cubic phases [13].
Fig. 3. (Continued).
60 G. Persson et al.(Eur. J. Biochem. 270) Ó FEBS 2003
In samples D and E a rather drastic broadening in the line
shape of the peaks indexed to the Ia3d structure occurs just
below 40 °C, indicating the occurrence of a more disordered
structure. Also, the lattice parameter jumps to a smaller
value in this region (cf. Figure 3 and Table 1).
Finally, visual as well as microscope observations, show
differences in the optical appearance of the two cubic
phases, one being slightly turbid (Pn3m), while the other one
is completely clear (Ia3d). As a final point it could also be
mentioned that the transition enthalpies between the
different cubic structures are so small that they are very
difficult to observe by conventional DSC [3].
Cubic phases in excess water
In the binary system of MO/water only the Pn3m cubic
phase is found in equilibrium with excess water. At 25 °C
this structure is retained upon addition of small amounts
OG (samples F–H). The composition of the excess aqueous
solution has not been determined, but from the ternary
phase diagram it is obvious that the aqueous phase contains
very little OG, referred to hereafter as excess water [12]. As
in the previous paragraph, Fig. 1 shows the sample locations
in the ternary system, while the compositions and corres-
ponding lattice parameters for the heating and cooling scans
are summarized in Tables 1 and 2. Upon heating, the Pn3m
structure is retained in sample F and G, while in sample H
the structure is changed to an Ia3d space group (Figs 5 and
6). However, upon cooling the structure returned to the
Pn3m structure at 35–30 °C, which is a higher transition
temperature than obtained from the heating scan, again
pointing to the difficulty of obtaining a true thermodynamic
equilibrium for bicontinuous cubic phases.
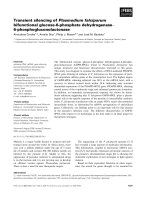
Fig. 4. Diffractogram of sample A showing (A) without and (B) with the
extra peak. The dots above the peaks indicate the calculated positions
obtained for the Pn3m structurebasedonthefirstpeakinthedif-
fractogram.
Table 2. Sample composition and the lattice parameter, a, obtained
upon cooling scans. Cooling rate approx. 5 °CÆmin
)1
. To ensure that a
powder pattern was obtained, the capillary was rotated with an
angular velocity of 1.26 radÆs
)1
.
Sample
wt %
MO/OG/
2
H
2
O
T
(°C)
Pn3m
(nm)
Ia3d
(nm)
La
(nm)
A 57.81/0.34/41.85 45 9.15
40 9.09
30 9.12
25 9.11
B 57.81/1.31/40.88 64 8.40
54 8.44
47 8.55
33 8.64
30 8.74 13.19
26 9.00 13.91
20 14.16
C 57.44/2.54/40.02 45 15.22
39 15.27
34 9.71 15.08
20 9.71 15.13
D 57.7/3.37/38.93 45 15.04
40 9.67 14.66
34 9.55 14.93
28 9.62 14.84
23 10.30 15.31
18 15.50
E 57.95/4.20/37.85 52 14.43
43 14.43
31 14.56
25 14.49
18 14.95 4.76
F 44.77/0.30/54.93 44 9.23
40 9.19
30 9.32
21 9.58
G 44.67/1.14/54.19 45 9.83
41 9.89
31 9.75
19 9.90
H 44.54/2.29/53.17 43 16.75
40 16.69
34 10.66 16.69
29 10.68 15.31
18 10.48
Ó FEBS 2003 Thermal behaviour of MO-rich MO/OG cubic phases (Eur. J. Biochem. 270)61
Similarly to the results obtained for the Ia3d cubic phase
the lattice parameters for the Pn3m cubic phase in
equilibrium with excess water increase with the OG content.
Furthermore, as for the cubic phases without excess water
the lattice parameters tend to decrease with increasing
temperature. Also, for the samples with excess water,
additional peaks appear at specific temperature intervals
upon heating, while they are absent when cooling. The
temperature range of these extra peaks lies between 30 and
40 °C for sample G and H, while sample F shows a wider
temperature range. The additional peak is quite strong in
samples F and G positioned between (110) and (111) in the
Pn3m pattern, while in sample H it is very weak occurring
between (220) and (321) in the Ia3d pattern.
Discussion
The aim of this work is to investigate how the structure and
thermodynamic stability of the cubic phases formed by MO
in water is affected by the presence of OG, which is
commonly utilized to solubilize or extract membrane
proteins from native membranes. The OG micellar solution
containing the membrane protein may hold quite a high
concentration of the surfactant. In this study we have shown
that the cubic phases in fact are very sensitive to relatively
small amounts of OG. An increase in the OG concentration
results in a decrease in the absolute value of the curvature of
the lipid bilayer, building up the cubic phase structure. This
conclusion is drawn from the observation that upon addition
of OG an increase in the size of the unit cell within a one-
phase area arises, and from the order of occurrence of the
phases formed. The reason for this change in the curvature
can be understood in terms of a simple geometric considera-
tion of the shape of the molecules involved [19–21]. MO,
forming reversed nonlamellar phases, is considered to be
wedge shaped having quite a small glycerol head group, while
the C18 hydrocarbon chain is rather bulky with its double
bond between C9 and C10. On the other hand, the highly
water soluble OG has a more conical shape with the base
located at the glucose head group and a relatively short
hydrocarbon chain with only eight carbons, yielding a
packing parameter of less than one at high water contents
[21]. The hydrocarbon chain of OG is of similar length as the
distance from the head group to the double bond in MO.
Thus, for an OG molecule present in the MO bilayer its head
group will be located at the bilayer interface together with the
MO head groups, while the hydrocarbon tail of OG
penetrates deeper into the bilayer. It will reach approximately
down to the MO double bond. The combined MO-OG
Ômolecular entityÕ will attain a shape of a cylinder, resulting in
a packing parameter that is closer to one. Moreover, the
flexibility possessed by a bilayer containing MO only will be
reduced, resulting in a preference for an arrangement of a
ÔflatÕ bilayer, eventually forming an L
a
phase.
Similarly, the effect of an increase in temperature on the
phase behaviour can be understood with this simple model
based on the molecular shape. Within a region of a cubic
phase in the diagram an increase in the temperature
generally results in a decrease in the size of the unit cell.
This is interpreted to be an effect of an increase in the
curvature of the lipid bilayer affected by the increased
mobility of the hydrocarbon chains together with a possible
decrease in the hydration of the glucoside head groups (cf.
the nonionic alkylethylenoxide surfactants [22]), i.e. the lipid
molecules will attain a more wedge-like shape. To put it
another way, with increasing temperature the bilayer gets
thinner, with the minimal and the parallel surfaces of the
polar/nonpolar interface approaching each other, again
resulting in an increased wedge shape of the lipids.
Previously, Ai and Caffrey investigated the effect of a
different sugar lipid, n-dodecyl-b-
D
-maltoside (DM), on MO
cubic phases [23], and it seems useful to compare our results
with their study. They showed that the addition of DM
converts the Pn3m cubic phase to an L
a
phase via an Ia3d
structure. For both OG and DM the order in the phases
formed upon addition of the surfactants is similar. However,
on a molar basis, the stability of the liquid crystalline phases is
higher for additions of OG than of DM, as can be seen when
comparing the fraction of each surfactant necessary to induce
phase transitions. At 25 °C, the ratios between the sugar
surfactant and MO, where an Ia3d structure was formed, is in
the order of OG/MO ¼ 1 : 90 and DM/MO ¼ 1 : 170,
while for the lamellar structure the appropriate fractions
between the surfactant and MO are OG/MO ¼ 1:16or
DM/MO ¼ 1 : 21. Note however, that these ratios refer to
total concentrations and not to the actual fraction of OG or
DM in the bilayer, since there is a large difference in critical
micellar concentration for these surfactants (25 m
M
for OG
[24]; 0.15 m
M
for DM [25]). Therefore, it is fair to assume that
there is somewhat less OG incorporated in the MO bilayer
than these ratios indicate. However, this is probably of minor
importance in a comparison of the effect between the two
sugar surfactants.
Furthermore, the cubic Ia3d and L
a
phases containing
OG have a higher thermal stability than if DM is present in
the phases, i.e. the temperature at which the phase
boundaries shifts towards higher OG concentration
(Fig. 2A). Thus, with OG the Ia3d phase is stable up to
about 50–55 °C, while for DM the Ia3d-to-Pn3m phase
transition occurs at about 40 °C. We have not determined
how OG affects the two-phase area of water/Pn3m.The
effect of OG and DM on the phase behaviour of the MO-
system can be explained by a consideration of the effective
packing parameter, resulting upon addition of the sugar
surfactant. The maltoside head group is a disaccharide and
therefore the DM head group is larger than that of OG with
a monosaccharide head group, but because the hydrocar-
bon tail is longer for DM the packing parameter is closer to
one than for OG. This difference is also reflected in the
binary phase diagrams of DM/water [26] and OG/water
[27]. In the DM/water system only micelles and a lamellar
phase is present, while in the OG system both hexagonal
and bicontinuous cubic structures as well as micelles and a
lamellar phase are formed at room temperature. When OG
is present in the MO bilayer, the shorter tail will only affect
the part of the MO molecule from the head group to the
double bond, leaving the rest of the MO hydrocarbon chain
free, while introducing DM into the bilayer will affect the
packing more, as the longer tail will reach approximately to
the centre of the bilayer. Thus, considering only the
hydrocarbon tail, addition of DM should not be very
different from adding another MO molecule, but the
properties of the head groups are slightly different and
must also be considered. A study of the effects of maltose
62 G. Persson et al.(Eur. J. Biochem. 270) Ó FEBS 2003
Fig. 5. Diffractograms of the samples with excess water (F–H) shown in Fig. 1. (a) Heating rate of 1 °CÆmin
)1
; (b) cooling rate of approx. 5 °CÆmin
)1
.
Ó FEBS 2003 Thermal behaviour of MO-rich MO/OG cubic phases (Eur. J. Biochem. 270)63
and glucose on the Pn3m phase of the MO system shows
that both sugars are tolerated to rather high concentrations,
but the lattice parameter decreases with increasing sugar
concentration. The lattice parameter decreases more rapidly
for maltose [23], indicating an effect on the hydration of the
cubic phase to a larger extent than for glucose. It is thus
obvious that the longer hydrocarbon chain and the larger
head group of DM are the causes for the stronger effect on
the phase behaviour for this surfactant than for OG.
Therefore, DM exhibits a larger effect at low concentrations,
and shows a stronger influence on the temperature depend-
ence on the cubic Ia3d and the lamellar phases than OG.
Conclusions and final remarks
In this report, we have investigated the thermal behaviour of
the MO-rich cubic phases found in the ternary phase
diagram of MO/OG/
2
H
2
O. It is shown that only small
amounts of OG (OG : MO ¼ 1 : 16) are sufficient to
transform the cubic structure to a lamellar one. Addition
of OG to the Pn3m cubic phase converts it to an Ia3d
structure in analogy with previous results on the MO system
containing a different sugar surfactant [23].
The results obtained in this study on the stability of the
cubic phases in the ternary lipid system may be of
importance for getting a better understanding of the
crystallization process of membrane proteins. In particular,
it is of great importance to realize that for the OG-solubilized
proteins added to the cubic phase, the OG content is limited
to a few percent to keep a stable cubic phase. If the proteins
are reconstituted in the lipid bilayer, as suggested by the
proposed mechanism [5], the large protein molecules will
also affect the phase behaviour in such a way that a more
planar lipid aggregate is created. However, the effect may
not be large enough to change the phase behaviour of the
entire sample, since the total protein concentration is quite
low, but locally the effect may be dramatic, which in turn
may affect the crystallization process.
Acknowledgements
We wish to thank the local contacts at the Austrian Academy SAXS
station at the ELETTRA synchrotron, Trieste, Italy: H. Amenitsch,
M. Rappoult, M. Strobl and S. Bernstorff for their support during the
experiments. Professor Laggner is gratefully acknowledged for granting
us the beam time. Mid Sweden University and The Swedish Research
Council are acknowledged for financial support.
References
1. The protein data bank, />2. Landau, E. & Rosenbusch, J. (1996) Lipidic cubic phases: a novel
concept for the crystallisation of membrane proteins. Proc. Natl
Acad. Sci. USA 93, 14532–14535.
3. Hyde, S.T., Andersson, S., Ericsson, B. & Larsson, K. (1984) A
cubic structure consisting of a lipid bilayer forming an infinite
periodic minimum surface of the gyroid type in the glycer-
olmonooleate-water system. Z. Kristallogr. 168, 213–219.
4. Qiu, H. & Caffrey, M. (2000) The phase diagram of the mono-
olein/water system: metastability and equilibrium aspects. Bio-
materials 21, 223–234.
5. Nollert, P., Qiu, H., Caffrey, M., Rosenbusch, J.P. & Landau,
E.M. (2001) Molecular mechanism for the crystallisation of bac-
teriorhodopsin in lipidic cubic phases. FEBS Lett. 504, 179–186.
6. Nollert, P., Royant, A., Pebay-Peyroula, E. & Landau, E. (1999)
Detergent-free membrane protein crystallisation. FEBS Lett. 457,
205–208.
7. Kolbe, M., Besir, H., Essen, L.O. & Oesterhelt, D. (2000) Struc-
ture of the light-driven chloride pump halorhodopsin at 1.8 A
˚
resolution. Science 288, 1390–1396.
8. Pebay-Peyroula, E., Rummel, G., Rosenbusch, J.P. & Landau,
E.M. (1997) X-ray structure of bacteriorhodopsin at 2.5 Ang-
stroms from microcrystals grown in lipidic cubic phases. Science
277, 1676–1681.
9. Cherezov, V., Fersi, H. & Caffrey, M. (2001) Crystallisation
screens: Compatibility with the lipidic cubic phase for in meso
crystallisation of membrane proteins. Biophys. J. 81, 225–242.
Fig. 6. Temperature vs. composition diagrams of samples F to H as
determined by SAXD. (A) Heating scans at a rate of 1 °CÆmin
)1
;(B)
cooling scans at a rate of approx. 5 °CÆmin
)1
. The MO concentration is
approx.45wt%.(d) Pn3m, (black circle containing white cross)
Pn3m + additional peak, (s) Ia3d, (white circle containing black
cross) Ia3d + additional peak, (shaded circle) Ia3d + Pn3m,(shaded
triangle) Ia3d +L
a
.
64 G. Persson et al.(Eur. J. Biochem. 270) Ó FEBS 2003
10. Landau, E., Rummel, G., Cowan-Jacob, S.W. & Rosenbusch, J.P.
(1997) Crystallisation of a polar protein and small molecules from
the aqueous compartment of lipidic cubic phases. J. Phys. Chem. B
101, 1935–1937.
11. Angelov, B., Ollivon, M. & Angelova, A. (1999) X-ray study of the
effect of the detergent octyl glucoside on the structure of lamellar
and nonlamellar lipid/water phases of use for membrane protein
reconstitution. Langmuir 15, 8225–8225.
12. Persson, G., Edlund, H. & Lindblom, G. (2003) Phase behaviour of
the 1-monooleoyl-rac-glycerol/n-octyl-b-d-glucoside/water–system.
Progr. Colloid. Polym. Sci., in press.
13. Lindblom, G. & Rilfors, L. (1989) Cubic phases and isotropic
structures formed by membrane lipids – possible biological rele-
vance. Biochim. Biophys. Acta 988, 221–256.
14. Caboi, F., Amico, G.S., Pitzalis, P., Monduzzi, M., Nylander, T.
& Larsson, K. (2001) Addition of hydrophilic and lipophilic
compounds of biologial relevance to the monoolein/water system.
I. Phase behaviour. Chem. Phys. Lipids 109, 47–62.
15. Fontell, K. (1990) Cubic phases in surfactant and surfactant-like
lipid systems. Colloid Polym. Sci. 268, 264–285.
16. Garstecki, P. & Holyst, R. (2002) Scattering patterns of self-
assembled cubic phases. 1. The model. Langmuir 18, 2519–2528.
17. Lindblom, G., Larsson, K., Johansson, L., Fontell, K. & Forse
´
n,
S. (1979) The cubic phase of monoglyceride-water systems.
Arguments for a structure based upon lamellar units. J. Am.
Chem. Soc. 101, 5465–5470.
18. Longley, W. & McIntosh, T.J. (1983) A bicontinuous tetrahedral
structure in a liquid-crystalline lipid. Nature 303, 612–614.
19. Tartar, H.V. (1955) A theory of the structure of the micelles of
normal paraffin chain salts in aqueous solution. J. Phys. Chem. 59,
1195–1199.
20. Tanford, C. (1980) The Hydrophobic Effect: Formation of Micelles
and Biological Membranes, 2nd edn. John Wiley, New York, USA.
21. Israelachvili, J.N., Mitchell, D.J. & Ninham, B.W. (1976) Theory
of self-assembly of hydrocarbon amphiphiles into micelles and
bilayers. J. Chem. Soc. Faraday Trans. II 72, 1525–1568.
22. Jo
¨
nsson, B., Lindman, B., Holmberg, C. & Kronberg, B. (1998)
Surfactants and Polymers in Aqueous Solution, 1st edn. John Wiley
& Sons Ltd, Chichester, UK.
23. Ai, X. & Caffrey, M. (2000) Membrane protein crystallisation in
lipidic mesophases: Detergent effects. Biophys. J. 79, 394–405.
24. Shinoda, K., Yamanaka, T. & Kinoshita, K. (1959) Surface che-
mical properties in aqueous solutions of non-ionic surfactants:
octylglycolether,a-octyl glyceryl ether and octyl glucoside.
J. Phys. Chem. 63, 648–650.
25. Drummond, C.J., Warr, G.G., Grieser, F., Ninham, B.W. &
Evans, D.F. (1985) Surface properties and micellar interfacial
microenvironment of n-dodecyl b-
D
-maltoside. J. Phys. Chem. 89,
2103–2109.
26. Warr, G.G., Drummond, C.J., Grieser, F., Ninham, B.W. &
Evans, D.F. (1986) Aqueous solution properties of nonionic
n-dodecyl b-
D
-maltoside micelles. J. Phys Chem. 90, 4581–4586.
27. Nilsson, F. & So
¨
derman, O. (1996) Physical-chemical properties of
the n-octyl b-
D
-glucoside/water system. A phase diagram, self-
diffusion NMR, SAXS study. Langmuir 12, 902–908.
Supplementary material
The following material is available from http://www.
blackwellpublishing.com/products/journals/suppmat/EJB/
EJB3361/EJB3361sm.htm
Table 1. Structures, indices and spacings obtained for some
temperatures during heating.
Ó FEBS 2003 Thermal behaviour of MO-rich MO/OG cubic phases (Eur. J. Biochem. 270)65