EFFICIENCY AND DISTRIBUTION IN CONTRACT FARMING: THE CASE OF INDIAN POULTRY GROWERS pdf
Bạn đang xem bản rút gọn của tài liệu. Xem và tải ngay bản đầy đủ của tài liệu tại đây (326.33 KB, 50 trang )
i
ABSTRACT
This paper is an empirical analysis of the gains from contract farming in the case
of poultry production in the state of Andhra Pradesh in India. The paper finds that
contract production is more efficient than noncontract production. The efficiency surplus
is largely appropriated by the processor. Despite this, contract growers still gain
appreciably from contracting in terms of lower risk and higher expected returns.
Improved technology and production practices as well as the way in which the processor
selects growers are what make these outcomes possible. In terms of observed and
unobserved characteristics, contract growers have relatively poor prospects as
independent growers. With contract production, these growers achieve incomes
comparable to that of independent growers.
Keywords: Contract Farming, Contracting, Poultry, Vertical Integration
ii
TABLE OF CONTENTS
1. Introduction 1
2. The Poultry Industry in Andhra Pradesh 3
3. Contracting in Poultry Production 4
4. Data and Descriptive Statistics 5
5. Is Contract Production more Efficient? 11
6. Do Contract Growers Earn More than Noncontract Growers? 18
7. Correcting for Self-Selection 20
8. Risk Shifting from Contracting 27
9. Concluding Remarks 32
References 35
iii
LIST OF TABLES
Table 1: Access to Infrastructure 6
Table 2: Characteristics of Poultry Producers 7
Table 3: Input Use by Poultry Producers: Averages Per Production Cycle 8
Table 4: Output and Revenues: Averages Per Production Cycle 9
Table 5: Input Sharing: Averages per Production Cycle 10
Table 6: Cost structure of Poultry Production: Averages per Production Cycle 12
Table 7: Cost function of Poultry Producers 13
Table 8: Feed-Conversion Ratios 17
Table 9: Returns to Poultry Producers: Average Income Per Production Cycle
(Rs/Kg) 22
Table 10: Income Equation: Ordinary Least Squares 23
Table 11: OLS estimates of Treatment Effects Under Varying Interest Rates 24
Table 12: Probit Equation: Factors Influencing Participation in Contracting 26
Table 13: Income Equation: Instrument Variables 26
Table 14: IV estimates of Treatment Effects Under Varying Interest Rates 27
Table 15: Variability of Returns 28
LIST OF FIGURES
Figure 1: Cost Function for Noncontract Producers 13
Figure 2: Cost Function for Contract Producers 14
1
EFFICIENCY AND DISTRIBUTION IN CONTRACT FARMING:
THE CASE OF INDIAN POULTRY GROWERS
Bharat Ramaswami
1
, Pratap Singh Birthal
2
, and P.K. Joshi
3
1. INTRODUCTION
A feature of low productivity agricultural economies is the dominance of
subsistence production especially among small growers. Even though commercialization
can yield substantial gains, the transition from subsistence farming to market driven
production is fraught with perils (von Braun and Kennedy, 1994). First, market volatility
is an enduring feature of commodity and livestock markets. This makes cultivation of
cash crops and livestock risky. Second, as incomes grow, consumer taste shifts in favor
of processed foods. Small farmers are too remote from consumers to track their
preferences. Third, small farmers typically lack capital and technical expertise to
undertake cash crop and livestock production, which are usually more input intensive
than subsistence crops. These problems are serious enough that they could effectively
choke off participation in markets by all except the large farmers.
In principle, contract farming could be an institutional arrangement that enables
farmers to access markets. While contractual arrangements can vary by crop and by
country, contracting is a form of joint production where the grower supplies tools, land,
labor and management while the processor supplies technical assistance, some inputs
such as seeds or pesticides and undertakes to buy the grower’s output at a pre-determined
1
Professor, Indian Statistical Institute, New Delhi, India.
2
National Fellow, National Centre for Agricultural Economics and Policy Research, New Delhi, India.
3
Research Fellow, IFPRI New Delhi Office, New Delhi, India.
2
price. From the point of view of the processor, this arrangement ensures raw material
supplies of the desired quality (subject, of course, to production uncertainty). From the
point of view of the grower, such an arrangement provides an assured market and hence
reliable income (to the extent permitted by production risks). Without a contract, risks
would be too much and few small growers would want to produce these crops. For this
reason, Glover (1987) described contract farming as an institutional arrangement that
combined the advantages of plantations (quality control, coordination of production and
marketing) and of smallholder production (superior incentives, equity considerations).
These theoretical benefits, notwithstanding, contract farming has been
controversial and has been criticized for being exploitative (Little and Watts, 1994).
Between the giant corporation and the small farmer, bargaining power surely lies with the
former. Also, in practice, growers have encountered problems with respect to
manipulation of quality standards, poor technical assistance, and sometimes plain
cheating and deliberate default (Glover, 1987). As a result, Glover (1987) concluded that
research must “systematically examine successes and failures and from then draw
generalizations about the conditions under which CF (contract farming) can operate
profitably and to the benefit of small farmers” (p 447).
Taking this imperative seriously, this paper is an empirical analysis of the gains
from contract farming, to both farmers and processors, in the case of poultry production
in the state of Andhra Pradesh in India. The literature on contract farming is largely
anecdotal possibly because of lack of data. Knoeber and Thurman (1995) and Warning
and Key (2002) are two exceptions. Knoeber and Thurman analyzed the redistribution of
3
risk because of contracting in hog production in U.S.A. Warning and Key estimated the
change in producer incomes from contracting by peanut producers in Senegal. Here we
draw upon a survey of contract and noncontract poultry producers to analyze both of
these issues. Neither of these papers, however, considers the gains to the processors from
contracting.
2. THE POULTRY INDUSTRY IN ANDHRA PRADESH
The poultry industry has seen rapid growth in India. Between 1980/81 and
1998/99, poultry meat production increased about 3 times from 250,000 tons to about
770,000 tons.
4
Correspondingly, its share of total meat output rose from 20% to 27%.
During the same period, egg production increased from 10,000 to 29,000 million. Andhra
Pradesh is the leading poultry meat producing state within India. It accounts for over
one-fifth of poultry meat as well as egg production in the country. The growth of poultry
industry in Andhra Pradesh has been even more remarkable than the national growth
rates. For the period 1980/81 to 1998/99, poultry meat production increased by 4.5 times
while egg production rose by 3.5 times. About 30% of its broiler output and 15% of egg
output are exported to other states within India.
The impressive growth in the poultry meat industry is the result of technological
breakthroughs in breeding, feeding and health, and sizeable investments from the private
sector. The expansion in supply has been spurred by rising incomes and has resulted in
lower poultry prices in south India where much of the growth has occurred (USDA,
4
The USDA estimates poultry production in 2002 to be of the order of 1.4 million tons, which is higher
than the official estimates (USDA, 2004).
4
2004). The poultry sector is, however, highly prone to production and market risks,
which periodically affect the profitability of broiler production particularly on the small
farms. These risks also threaten the profitability of the industry engaged in breeding of
chicks and manufacturing of feed, vaccines and medicines. In order to minimize the risks
to the producers and sustain the profitability of the industry, some large poultry firms (for
example, Venkateshawara Hatcheries Ltd., Suguna Hatcheries, Pioneer Hatcheries,
Diamond Hatcheries, etc.) began integrating their activities with that of broiler
production through the institution of contract farming as early as in late 1980s. A large-
scale integrated operation would typically include the raising of grandparent and parent
flocks, rearing of day-old-chicks, feed milling, provision of veterinary services and
contract production. Such integrators are most common in southern and western regions
of the country (USDA, 2004).
3. CONTRACTING IN POULTRY PRODUCTION
In a poultry contract, hatcheries provide day-old chicks, feed and medicines to contract
growers. The contract growers supply land, labor and other variable inputs (like
electricity). At the end of the production cycle, the farmer receives a net price (by
weight) that is pegged to an industry price set by a group of hatcheries (not the retail
price). The industry price fluctuates within a narrow range and is a lot more stable than
the retail price. Thus, the farmer receives considerable price insurance. For sharp
upward deviations of the retail price from the industry price, farmers receive an incentive.
5
This practice presumably lessens the incentives to default on the part of growers and
reflects the competition from the non-contract sector.
The farmer is insured for mortality rates up to 5%. Beyond that the farmer bears
the risk of loss. This controls moral hazard and provides incentives for farmers to supply
their best effort. A company representative who sorts out problems especially regarding
disease visits the farmer daily. According to company accounts, the processor spends
time and resources in screening producers for reputation and prior experience.
The broiler contract is an instance of a “production management” contract where
the processor supplies inputs and extension, advances credit (in kind), provides price
insurance and monitors grower effort through frequent inspections.
5
The detailed
monitoring is because of the considerable credit advanced by the processor that provides
more than 90% of the cost of production in terms of the value of inputs. Because the
frequent monitoring controls for moral hazard, it is also conducive to insurance. The
frequency of contact also would mean that the processor incurs considerable transactions
costs.
4. DATA AND DESCRIPTIVE STATISTICS
The data was collected from a primary field survey of contract and non-contract
producers. The survey was undertaken in the year 2002-03 to collect the required
information for the year 2001-02. The sample producers were interviewed to collect the
required data, using pre-tested questionnaires, specifically prepared for each case study.
5
The terminology is taken from Minot (1986) who classified contracts according to the intensity of contact
between the processor and the farmer. The production management contract involves the most contact.
6
Survey data was based on recall memory of the households but it was also supplemented
with the records maintained by both contract and non-contract producers. Detailed
information was collected about the socio-economic characteristics of the sample
farmers, production-portfolio, item-wise and cycle-wise cost of broiler production, yield
levels, labor use, and cost of marketing and acquiring information for various activities.
A sample of 25 contract producers and an equal number of non-contract producers were
randomly selected from 10 villages of Rangareddy, Mehboobnagar and Nalagonda
districts in Andhra Pradesh. A majority of the contract farmers were associated with a
leading poultry integrator.
The survey instrument consisted of four parts. In the first part, information about
village level infrastructure was collected. This consisted of distance from various
infrastructure facilities such as roads, railways, telephone, post office, regional rural
bank, animal feed shop among others. Table 1 compares the availability of infrastructure
across contract and noncontract farmers. The big difference between (the sample of)
contract and noncontract farmers is the better access of noncontract farmers to credit
facilities whether it is cooperative credit society or the regional rural bank or the primary
dairy cooperative society.
Table 1—Access to Infrastructure
Item Noncontract Contract
Distance to urban area 28.36 17.16
Distance to coop credit society 0.43 2.48
Distance to regional rural bank 1.2 6.84
Distance to primary dairy cooperative society 0.48 8.5
Distance to vet. Hospital .8 0.71
7
The second part of the survey elicited information about the farmer including age,
schooling, experience in broiler farming and previous occupation. Table 2 summarizes
the differences between contract and noncontract farmers in terms of individual
characteristics. Notice that the sample of noncontract farmers is twice as experienced,
slightly more educated and yet a little younger than contract farmers. The sample of
noncontract farmers also contains a substantially higher proportion of farmers who are
specialized in poultry farming. The noncontract farmers are also those who have
migrated from agriculture related occupations compared to contract farmers where the
proportion of farmers with non-agriculture related occupations is large. Examples of
such previous occupations include in sectors such as pharmaceuticals, electrical
hardware, cement, police, clothes and wine retailing.
Table 2—Characteristics of Poultry Producers
Item Noncontract Contract
Experience in poultry 9.8 4.9
Age 36 39
Years of schooling 11.6 10.9
Proportion of farmers whose main occupation is poultry 72 36
Proportion of farmers whose subsidiary occupation is
poultry
28 64
Proportion of farmers whose earlier occupation was in
agriculture/poultry/ dairy/ agricultural labour/ agriculture-
related business
75 58
Proportion of farmers whose earlier occupation was in
non-agriculture
25 42
The third part of the survey collected information about the inputs, outputs and
revenues from the last 6 production cycles of each grower. Table 3 presents information
about the levels of input use per production cycle for contract and noncontract farmers.
Note that the numbers are averaged twice – first over production cycles for each grower
8
and then across all growers within the class of contract and noncontract farmers. The
production process in poultry consists of transforming baby chicks into fully-grown birds.
Besides chicks, the inputs into this process are feed, medicine, labor and time.
Production is not instantaneous. For this reason, productivity measures have to be
normalized with respect to time as well. With respect to capital assets, contract farmers
have more equipment as measured by brooders, feeders and water facilities but operate in
a smaller area.
Table 3—Input Use by Poultry Producers: Averages Per Production Cycle
Item Noncontract Contract
Time: Cycle length (days) 48.4 42.6
Litter, quantity (quintals) 13.2 17.8
Litter , value (Rs.) 991 1,375
No of chicks 6,891 8,149
Chicks, value (Rs. ) 70,217 96,558
Feed qty (quintals) 276 277
Medicine + Feed, Value (Rs.) 244,615 307,246
Vaccinations per cycle 2.53 3
Vaccination, cost 6,174 8,148
Veterenian fees (Rs.) 268 566
Labour cost (Rs.) 5,076 6,152
Family labour (male) (Days) 26 23
Family Labour (female) (Days) 4 3.2
Hired labour (male) (Days) 76 104
Hired labour (female) (Days) 37 33
Electricity, value (Rs.) 2,930 2,925
Bulbs, (Rs.) 335 274
Disinfectants (Rs.) 861 993
Total shed area (square feet) per
grower
9501 6335
No. of Brooders per grower 12 24
No. of Feeders per grower 158 175
No. of borewells per grower 0.36 0.6
No. of overhead tanks per grower 0.72 0.68
9
From table 3, it can be seen that noncontract farmers have longer production
cycles, lower flock sizes and correspondingly spend less on medicine, feed, vaccination,
veterinarian fees and labor cost. Noncontract farmers depend much more on family labor
than contract farmers. Medicines and feed is the single largest item of variable cost.
Interestingly, even though noncontract growers manage lower flock sizes, they use
almost as much quantity of feed as the contract growers.
Table 4 compares the outputs and revenues (from bird sales) of contract and
noncontract producers across all production cycles. As contract producers have larger
flock sizes, their output is also larger whether measured by the number of birds or the
total weight of birds sold. However, the average weight of a bird is pretty much the same
across contract and noncontract growers. The average revenues per kg of bird are much
lower for contract farmers reflecting the netting out of input costs by the processor.
6
Table 4—Output and Revenues: Averages Per Production Cycle
Noncontract Contract
Output: # of birds 6583 7808
Mortality: # of birds 302 388
Average total weight of birds sold (Kgs) 12105 13638
Average Weight per bird, Kgs 1.87 1.87
Revenues from bird sales (Rs.) 355,732 37,217
Average Revenues/Kg of bird sold 29.1 2.62
6
In the table, the average revenue per kg of bird is slightly different from the ratio of average revenues and
average weight of the flock. This is because the former is the average of the ratio of revenue per kg of bird
across production cycles and producers while the latter is the ratio of averages of total revenue and total
flock weight.
10
The final section of the survey is relevant only to contract farmers and it obtained
information about the contract between the producer and the processor. In particular, this
section contains information about the nature of input sharing between the producer and
the processor. As noted in the earlier section, processors supply chicks, medicine, feed
and veterinary services. Growers supply land, buildings, labor, and other variable inputs
such as electricity and disinfectants. Using the information on input sharing, Table 5
computes the total value of variable inputs and the value of inputs supplied by the
grower. For the farmers not on contract, the two figures are the same. But this is not so
for contract growers. For them, the processor supplies most of the inputs measured in
value terms. On average, the out of pocket expenses for inputs for contract farmers is
less than 3% of total input costs.
Table 5—Input Sharing: Averages per Production Cycle
Value of all inputs (Rs. ) 331,468 424,200
Value of inputs supplied by
farmer (Rs.)
331,468 12,249
11
5. IS CONTRACT PRODUCTION MORE EFFICIENT?
In this section, we consider the production efficiency of contract farming relative
to noncontract production. We evaluate production efficiency from the point of view of
the processor. As a processor has the choice of contracting with growers or procuring the
bird from noncontracted growers, contract production should reduce processor’s costs if
it is to be observed. The efficiency of contract production is therefore evaluated relative
to the production costs of independent growers.
Costs in contract production could be lower than in noncontract production in two
distinct ways. First, because of technology and management practices brought by the
processor, contract production could be more efficient than noncontract production.
Second, if the processor can access some inputs such as insurance and credit at lower cost
than growers, then contract production could be cheaper than noncontract production
even if production efficiency is unchanged. While our data set lacks evidence on credit
costs, it is not clear that even if information on differential credit costs were available,
whether it would be appropriate to count such savings as due to contract production.
Interest arbitrage possibilities exist even in the absence of contract production and such
gains are realized by the creditors of noncontract growers. Therefore, from an economy
wide point of view, it is the cost reduction from better technology and production
practices that should be counted as efficiency gain.
12
Table 6 displays the major components of production costs in both modes of
production.
7
It can be seen that the cost structure is comparable across the two
production systems. Feed, medicine and veterinary services accounts for about 75% of
total variable cost. The expenditure on chicks is about 20-22% of cost while other
variable costs such as labor and electricity constitute only 3% of total costs.
Table 6—Cost structure of Poultry Production: Averages per Production Cycle
NonContract Contract
Chicks, value (Rs.) 70,217 (20%) 96,558 (22.5%)
Feed & Medicines (including
vaccinations and veterinarian
fees)
251,058 (77%) 315,959 (74.5%)
Labor, electricity & other inputs 9,203 (3%) 10,344 (3%)
Total 331,468 424,200
As the cost of poultry production is primarily the cost of chicks and feed, the
technology is characterized by constant costs. Table 7 displays the results of regressing
the total variable cost on total output (measured in kgs). Recall the data set consists of
observations from up to 6 production cycles for 25 contract and 25 noncontract growers.
Thus, the error term will contain a producer-specific component. To take that into
account, all standard errors are corrected for heteroskedasticity as well as dependence
stemming from the correlation of errors from the production cycle of a particular
producer.
8
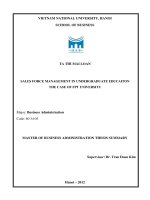
The regression is done separately for contract and non-contract producers.
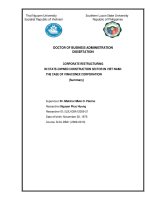
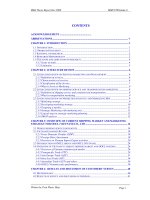
The predicted value from these regressions is graphed against the dependent variable in
Figures 1 and 2.
7
Note we are considering only variable inputs.
8
These are simply the Huber-White standard errors corrected for correlation within clusters (Rogers, 1993,
Wooldridge, 2002). Here a cluster consists of observations from different production cycles for a particular
producer.
13
Table 7—Cost function of Poultry Producers
Dependent Variable: Variable cost per production cycle
Variable Non-Contract Contract
Constant 6635 (2.17) -11192 (-1.45)
Output (kgs) 26.28 (110) 30 (36)
2
R
0.983 0.98
# Observations 145 140
t-statistics in parentheses.
Figure 1—Cost Function for Noncontract Producers
0 500000 1000000 1500000
0 20000 40000 60000
tweight
cost Fitted values
14
Figure 2—Cost Function for Contract Producers
0 500000 1000000 1500000
0 20000 40000 60000
tweight
cost Fitted values
From the results, it can be seen that it costs Rs. 30 to produce a kg of bird under
contract production and Rs. 26.22 under non-contract production. This suggests that
processors would be better off by abandoning contract production and should instead buy
from noncontract growers. However, because contracting is a form of joint production, it
should be remembered that it is the processors who determine the feed, medicine and
chick costs of contract growers. Therefore, these numbers are not necessarily indicative
of competitive prices but may well be a sign of transfer pricing.
To have cost figures that reflect competitive prices for feed and medicine, we
recalculate contract production costs using the price paid by non-contract growers. This
price is recovered from cost data of non-contract growers. Their unit feed costs depends
on feed prices as well as the feed-conversion ratio. The feed price paid by non-contract
15
growers can therefore be obtained as the ratio of their feed cost and their feed-conversion
ratio. The above procedure assumes unit costs for feed and medicines are constant. This
is indeed the case as the feed and medicine costs are proportional to output. This has to
be so because feed and medicine account for more than 75% of costs and as we saw
earlier, total variable cost is linear in output. For noncontract growers, feed and medicine
costs work out to Rs. 19 per kg of bird, which is calculated as the slope coefficient in a
linear regression of feed and medicine costs on output. In the second step, we regress
feed quantity on output and obtain the feed-conversion ratios as 1.88 and 2.15 for
contract and noncontract growers.
9
In other words, noncontract growers use 2.15 kgs of
feed to produce a kg of bird. Thus, the price of a kg of feed and medicine works out to be
(19/2.15) = Rs. 8.84 where we are assuming medicine requirements (medicine, vaccines
and veterinary services) is proportional to feed.
10
In the third step, we use this price and the feed quantity used by contract growers
to recalculate their feed and medicine costs that would obtain if they were charged the
same prices for feed and medicine as noncontract growers. To these costs, we add the
observed costs for chicks and other inputs that are incurred by contract growers and we
thus obtain a simulated figure for total costs for each production cycle of the contract
9
The
2
R
in the regressions were 0.98 and 0.89 respectively for noncontract and contract growers. The
intercept terms were positive but small. As a result, the average feed-conversion ratios are slightly larger
than the marginal feed conversion ratios and this difference declines as output increases.
10
Even if this assumption is invalid, it will not lead to large errors as medicine costs are small relative to
feed costs. For noncontract growers, medicine costs are less than 0.5% of feed costs. A similar figure is
not available for contract growers as the processors do not charge separately for feed and medicine.
However, it is unlikely to be drastically different.
16
grower.
11
Finally, by regressing the simulated costs on output, we obtain the marginal
(and average) costs for the contract grower as Rs. 24.3. Compared to the marginal costs
for the noncontract grower of Rs. 26.2 per kg, contract production involves a saving
(relative to procurement from noncontract growers) of Rs 1.9 for every kg of bird.
This exercise does not take into account the fact that contract growers have
shorter production cycles than noncontract growers. As contract production is more
efficient than noncontract production at zero rate of interest, taking interest costs into
account can only increase its relative advantage. Rs. 1.9 is a minimum bound on the
surplus from contracting relative to contract production. For instance, assuming an
annual interest rate of 15% per annum for both modes of production, the marginal costs
of noncontract production rises to Rs. 26.77 while that of contract production rises to Rs.
24.7. The savings from contract production therefore rises to Rs. 2.07 per kg of bird per
production cycle.
It might be argued that the borrowing cost of funds for growers would be higher
than for processors that have access to institutional finance. For instance, if noncontract
growers can borrow only at 21% when processors can borrow at 15%, the cost of
noncontract production goes up to Rs. 26.95 while that of contract production does not
change. It would seem then that the surplus from contract production rises to Rs. 2.28
11
In a linear regression of chick costs on chick numbers, the
2
R
was 0.94 and 0.99 respectively for
noncontract and contract growers, the slope coefficients were 12.03 for both groups. Thus the cost of an
additional chick does not vary between the two production modes. This does not, of course, mean that the
cost of day old chicks for contract growers is free from transfer pricing. A survey of the poultry industry in
2001 notes that integrated operations with breeding operations are able to produce day old chicks at a cost
lower than what independent operators source from breeders. However, our data does not allow us to
adjust for transfer pricing in the cost of chicks.
17
per kg. However, note that Rs. 0.21 (the difference between Rs. 2.23 and Rs. 2.07) of
this surplus is because of interest arbitrage by the processor and not because of greater
production efficiency in contracting. As discussed earlier, in so far as such interest
arbitrage possibilities exist even in the absence of contracting, it does not seem legitimate
from an economy wide point of view to count the savings from interest arbitrage as part
of the overall surplus from contracting relative to noncontracting.
The higher efficiency of contract production is driven by its lower feed-
conversion ratio. To test this statistically, we pooled the samples of contract and
noncontract producers and regressed feed quantity on output as well as output interacted
by a contract dummy. The contract dummy is one for a contract farmer and zero
otherwise. The coefficient on the interaction variable estimates the difference in feed-
conversion ratios between the two groups of producers. The results are presented in
Table 8. Once again the standard errors are corrected for heteroscedasticity as well as
correlations between errors stemming from producer specific components. It is clear that
the difference between the feed-conversion ratios for contract and noncontract production
is statistically significant.
Table 8—Feed-Conversion Ratios
Dependent Variable: Feed Quantity
Constant 7.98 (1.8)
Output (kgs) 2.16 (81)
Output x Contract
Dummy
029 (-3.9)
2
R
0.983
# Observations 145
t-statistics in parentheses
18
6. DO CONTRACT GROWERS EARN MORE THAN NONCONTRACT
GROWERS?
In the earlier section, we analyzed the relative efficiency of the contract
production system taking into account the costs to both growers and processors. Here we
consider contracting from the point of view of growers alone. Do contract growers earn
more than noncontract growers? To answer this question, we calculate for contract and
noncontract growers their average income per kg of output from a production cycle.
This is the difference between revenues and input costs. Revenues are from the sale of
grown chicks, litter and bags. The value of home consumption, if any, is also imputed to
revenues. Inputs consist of chicks, feed, medicine, vaccine, litter, veterinary fees, labor,
electricity and disinfectants. For contact growers, however, the processor advances most
of the value of inputs. Compared to the noncontract grower, the contract grower needs
less working capital and therefore incurs lower interest costs. Information on the
opportunity cost of funds for contract and noncontract farmers is, however, missing in the
survey.
From studies of rural finance, we know that informal credit is widely prevalent
and that it is more costly than credit from institutional sources. According to the all India
rural credit survey, formal sector accounted for 53% of all rural credit in 1991.
Moneylenders and friends or relatives account for the rest. More recent data from the
World Bank indicates that access to formal sector credit is very limited for poorer
households. According to the same survey, the median interest from banks (the primary
institutional source) in 2003 was 12.5% per annum while the average interest rate from
19
informal sources was 48%. For credit from institutional sources, transactions costs are
also significant. These arise because of distance to financial institutions, cumbersome
procedures and bribes ranging from 10% to 20% of loan amount (Srivastava and Basu,
2004). As a result, the effective cost of credit from formal sources is likely to be greater
than the median interest rate. A survey in 2001 of the poultry sector reports that interest
rates on commercial loans were typically around 15% per annum (USDA, 2004). As
informal credit is more costly than this, an interest cost of 15% per annum can be taken to
be a lower bound to the cost of credit for growers.
Table 8 compares the incomes from poultry farming for interest rates ranging
from 15% to 30% per annum. As one would expect, the returns to noncontract growers
declines significantly as interest rates rise while the contract farmers are almost
completely insulated from credit costs. The returns are equal for both modes of
production at a 10% rate of interest. For interest rates higher than 10%, the returns for
contract growers are higher than that of contract growers. If we take 15% to be a
representative borrowing rate for growers, contract farmers earn on average Rs. 0.15 per
kg more than noncontract farmers, i.e., about 7% more than the per kg average earnings
of a noncontract grower. We saw in the last section that contract production generates a
minimum surplus of Rs. 1.9 per kg relative to noncontract production. If, in fact, 15% is
the also cost of funds for processors, then contract production yields a surplus of Rs 2.07
per kg out of which farmers receive Rs 0.15 or about 7% of surplus. Note that the entire
remainder is not the profit of processor as the processor also incurs costs in administering
and managing contracts that are not taken into account here.