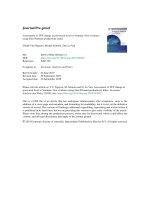
Research on the Effects of Information Technology on Operational Efficiency in Vietnam Commercial Banks Using the Data Envelopment Analysis Method
Bạn đang xem bản rút gọn của tài liệu. Xem và tải ngay bản đầy đủ của tài liệu tại đây (6.59 MB, 27 trang )
2021
International Conference on
Finance, Accounting and Auditing
CONFERENCE PROCEEDINGS
NATIONAL ECONOMICS
UNIVERSITY PUBLISHING HOUSE
Hanoi, 2021
Hanoi, 2021
BOOK NOT FOR SALE
4th INTERNATIONAL CONFERENCE ON FINANCE, ACCOUNTING AND AUDITING
International Conference on
Finance, Accounting and Auditing
ICFAA 2021
2021
NATIONAL ECONOMICS UNIVERSITY PUBLISHING HOUSE
9 786043 301441
CONFERENCE PROCEEDINGS
CONFERENCE PROCEEDINGS
th
4 INTERNATIONAL CONFERENCE ON FINANCE, ACCOUNTING AND AUDITING
ICFAA 2021
NATIONAL ECONOMICS UNIVERSITY PUBLISHING HOUSE
Hanoi, 2021
72. Financing for Wind Energy in Vietnam: Evaluations and Policy Implications ............ 938
Tran Phi Long, Cao Truong Giang, Bach Quoc Trung, Le Thu Tra
Pham Lam Anh, Pham Quynh Giang
73. The Capital Structure of Firms: A Bayesian Approach ......................................... 953
Hoang Thi Hong Le, Phan Thuy Duong, Dang Thu Hang
74. Research on Relationship between Cash Flows and Earnings per Share among
Non-financial Listed Companies in Vietnam ........................................................... 964
Nguyen Thanh Hieu
75. Ceo’s Characteristics and The Growth of Vietnamese Listed Firms .................... 975
Nguyen Hoang Thai, Tran Thi Thanh Huyen
Nguyen Thi Hong, Vu Hong Hanh
76. Tax Compliance Risk Management - Lessons Learned for Vietnam .................... 986
Le Minh Thang, Nguyen Thi Minh Phuong
77. Factors Affecting the Disclosure of Sustainability Reporting .............................. 1001
Nguyen Thi Thuan, Dang Thu Hang
78. Research on the Effects of Information Technology on Operational Efficiency in
Vietnam Commercial Banks: Using the Data Envelopment Analysis Method .. 1013
Vu Thi Huyen Trang, Tran Trung Tuan
79. Business Performance of Listed Enterprises in Vietnam: A Cycletical Analysis ... 1035
Hoang Thi Minh Chau, Tran Dinh Van
80. The Influence of Corporate Characteristics on the Level of Information Disclosure
on the Ho Chi Minh City Stock Market ................................................................. 1047
Le Thi Thu Hong, Do Nguyen Thi My Dung
81. The Financial Situation of Textile and Garment Enterprises in Vietnam Current
Status and Solutions .................................................................................................. 1057
Nguyen Thi Minh Phuong, Le Minh Hang, Ha Phuong Anh
Ta Phuong Anh, Nguyen Thi Thu Hai, Nguyen Thi Thu Ha
Hoang Thi Phuong Le, Trieu Thuy Linh
82. Research on the Influence Factors of Financial Risk for Telecommunications Companies
Listed on Vietnam's stock market .......................................................................... 1083
Nguyen Thi Mai Chi
83. Financial Policies in Renewal Energy Development Investment in Vietnam .............. 1100
Nguyen Duc Duong, Tran Tuan Anh
84. Formal and Informal Credit Access of Farm Households in Rural Areas of
Vietnam: A Case Study of Four Provinces in The Red River Delta .................... 1112
Nguyen Thi Bich Hang, Do Hong Nhung
xiii
The 4th International Conference on Finance, Accounting and Auditing (ICFAA 2021)
December 18th, 2021
Hanoi City, Vietnam
Research on the Effects of Information Technology on Operational Efficiency in
Vietnam Commercial Banks: Using the Data Envelopment Analysis Method
Vu Thi Huyen Tranga, Tran Trung Tuanb
a
Thuyloi University, bNational Economics University
Submission date: 16/11/2021
Revision date: 26/11/2021
Acceptance date: 2/12/2021
Abstract
The paper analyses the impact of information technology (IT) on the performance of Vietnamese
commercial banks. The study applies the random effects model (REM), the fixed effects model (FEM)
and the regression analysis to the data of 30 Vietnam’s commercial banks in the period from 2016 to
2020. We employ the Data Envelopment Analysis on panel data to generate estimates of cost
efficiencies and revenue efficiencies. Measuring the impact of various categories of information
technology (Technical infrastructure, IT human resource infrastructure, bank’s internal IT application,
Online banking service) on banks efficiencies suggests that “the Productivity Paradox” does not affect
all ormation technology investments. Based on the findings, the authors give some recommendations
to Vietnamese commercial banks in case of investments in IT to improve performance.
Keywords: Bank’s performance, Commercial banks, Information technology
JEL code: M40
1. Introduction
This study examines the impact of information technology (IT) investment on
performance in Vietnam commercial banks. There are two reasons for this research topic to
become an urgent study. Firstly, the banking and financial sectors are considered the lifeblood of
the economy. Banking is an intermediary activity linking the movement of the entire economic
sector and the influence of the banking industry on all socio-economic activities. Therefore, the
improvement of the bank performance brings widespread effects not only to the banking industry
but also to other industries. Secondly, the banking industry is one of the leading industries in
1013
applying IT in management and operation. Information gathering and processing is central to the
banking industry, so the impacts of IT innovation can be far-reaching.
Many companies in general and banks in particular have invested a lot of money in IT
but have very little understanding of the impact of IT on operational efficiency. Without
scientific impact assessment measures, investment decisions will only be based on emotions.
Therefore, the development of measures to assess the impact between IT investment and
performance will be of real value both academically and practically. Research on the link
between IT investment and performance began with Robert Solow (1987) in his statement as
follows: “You can see the computer age everywhere except in in efficiency statistics". Then,
there are a number of studies investigating the impact of IT on operational performance at
different levels: entire economy, industry, company, division, and an individual application.
However, in this research, the author only focuses on company-level studies. Previous studies
had shown the mixed results on the relationship between IT and performance. The researchs
conducted in the first half of the 1990s by Strassmann (1990), Weill (1992), Brynjolfsson
(1993) and Landauer (1995) showed that there was no link between investments in IT and
performance. However, the researchs conducted in the second half of the 1990s by Dewan
(1997), Hitt (1996) concluded that there was a positive positive relationship between investment
in IT and operational performance. Because the research results on the relationship between IT
investment and performance in the world show many different results, moreover, this research
topic in Vietnam is very small, so the author has chosen the topic "Research on the effects of
Information technology on operational efficiency in Vietnam commercial banks: Using data
envelopment analysis" as the research topic for this research.
By interpreting the previous findings on "the productivity paradox", our research
attempts to empirically validate the relationship between IT investment and performance in the
context of the emerging country of Vietnam. Our study is therefore devoted to examining the
following key question: What is the impact of information technology on the performance of
Vietnam commercial banks? To empirically validate the relationship between IT investment and
the performance of Vietnam commercial banks, we use using the data envelopment analysis
method. Thus, the objective of this work is to evaluate the performance of banks during the period
2016–2020 while identifying the impact of different information technologies components
introduced by banks on their performance. The paper is organized as follows. Section 1 provides
the introduction. Section 2 provides the literature review and methodological approach for our
study. Finally, Section 4 describes the empirical results, and Section 5 is the conclusion.
2. Literature Review/ Theoretical Framework and Methods
2.1. Literature Review
Besides the traditional approach when evaluating performance, the world now uses the
data envelopment analysis method. This method calculates a relative efficiency index based on
1014
comparing the distance of units (banks) with a marginal best performing unit (this margin is
calculated from the dataset because in practice). This tool allows us to calculate the overall
performance index of each bank based on their performance and allows to rank the performance
of the banks. the data envelopment analysis method will calculate TFP composite factor
productivity, cost effectiveness and profit efficiency of each company. Therefore, recent studies
have evaluated the effect of IT investment on operating performance according to performance
measures from the data envelopment analysis method for two reasons. First, studies that
evaluate the impact of IT on traditional performance measures may underestimate the impact
of IT because computer use is often associated with large changes in output quality. It is difficult
to measure accurately. Second, the use of technology can take time to adjust to the organization
and the skills of employees. Therefore, the recent studies trying to explore and evaluate the
impact of IT on changes in corporate organizations and in corporate performance, traditional
performance measures such as ROA, ROE do not reflect these changes. Therefore, in this study,
the author will focus on studies that analyze the relationship between IT and performance based
on the data envelopment analysis method.
Gopal, Wang and Zionts (1992) conducted a study on the firm-level performance of 36
banks. The author used the data envelope analysis (DEA) method to measure performance.
They used the adjusted DEA model because the pure DEA model did not consider intermediate
manufacturing processes and did not provide the detailed information about the effects of
specific variables. Data sources were obtained from Computerworld Premier 100, Standard and
Poor's Industry Surveys and Standard and Poor's Compustat. The first stage output variable was
the total amount of deposits. The stage one input variables were IT assets, staff and budget. The
second stage output variables were Profit and loan percentage recovered. The authors conclude
that there was a positive relationship between operating results and the intensity of capital use
for IT. The downside of that study was that it didn’t factor in the possible time lag between IT
investment and operational performance. Furthermore, in the authors' model it was assumed
that the only intensive use of IT is in the deposit sector; however, IT was used intensively in at
least two other areas - loan approval/collection and loan management. Therefore, the author
had not studied the impact of IT on performance in these areas.
Courtney (1993) studied performance at the firm level in several industries based on the
DEA method suggested by Gopal (1992), using least squares regression and discriminant
analysis. The author studied a sample of 325 companies from the same data source as in Gopal
(1992) using Computerworld Premier 100 for intermediate variables, while higher-level
variables were used from Standard and Poor's sources, Industry Surveys and Standard and
Poor's Compustat. The information system investment variables in the research were: Budget
for information system, budget for information system staff, training budget for information
system staff, terminal equipment/staff, processor value, year, sector. The performance variables
in the study were ROA and stock price. The DEA method was used to determine the effective
classifier for each company. The numerical discriminant analysis uses the output of the DEA
to determine if a relationship exists between the performance classification and IT investment.
Finally, the least squares regression method compares the DEA and the discriminant analysis
1015
results. The authors did not find a direct relationship between IT and operational performance
for all industries, although a positive relationship had been noted in the paper, chemical, and
oil refining industries.
Beccalli's study (2007) expanded on previous studies on IT investment and performance
of 737 banks in Europe (specifically in France, Germany, Italy, Spain, UK) for the period from
1995 to 2000. The independent variables were IT investment in hardware, software, and other
IT services. The dependent variables were ROA, ROE, cost effectiveness and profit efficiency.
The author uses the following methods: OLS regression, two-stage regression (2SLS) and SFA.
The research results showed that although banks invest large in IT, there is a small relationship
between total IT investment and operational efficiency at the bank, confirming the existence of
a productivity paradox. The impact of different types of IT investments was different: while
investments in hardware and software reduced the efficiency of banks, IT services from outside
providers had a positive effect to ROA, ROE and profit efficiency. This study of the author had
overcome some limitations of previous studies by using both a traditional accounting profit
measure (ROA, ROE) and a more advanced measure of operational efficiency, which called Xefficiency. Moreover, the author did not study investment in IT as a single variable like previous
studies but had specifically divided into three components of IT investment namely hardware,
software and IT services to consider the different IT areas.
Tam (2015) researched the impact of technology investment on the performance of the
commercial banking system in Vietnam, thereby assessing the impact of technology investment
on banks. At the same time, give recommendations to commercial banks on the level of
investment in technology to improve the operational efficiency of Vietnamese commercial banks.
Using the GMM method for one-year lagged dynamic panel data of 15 commercial banks in
Vietnam with data for six years (2009-2014), the study analyzed the impact of IT on ROE and
ROA. The resulting research showed that when other factors held constant, increasing IT (ratio
of technology investment on fixed assets) by 1% will increase ROA (rate of return on total assets)
by 10%. In addition to IT, the operational efficiency of the commercial banking system in
Vietnam was also affected by factors such as the ratio of liquid assets to total assets (liquidity)
and macro factors such as economic growth rate (GDP), consumer price index (CPI) and
exchange rate change (tygia), but the level of impact of these factors was quite low in the model.
Huong and Nhu (2018) researched the influence of information and communication
technology on Vietnam commercial banks through the Vietnam ICT Index. The author
researched the data of 24 commercial banks from 2006 to 2017 according to the linear
regression model. Research results show that there is a positive relationship between ICT index
and operational performance. From there, the author makes recommendations that banks should
strengthen policies to improve ICT indicators and combine with strategies to expand bank scale,
loans and deposits. However, this study only focuses on the composite index of IT without
further research on the specific component indexes of ICT index.
Currently, there are very few studies on the relationship between IT investment and
operational efficiency at banks using the marginal efficiency analysis in the world so the imperial
studies are also essential. Moreover, according to the author's knowledge, the studies between the
1016
relationship between IT investment and the performance of banks in Vietnam have only mostly
researched in the direction of evaluating the direct relationship between IT and operational
efficiency according to the traditional assessment method is (ROA and ROE) (Tam, 2015; Huong
and Nhu, 2018) but very few studies have evaluated the relationship between IT and the
performance of Vietnam commercial banks according to the method of marginal efficiency
analysis (DEA method), the author finds that this is a research gap that needs to be filled.
2.2. Methodology
In this research, the author uses a regression method to evaluate the impact of IT on the
performance of X-efficiency.
Performance (X-efficiency) = f(IT)
In which, X-efficiency will be approached according to the method of marginal
efficiency analysis. This method calculates a relative efficiency index based on comparing the
distance of units (banks) with a best performing unit on the edge (this compile from the data
files because on the reality of compile results to the theory is not know). The marginal efficiency
analysis method has two approaches: parametric approach and non-parametric approach. The
requirement parameter approach needs to have a specific form of function for the efficient
frontier and has a specified random error or inefficient distribution. Therefore, the outcome of
the parametric approach is greatly influenced by the choice of the functional form. The nonparametric approach does not need to specify a particular form of function and does not
constrain the distribution of inefficiencies like the parametric approach, except that the
efficiency indices must be between 0 and 1, and assume there is no random error or
measurement error in the data. Therefore, the main limitation of the non-parametric method is
that it is very sensitive, so if there is a random error in the data, it will affect the results.
In this research, the author uses a non-parametric approach, namely the data
envelopment method DEA is a linear programming technique to evaluate a decision-making
unit (DMU or bank) how does it perform relative to other banks in the sample? This technique
generates a marginal set of efficient banks and compares it with inefficient banks to measure
efficiency. The author chooses the DEA method because the banking industry is a complex
service industry and there are many relationships between inputs and outputs. Therefore, when
evaluating the performance of a bank, it is necessary to consider simultaneously many inputs
and many outputs. Whereas the parametric approach has to specify a specific form of function
between the input and the output, so it is very likely that it will give wrong results if the choice
of the function form is not correct.
The key point of this approach is to specify the bank's inputs and outputs appropriately.
According to research results on bank performance, there are five approaches in determining
outputs and inputs (Hung, 2008).
Production approach: considers banks as service providers, so deposits are
considered outputs and interest payments on deposits are not included in banking costs (Ferrier
and Lovell, 1990).
1017
Intermediary approach: considers banking as financial institutions that mobilize and
allocate loans and other assets so that deposits are treated as inputs and interest payments are
part of total expenditures. banking fee.
Asset approach: consider liabilities as inputs and assets as outputs.
Value added approach: treat all balance sheet items as outputs if it attracts the
respective contributions of capital and labor hence deposits are considered outputs.
Usage-cost approach: considers the net contribution to a bank's revenue as an input
and output, hence deposits as an output.
According to Berger and Humphrey (1997), there is no perfect approach that reflects all
the activities and roles of a bank, but the intermediary approach may be the most appropriate
when assessing the bank's performance because it is concerned with interest payments, which
often account for ½ to 1/3 of a bank's total operating costs. Moreover, the intermediary approach
is also concerned with the profitability of the bank because minimizing costs is a necessary
condition for profit maximization. Therefore, in this research, the author also uses an
intermediary approach that considers deposits as an input to create outputs such as lending,
investment, interest income and non-interest income. According to Hung (2008), the author
chooses the input and output variables in the DEA model as follows:
Input variables include: Total net fixed assets (K.TSCD), total expenses for
employees (L.ChiNV), total mobilized capital (W.TGKH).
Outputs: Interest and future income (Thulai) and Non-interest income (Thungoailai)
After estimating the efficiency measures by the DEA method, the author will obtain the
technical efficiency of banks according to the revenue maximization function under CRS
(CRSTEmax) and VRS (VRSTEmax) conditions and the author will obtain the technical
efficiency of banks according to the cost minimization function under CRS (CRSTEmin) and
VRS (VRSTEmin) conditions. These results are used by the author as a dependent variable to
evaluate the performance of banks.
Next, a regression model is used to analyze the impact of IT on these performance
measures. In which, the independent variable IT is obtained by the author from the report on
readiness for development and application of IT and communication in Vietnam (ICT index)
dedicated to the banking industry. The Vietnam ICT Index report was developed by Vietnam
Association for Information Processing according to the standards of E-Government
Development Index (EGDI) of the United Nations. The Vietnam ICT Index is calculated on the
basis of statistical reports of central and local state management agencies, that is, an internal
assessment and hardly depends on the subjective feelings of digital providers. (Report of 10
years of implementation of Viet Nam ICT index). The ICT index has been correlated with other
sets of socio-economic indicators of Vietnam (PCI provincial competitiveness index; PAR
administrative reform index, governance efficiency index and Provincial public administration
(PAPI, e-commerce index EBI) all show a high degree of correlation. This proves both
1018
academically and practically that the ICT index data is reliable. From 2016, the ICT index
adjusted according to the standards of the E-Government Development Index – EGDI will
include 4 sub-indexes: infrastructure technology (HT), human infrastructure (NL), internal
banking IT applications (UD) and online banking services (DV).
Variable
Definition
HT
Technical
infrastructu
re
Indicator
Measure
1. Server and - The ratio of Virtual Servers/Total Servers
workstation
- The ratio of workstations (PC/Laptop) in the last
infrastructure
3 years/Total Workstations
2.
- The ratio of workstations running proprietary
Communication and
manufacturer-supported
operating
infrastructure
systems/Total workstations
- The ratio of Internet bandwidth providing
Internet Banking services/Total number of
Internet Banking customers
- Ratio of Internet bandwidth provided to internal
users/Total number of computers connected to the
Internet
- Ratio of wide area network bandwidth/Total
number of terminals
3. ATM and - The ratio of ATM /Total number of payment
POS
cards
infrastructure
- The ratio of ATMs accepting chip cards/Total
number of ATMs
- The ratio of ATMs with recharge function/Total
number of ATMs
- The ratio of POS machine/Total payment cards
- The ratio of (mPOS and wireless POS)/Total
POS
4. Deployment
of information
security
and
data
safety
solutions
- The ratio of workstations with anti-virus
software installed/Total workstations
- The ratio of servers installed anti-virus
software/Total servers
- Rate of database installed on SAN + Rate of
database installed at TTDPTH + Rate of database
backed up to hard disk + Rate of database backed
up to magnetic tape
- ATTT (TTDL, TTDPTH) = Total of main
solutions + 0.2 x Other solutions
1019
Variable
Definition
Indicator
Measure
- ATTT(CN) = Sum of main solutions + 0.2 x
Other solutions
- ATTT(UDKH) = + 5x(%Customers use (Digital
Signature + Advanced OTP + U2F+UAF)) +
4x(%Customers use (Biometrics + Basic OTP)) +
3x(%Customers customers using SMS OTP)
+2x(%Customers using Matrix Card) +
1x(Username, Password +CAPTCHA)
- CCATTT = Total number of bank's security
certificates + 10 x Total number of BCP drills + Total
number of individual BCP drills for each system.
5. Data Center 5 x Data Center Level +3 x TTDPTH + TTDPTH
(Data Center) and CARD
Disaster
Prevention Center
(TTDPTH)
NL
Human
resource
infrastructu
re
- The ratio of specialized IT staff/total employees
- The ratio of officers in charge of information
security/Total employees
- The ratio of IT staff with specialized
international certificates IT/Total number of
specialized IT staff.
UD
Bank's
1. Deploy core SLMD + SLKN + PTKN + XLGD + XLĐC
internal IT banking
Inside:
application
1) SLMD: Total number of Corebank modules deployed.
2) SLKN: Total connection of Corebank and
other systems (ERP, ATM/POS, Internet
Banking, SWIFT, CITAD, Reporting Systems...)
3) PTKN: Connection method between Corebank
and other systems (1: file interface, 2: Database,
3: Message Queue, 4: ESB integration axis, 5:
Other form)
4) XLGD: The degree of automation when
processing transactions between Corebank
system and other systems (0: non-automatic, 1:
semi-automatic, 2: automatic).
5) XLĐC: Process and reconcile data between
1020
Variable
Definition
Indicator
Measure
CoreBank and other systems (0: no
reconciliation, 1: with manual reconciliation, 2:
with partial automatic reconciliation, 3 with full
automatic reconciliation).
2. Deploy basic Basic IT Applications + 0.2 x OTHER
applications
3.
Deploying Interbank e-commerce + SWIFT + Other
electronic
(Bilateral payment
payments
DV
Online
banking
service
1. Bank website
MTCH + 0,2 x MTKH +TSCN
- MTCH: Total number of key items available
(listed in the questionnaire)
- MTKH: Total number of other items (if any)TSCN: frequency of website updates, calculated
by the formula+ Daily update: TSCN = 3+
Weekly update: TSCN = 2+ Monthly update:
TSCN = 1+ Irregular update: TSCN = 0
2.
Internet
Banking
for
individual
customers
Formula: MTCH + 0.1 x MTKH
MTCH: Total number of main items available
(listed in the survey form)
MTKH: Total number of other items (if any)
3.
Internet
Banking
for
corporate
customers
Formula: MTCH + 0.1 x MTKH
MTCH: Total number of main items available
(listed in the survey form)
MTKH: Total number of other items (if any)
4. Other
banking
services
e- Formula: MTCH + 0.1 x MTKH
MTCH: Total number of main items available
(listed in the survey form)
MTKH: Total number of other items (if any)
5. Other
banking
services
e- Formula:
TLTHEGD
+
TLGDDT
+
TLGDATM/POS
TLTHEGD: The ratio of cards with transactions
in the year/Total number of individual customers
TLGDDT:
The
ratio
of
electronic
transactions/total transactions
TLGDATM/POS: The ratio of transactions via
ATMs and POS machines/Total transactions
Source: Vietnam ICT index 2016, 2017, 2018, 2019
1021
The author chooses such IT investment variables to overcome two limitations in
previous studies. First, the previous studies assumed that all firms are converting their IT
investments into outputs with the same degree of success (Huang, 2002). Previous studies were
based on data on IT investment costs, but the results of the IT investment process could not be
clarified. Therefore, the use of IT investment performance indicators will overcome this
limitation. These are the general indicators developed by the Ministry of Information and
Communications of Vietnam for the general assessment of commercial banks, so the indicators
are comprehensive in terms of IT aspects and are quite reliable. Second, many previous studies
assume that all investments in IT are treated equally by using only one aggregate IT variable
(Huang, 2002). In the study, the author uses four IT variables namely technical infrastructure,
IT human resource infrastructure, banking internal IT application and banking online services,
so the specific impact of each type of IT investment will be measured on bank performance.
To consider the impact on performance of the various categories of IT investments, the
estimated equation is:
Pt = β0 + βtHTt + βtNLt + βtUDt + βtDVt +Ɛt
Where: HTt= Technical infrastructure; NLt= Human resource infrastructure; UDt=
Bank's internal IT application; DVt= Online banking service.
2.3. Data
Research using information on IT investment in banks in terms of technical
infrastructure, human infrastructure, internal banking IT application and banking online
services from Vietnam IT index report as well as data from financial statements of 30
commercial banks for the period from 2016 to 2020. After excluding some banks that do not
participate in the Vietnam ICT index report and some banks that do not disclose financial
statement information, we have data include 138 observations presented at table 1.
Table 1. The banks list during 2016 -2020
No
Bank
Code
Observations
1
Tien Phong Commercial Joint Stock Bank
TBP
4
2
Nam A Comercial Join Stock Bank
NAB
5
3
JSC Bank for Investment and Development of Vietnam
BID
5
4
VietNam Technological and Commercial Joint Stock Bank
TCB
5
5
Military Commercial Joint Stock Bank
MBB
5
6
JSC Bank for Foreign Trade of Vietnam
VCB
5
7
Vietnam Thuong Tin Commercial Joint Stock Bank
VBB
3
8
Orient Commercial Joint Stock Bank
OCB
5
9
Sai Gon Joint Stock Commercial Bank
SCB
5
1022
No
Bank
Code
Observations
10 Sai Gon Thuong Tin Commercial Joint Stock Bank
STB
5
11 Ho Chi Minh City Housing Development Bank
HDB
5
12 Bac A Commercial Joint Stock Bank
BAB
5
13 Southeast Asia Commercial Joint Stock Bank
SSB
5
14 An Binh Commercial Joint Stock Bank
ABB
5
15 Vietnam Prosperity Joint Stock Commercial Bank
VPB
5
16 Kien Long Commercial Joint Stock Bank
KLB
4
17 Vietnam International and Commercial Joint Stock Bank
VIB
5
18 Vietnam Maritime Joint – Stock Commercial Bank
MSB
3
19 Vietcapital Commercial Joint Stock Bank
BVB
5
20 Joint Stock Commercia Petrolimex Bank
PGB
4
21 Vietnam Bank for Agriculture and Rural Development.
AGB
5
22 Saigon – Hanoi Commercial Joint Stock Bank
SHB
5
23 Asia Commercial Joint Stock Bank
ACB
5
24 Vietnam Asia Commercial Joint Stock Bank
VAB
4
25 Vietnam Public Joint Stock Commercial Bank
PVB
5
26 Saigon Bank for Industry and Trade
SGB
4
27 Vietnam Export Import Bank
EIB
5
28 Vietnam Joint Stock Commercial Bank for Industry and Trade
CTG
5
29 Bao Viet Joint Stock Commercial Bank
BAO
4
30 National Citizen Commercial Joint Stock Bank
NCB
3
Source: Authors synthesized
The study used STATA software to conduct correlation analysis between variables, build
regression models and test models. The research study explains the level of impact of the independent
variable on the dependent variable. Finally, a predictive model from the research sample is given.
3. Results and Discussion
Technical efficiency estimation results by the DEA method
After selecting the input and output variables for the research sample of 30
Vietnamese commercial banks in the period 2016 to 2020, the author uses the DEA method
to estimate the global efficiency (CRSTE) and technical efficiency (VRSTE) in terms of
cost minimization and revenue maximization. The results of technical efficiency estimation
are presented in Tables 2 and 3 below.
1023
Table 2. Total efficiency, technical efficiency and scale efficiency in the period 2016 – 2020
as function of cost minimization
Source: Authors synthesized
Table 3. Total efficiency, technical efficiency and scale efficiency in the period 2016 – 2020
as function of revenue maximization
Source: Authors synthesized
The descriptive statistics of the independent and dependent variables shown in Table 4
show the mean, standard deviation, maximum and minimum values of the variables. The results
show that the outliers have been removed from the study sample.
1024
Table 4. Descriptive statistics of variables
Variables
Code
Mean
Technical efficiency under CRS as
cost minimization function
CRSTEmin
0,8100
Technical efficiency under VRS as
cost minimization function
VRSTEmin
Technical efficiency under CRS as
revenue maximization function
Technical efficiency under VRS as
revenue maximization function
Std.Dev
Min
Max
0,1368
0,5563
1,0000
0,8835
0,1292
0,5897
1,0000
CRSTEmax
0,8100
0,1368
0,5563
1,0000
VRSTEmax
0,8683
0,1326
0,5618
1,0000
Technical infrastructure
HTC
0,4583
0,1198
0,1535
0,7586
Human resource infrastructure
NLC
0,3876
0,2376
0,0000
1,0000
Bank's internal IT application
UDC
0,4913
0,2174
0,0000
1,0000
Online banking service
TTC
0,5809
0,1949
0,0150
1,0000
Source: Authors synthesized
Table 5 shows the correlation coefficient between the independent variables in the
model. The research results show that the independent variables have a low correlation, in
which the highest correlation coefficient is between IT technical infrastructure and online
services with a correlation coefficient of 0.4680.
Table 5. Correlation coefficients between independent variables
Variables
HTC
NLC
UDC
TTC
HTC
1,0000
0,1208
0,0936
0,4680
NLC
UDC
TTC
1,0000
-0,1521
0,0750
1,0000
0,2051
1,0000
To evaluate whether fixed effects (FEM) or random effects (REM) models are suitable
for measuring the influence of IT investment on bank performance, the author uses the test.
Hausman with dependent variables CRSTEmin, VRSTEmin, CRSTEmax, VRSTEmax,
respectively. If the residuals and the independent variables have no correlation with each other,
choose the random effects model (REM) and otherwise, choose the fixed effects model (FEM).
The Hausman test is performed with the following hypothesis:
H0: The REM model is the right model
H1: The FEM model is the right model
With the results of running Hausman test for dependent variables CRSTEmin,
VRSTEmin, CRSTEmax, VRSTEmax respectively according to table 6, table 7, table 8, table
9, then prob. > 0.05, the null hypothesis H0 should be rejected, so the REM random effects
model is appropriate.
1025
Table 6. Hausman test results for the dependent variable CRSTEmin
Chi2(4) = 1,18
Prob > chi2 = 0,8813
(b)
(B)
(b-B)
Sqrt (Diag (V_b-V_B))
Fem
Rem
Difference
S.E.
HTC
.0292216
.0382755
-.009054
.0149551
UDC
-.0227867
-.0174968
-.0052898
.0075026
TTC
.0955566
.0906164
.0049402
.0113914
NLC
.0605962
.0725063
-.0119101
.0187795
Source: Authors synthesized
Table 7. Hausman test results for the dependent variable VRSTEmin
Chi2(4) = 9,75
Prob > chi2 = 0,0448
(b)
(B)
(b-B)
Sqrt (Diag (V_b-V_B))
Fem
Rem
Difference
S.E.
HTC
-.0074332
.0068134
-.0142466
.0116707
UDC
-.0141668
-.0038019
-.0103649
.0058491
TTC
.0828982
.0687887
.0141095
.0099187
NLC
.0410899
.0454398
-.0043499
.0193833
Source: Authors synthesized
Table 8. Hausman test results for the dependent variable CRSTEmax
Chi2(4) = 1,18
Prob > chi2 = 0,8813
(b)
(B)
(b-B)
Sqrt (Diag (V_b-V_B))
Fem
Rem
Difference
S.E.
HTC
.0292216
.0382755
-.009054
.0149551
UDC
-.0227867
-.0174968
-.0052898
.0075026
TTC
.0955566
.0906164
.0049402
.0113914
NLC
.0605962
.0725063
-.0119101
.0187795
Source: Authors synthesized
1026
Table 9. Hausman test results for the dependent variable VRSTEmax
Chi2(4) = 13,24
Prob > chi2 = 0,0102
(b)
(B)
(b-B)
Sqrt (Diag (V_b-V_B))
Fem
Rem
Difference
S.E.
HTC
-.2009944
-.1568752
-.0441193
.0173974
UDC
-.037957
-.0166035
-.0213535
.0087003
TTC
.0398031
.0287377
.0110654
.0150694
NLC
.1456903
.1298349
.0158554
.0291415
Source: Authors synthesized
The results of running Hausman test for dependent variables are CRSTEmin, then prob.
=0.8813 > 0.05, so the null hypothesis H0 is rejected, so the REM random effects model is
appropriate; VRSTEmin prob. = 0.0448 < 0.05, so the hypothesis H0 is accepted, so the FEM
fixed-effects model is suitable; CRSTEmax then prob. =0.8813 > 0.05, so the null hypothesis
H0 is rejected, so the REM random effects model is appropriate; VRSTEmax then prob. =
0.0102 > 0.05, so the hypothesis H0 is accepted, so the FEM fixed-effects model is suitable.
The author selects a suitable model for each dependent variable and then runs the
regression model. The results show that the regression model between the independent variables
IT and the dependent variable CRSTEmin, CRSTEmax, VRSTEmax is suitable while the
regression model between the independent variables IT and the dependent variable VRSTEmin
is not suitable (due to Pro > F = 0.2785).
The results of running the regression model are presented in Table 10 and Table 11 below.
Table 10. Regression results according to random effects model (REM) for dependent
variables CRSTEmin and CRSTEmax
CRSTEmin
CRSTEmax
(Coef.)
(P>|t|)
(Coef.)
(P>|t|)
HTC
,0382755
0,555
,0382755
0,555
UDC
-,0174968
0,590
-,0174968
0,590
**
TTC
,0906164
0,037
,0906164
0,037**
NLC
,0725063
0,096***
,0725063
0,096***
_cons
,7192952
0,000
,7192952
0,000
Observations
138
138
R-Squared
0,0656
0,0656
Wald chi2(4)
11,37
11,37
Prob > chi2
0,0227
0,0227
*, **, *** means statistically significant at the 1%, 5% and 10%
Variables
Source: Authors synthesized
1027
Table 11. Regression results according to fixed effects model (FEM)
for dependent variable VRSTEmax
VRSTEmax
Variables
(Coef.)
(P>|t|)
HTC
-.2009944
0.016**
UDC
-.037957
0.360
TTC
.0398031
0.476
NLC
.1456903
0.015 **
_cons
.8994574
0.000
Observations
138
R-Squared
0.0129
F(4,104)
3,02
Prob > F
0,0213
*, **, *** means statistically significant at the 1%, 5% and 10%
Source: Authors synthesized
Next, the author performs a test of variance across entities in the FEM and REM models
with dependent variables CRSTEmin, CRSTEmax and VRSTEmax, respectively with the
following hypothesis.
H0: There is no variance in the model
H1: There is a variable variance in the model
Fig. 1: Test results of variance of variance across entities in REM for dependent variables
CRSTEmin and CRSTEmax
1028
Source: Authors synthesized
Fig. 2. Results of testing variance of variance across entities in FEM
for dependent variable VRSTEmax
Source: Authors synthesized
The test results on Fig. 1 and Fig. 2 show that p-value < 0.05, therefore, rejecting H0
means that there is a variable variance in the FEM and REM models.
Then, the author performs a series of correlation test with the following hypothesis:
H0: There is no serial correlation
H1: There is a phenomenon of series correlation
The test results in Fig. 3 show that p-value < 0.05, so rejecting H0 means that there is a
phenomenon of series correlation.
1029
Fig. 3. Results of the series correlation test
Source: Authors synthesized
Finally, the author performs the multicollinearity test. The results of the multicollinearity
test of the research variables are shown in Table 12 below.
Table 12. Checking for multicollinearity of research variables
Variables
VIF
1/VIF
TTC
1,33
0.752622
HTC
1,29
0.773438
UDC
1,08
0.929526
NLC
1,05
0.955761
Mean VIF
1,19
Source: Authors synthesized
The VIF indexes are all < 2, showing that in the independent variables there is no
multicollinearity phenomenon. Thus, in all three models, corresponding to three dependent
variables, CRSTEmin, CRSTEmax and VRSTEmax, respectively, there is no multicollinearity
phenomenon, but there is a phenomenon of variable variance and a phenomenon of series
correlation. Run the error repair model to fix these errors. The regression results according to
robust FEM and robust REM are shown in Tables 13 and 14.
1030
Table 13. Error correction regression results according to random effects model (REM) for
dependent variables CRSTEmin and CRSTEmax
Variables
CRSTEmin
CRSTEmax
(Coef.)
(P>|t|)
(Coef.)
(P>|t|)
HTC
,0382755
0,498
,0382755
0,498
UDC
-,0174968
0,516
-,0174968
0,516
TTC
,0906164
0,022**
,0906164
0,022**
NLC
,0725063
0,066***
,0725063
0,066***
_cons
,7192952
0,000
,7192952
0,000
Observations
R-Squared
Wald chi2(4)
Prob > chi2
138
138
0,0656
0,0656
8,57
8,57
0,0729
0,0729
*, **, *** means statistically significant at the 1%, 5% and 10%
Source: Authors synthesized
The results of the regression according to REM are shown in Table 13 for the dependent
variables CRSTEmin and CRSTEmax. It shows that in the four independent variables about IT,
two variables are online banking services and IT human resource infrastructure with p_value. <
0.05 shows that these variables have statistical significance at the 5% level of significance, that is,
they have an impact on the dependent variable CRSTEmin, the sign of the regression coefficients
has a positive sign. The remaining two independent variables, which are IT technical infrastructure
and internal banking applications have p_value > 0.1, so there is no statistical significance.
Table 14. Error correction regression results according to random effects model (REM) for
dependent variable VRSTEmax
Variables
VRSTEmax
(Coef.)
(P>|t|)
HTC
-.2009944
0.015**
UDC
-.037957
0.260
TTC
.0398031
0.392
NLC
.1456903
0.014**
_cons
.8994574
0.000
Observations
138
R-Squared
0.0129
F(4,104)
2,84
Prob > F
0,0420
*, **, *** means statistically significant at the 1%, 5% and 10%
Source: Authors synthesized
1031
The regression results according to FEM are shown in Table 14 for the dependent
variable VRSTEmax, showing that in the four independent variables about IT, there are two
variables that are IT technical infrastructure and IT human resource infrastructure with p_value
< 0.05 for each variable. These variables are statistically significant at the 5% level of
significance, that is, they have an impact on the dependent variable VRSTEmax, the sign of the
regression coefficients of the IT technical infrastructure has a negative sign while the sign of
the nuclear infrastructure is negative. IT force has a positive sign. The remaining two
independent variables, which are internal banking IT applications and banking online services,
have p_value > 0.1, so there is no statistical significance.
From the table of regression results, the author identifies a regression model that reflects
the influence of IT factors on the performance of Vietnamese commercial banks as follows:
CRSTEmin = 0.7193 + 0.0383HTC – 0.0175UDC + 0.0906TTC + 0.0725NLC (1)
CRSTEmax = 0.7193 + 0.0383HTC – 0.0175UDC + 0.0906TTC + 0.0725NLC (2)
VRSTEmax = -0.8995 - 0.201HTC - 0.0380UDC + 0.0398TTC + 0.14571NLC (3)
From the regression equation (1), it shows that, other things being equal, online services
increase by 1%, then technical efficiency as a function of minimizing the constant conditional
cost of the bank's size increases by 9, 06%; IT human resources increased by 1%, technical
efficiency as a function of minimizing cost condition constant to scale increased by 7.25% and
these variables were all statistically significant at 5% level. While the remaining two IT
variables, IT infrastructure, increased by 1%, technical efficiency as a function of minimizing
the cost condition constant to scale increased by 3.83% and internal application of the bank
increased by 1%. Technical results according to the cost minimization function condition
constant to scale decreased by 1.75% and these two variables were not statistically significant.
This result shows that IT variables such as online services and IT human resources have a
positive effect on technical efficiency as a function of cost minimization, conditionally constant
to scale and these variables are statistically significant. That is, investing the bank's resources
in these variables will increase the bank's performance.
From regression equation (2) shows that, other things being equal, online services
increase by 1%, then the technical efficiency as a conditional revenue maximization function
constant with the size of the bank increases by 9, 06%; IT human resources increased by 1%,
technical efficiency as a revenue maximization function, conditionally constant to scale,
increased by 7.25% and these variables were all statistically significant at 5%. While the
remaining two IT variables, IT infrastructure, increased by 1%, technical efficiency as a revenue
maximization function constant to scale increased by 3.83%, and bank internal application
increased by 1%, efficiency and profitability increased by 1%. Technical results according to
the revenue-maximizing function, which is constant to scale, decreased by 1.75% and these two
variables were not statistically significant. This result shows that IT variables such as online services
and IT human resources have a positive effect on technical efficiency as a conditional revenue
maximization function that is constant to scale and these variables are statistically significant. That
is, investing the bank's resources in these variables will increase the bank's performance.
1032
From the regression equation (3), it shows that, other things being equal, the IT
infrastructure increases by 1%, then the technical efficiency as a revenue maximization function
changes with the size of the bank decreases by 2.00 %; IT human resources increased by 1%,
technical efficiency according to the revenue maximization function in terms of scale increased
by 14.57% and these variables were all statistically significant at 5%. While the remaining two
IT variables, internal applications, increased by 1%, technical efficiency as a function of
revenue maximization of conditions of scale decreased by 3.80% and online banking services
increased by 1%, Technical efficiency according to the revenue maximization function of the
condition of scale increased by 3.98% and these two variables were not statistically significant.
This result shows that the IT infrastructure variable has a negative effect on technical efficiency
according to the revenue maximization function, the condition varies with scale due to the
inverse effect of productivity and IT human resources has a positive effect. to technical
efficiency as a function of revenue maximization, the condition varies with scale and these
variables are statistically significant, that is, the investment of the bank's resources in IT human
resources will increase operational efficiency. of the bank.
4. Conclusions and Policy Implications
This study aims to analyze the influence of IT investment on the performance of
Vietnamese commercial banks using marginal efficiency analysis method (CRSTEmin,
CRSTEmax, VRSTEmax). The research results show that two IT factors, namely banking
online services and IT human resources, have an influence on technical efficiency as a function
of cost minimization and revenue maximization. statistical significance level of 5%. The sign
of the regression coefficients has a positive sign, indicating a positive relationship between IT
investment and technical efficiency as a function of cost minimization and revenue
maximization under constant conditions of size in banks. Vietnamese trade. Meanwhile, the IT
infrastructure factor has a negative effect on technical efficiency according to the revenue
maximization function with the condition of changing the size and the IT human resource factor
positively affects the technical efficiency according to the maximum function. Maximize
revenue with the variable of scale at the 5% level of significance. Thus, there exists a
productivity paradox between IT infrastructure and technical efficiency as a revenuemaximizing function with varying terms of scale.
Based on these results, the author makes recommendations for banks to step up
investment in IT in the aspects of banking online services and IT human resources because it
makes technical efficiency as a function of minimizing costs. Fees and revenue maximization
conditions remain constant to the size of the bank. However, it is necessary to study and
consider carefully the investment in IT infrastructure because there is a productivity paradox,
investment in banking IT infrastructure can reduce technical efficiency according to the revenue
maximization with varying terms of scale.
References
Beccalli, E. (2007). "Does IT investment improve bank performance? Evidence from
Europe." Journal of Banking & Finance 31: 2205-2230.
1033
Brynjolfsson, E. (1993). "The productivity Paradox of information technology."
Association for Computing Machinery. Communications of the ACM 36(12): 67-78.
Courtney, L. M. (1993). An Empirical Study of the Relationship between Information
Technology Investment and Corporate Productivity, University of Texas at Arlington. Graduate
School of Business Administration. Ph. D. Dissertations.
Dewan, S., & Min, C. K. (1997). "The substitution of information technology for other
factors of production: A firm level analysis." Management Science 43(12): 1660-1675.
Gopal, R. D., Wang, C. H., & Zionts, S. (1992). Use of Data Envelopment Analysis in
Assessing Information Technology Impact on Firm Performance. School of Management, State
University of New York at Buffalo.
Hitt, L., & Brynjolfsson, E. (1996). "Productivity, profit and consumer welfare: Three
different measures of information technology value." MIS Quarterly 20(2): 121-142.
Huong and Nhu (2019). “The impact of information and communication technology on
bank performance: a evidence in Vietnam” Bank Technology Review 2(3): 36-46
Hung.N.V (2008). Analysis of factors affecting the performance of commercial banks
in Vietnam, Doctoral thesis, National Economics University, Hanoi, Vietnam
Landauer, T. (1995). The Trouble with Computers: Usefulness. Usability, and
Productivity. MIT Press, Cambridge, MA.
Solow, R. (1987). "We'd better watch out." New York Times Book Review: 36.
Strassmann, P. (1990). The Business Value of Computers: An Executive’s Guide. The
Information Economic Press, New Canaan, Connecticut.
Weill, P. (1992). "The relationship between investment and information technology and
firm performance: A study of the valve in manufacturing sector." Information Systems
Research 3(4): 307-333.
1034