Báo cáo khoa học: "Linguistic Variation and Computation" potx
Bạn đang xem bản rút gọn của tài liệu. Xem và tải ngay bản đầy đủ của tài liệu tại đây (593.41 KB, 8 trang )
Linguistic Variation and Computation
John Nerbonne
Alfa-informatica, BCN, University of Groningen
9700 AS Groningen, The Netherlands
Abstract
Language variationists study how lan-
guages vary along geographical or so-
cial lines or along lines of age and
gender. Variationist data is available
and challenging, in particular for
DI-
ALECTOLOGY,
the study of geograph-
ical variation, which will be the focus
of this paper, although we present ap-
proaches we expect to transfer smoothly
to the study of variation correlating with
other extralinguistic variables. Tech-
niques from computational linguistics
on the one hand, and standard statis-
tical data reduction techniques on the
other, not only shed light on this clas-
sic linguistic problem, but they also sug-
gest avenues for exploring the question
at more abstract levels, and perhaps for
seeking the determinants of variation.
1 Introduction
The study of language variation has always been
an important aspect of linguistic research. It pro-
vides insights into historical, social and geograph-
ical factors of language use in society. GilHeron,
the father of French dialectology, was, for exam-
ple, famous for showing that several linguistic di-
visions, running roughly East-West across French,
corresponded closely with well established cul-
tural divisions, in particular the ethnic split be-
tween slightly Romanized Celts in the North, and
thoroughly Romanized non-Celts in the South, the
legal division between the common law North and
the Roman law South, and patterns of agricul-
ture and architecture (see Chambers and Trudg-
ill (1980, pp.111-123)). In recent years theoreti-
cians have also turned increasingly to the study
of dialects as a means of demarcating the possible
range of human language in more detail (Beninca,
1987). The present paper sketches some ways in
which techniques from computational linguistics
(CL) can be put to use in the study of variation.
Language variationists study how languages
vary along geographical or social lines or along
lines of age and gender. Variationist data is
available and challenging, in particular for
DI-
ALECTOLOGY,
the study of geographical varia-
tion, which will be the focus of this paper, al-
though we present approaches we expect to trans-
fer smoothly to the study of variation correlat-
ing with other extralinguistic variables. Most
non-computational studies focus on a small num-
ber of features and cannot characterize
AGGRE-
GATE
levels, e.g., the Bavarian dialect or the lan-
guage of London teenagers, using these few char-
acteristics. Aggregate characterizations are elu-
sive because large data sets invariably contain
counter-indicating tendencies leading to the ana-
lytical challenge of characterizing notions of ag-
gregate levels without simply insisting on the im-
portance of one's favorite features. Techniques
from computational linguistics on the one hand,
and standard statistical data reduction techniques
on the other, not only shed light on this classic lin-
guistic problem, but they also suggest avenues for
exploring the question at more abstract levels, and
3
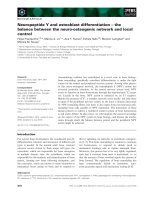
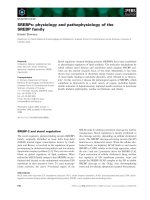
Figure 1: Bloomfield's (1933:328) classical discussion of the problems of determining dialect areas. The
vowels in Dutch
huis, muis
('house', 'mouse') were the same historically, but they do not determine
dialect areas satisfactorily.
perhaps for seeking the determinants of variation.
2 Computational Dialectology
Given a large amount of dialect data, there is
a good chance that one will encounter "noise",
i.e., inaccuracy, non-geographic variability, and
incompatibility both in the choice of information
recorded and in the level of detail at which it is
recorded. There are also many linguistic features
to explore, and many ways of combining them. It
is in general a salutary effect of a computational
approach that data is checked for conformity to
specifications.
A second, much more delayed effect of a com-
putational approach is the explicitness of data
analysis techniques and the relative confidence
this inspires in seeking out problems in data. Ner-
bonne and Kleiweg (2003) postulate that con-
flicting fieldworkers' methods confound studies
of lexical variation based on the LAMSAS data
set, available at
.
edu/lamsas,
and they offer as confirmation
the hugely varying number of responses per item
which different field workers offered.
But these are general benefits of computational
analysis; specific CL techniques have also been
demonstrated to contribute to dialectology. We
turn to these now.
2.1 Aggregate Differences
Dialectology has been studied for over a century,
and several challenges are well-known. Bloom-
field (1933)
inter alia
noted that
ISOGLOSSES-
lines dividing linguistic features on a map—often
do not overlap and so do not jointly define di-
alect areas (see Fig. 1). Bloomfield went on to the
perspicacious remark that it nonetheless seemed
generally true that linguistic differences increased
with geographic distance. Coseriu (
1
1956, 1975)
noted that the problem of non-coinciding distri-
butions is only aggravated as researchers examine
more data in greater detail, noting a tendency to-
ward "atomism" in the entire line of work. A ma-
jor challenge therefore is to move from the level of
describing the geographic distribution of individ-
ual linguistic features such as the vowel in
house,
or the word used to describe the instrument used
to clear snow to a more general level, that of the
4
linguistic variety
used in a particular area or by a
particular group.
In order to rise above the atomistic level of
the individual sounds or lexical items, it is ben-
eficial to employ aggregate measures of distance,
the (non-)identity of lexical items on the one hand
(essentially the same measure proposed by Seguy
(1971), and elaborated on by Goebl (1984)—the
two major figures in DIALECTOMETRY, the exact
study of dialect differences; and a string similar-
ity measure which we apply to phonetic transcrip-
tions on the other (Nerbonne and Heeringa, 1998;
Nerbonne et al., 1999; Heeringa et al., 2002). Be-
cause the measures yield numeric characteriza-
tions of lexical/phonetic distance, it may be aggre-
gated over many pairs of similar concepts.
But the analysis of aggregate levels of distances
is problematic for non-computational work, rely-
ing on hand counts of vocabulary differences or
(at best) manual alignments of phonetic segments.
Computational approaches hold the promise of in-
corporating large amounts of data into analyses,
and simultaneously remaining consistent in the ap-
plication of analytical techniques.
2.2 Pronunciation Distance
Noncomputational analyses treat pronunciation
data as categorical, thus blocking the way to a use-
ful aggregation. A key to aggregating pronuncia-
tion data is to find a legitimate numeric perspec-
tive. One suitable numeric characterization of se-
quence difference is the standard CL algorithm for
the calculation of LEVENSHTEIN distance, also
known as "edit distance" or "sequence distance",
which speech recognition has also used (Kruskal
1
1983, 1999). The Levenshtein algorithm assigns
a measure of difference to pairs of pronunciations
encoded as phonetic transcriptions. Because it is
a true (numeric) measure, it is additive so that it
is meaningful to examine the sum of pronuncia-
tion differences over a large collection of dialectal
material. This provides a view of the
aggregate
differences we called for above. Kessler (1995)
introduced the use of Levenshtein distance to Irish
dialects.
I
I
This is the same algorithm that is also used for align-
ment, e.g., the alignment of bilingual texts (Gale and Church,
1993).
The Levenshtein algorithm calculates the "cost"
of changing one word into another using inser-
tions, deletions and replacements. L-distance
(s
i
8
2
) is the sum of the costs of the cheapest
set of operations changing S
i
to 8
2
. The example
below illustrates Levenshtein distance applied to
Bostonian and standard American pronunciations
of
saw a girl.
sDagIrl delete r
1
spagIl
replace 1/3
2
soag31
insert r
sprag31
Sum distance 4
The example illustrates
one
calculation of dis-
tance. To obtain the least cost, we need to guar-
antee that we examine in principle all possible se-
quences of operations, and the Levenshtein algo-
rithm is in fact effective for this purpose (worst-
time
0(mn) 0(n
2
)
in time, where
n, m
are
the lengths of strings to be compared. The ex-
ample simplifies our procedure for clarity: refine-
ments due to segment similarity are normally used,
as Kessler (1995), Nerbonne and Heeringa (1998)
and Kondrak (2000) illustrate.
Heeringa (2003) studies various ways in which
sequence distances may be generated from ta-
bles of segment distances, including reference to
acoustic distances (curve distance between spec-
trograms) and the use of different feature systems
in order to induce segment distance. In all these
cases replacement costs vary depending on the
segments involved, and, Heeringa further investi-
gates determining the cost of insertions and dele-
tions via a distance between 'silence' and the seg-
ment which is inserted or deleted. Among other
things, Heeringa shows that the best results are ob-
tained using feature systems which had been de-
veloped to measure fidelity in phonetic transcrip-
tion (Vieregge et al., 1984; Almeida and Braun,
1986). What distinguishes these systems from sys-
tems which are designed to facilitate the succinct
statement of phonological rules (e.g., Chomsky
and Halle's system in
The Sound Pattern of En-
glish)
is the following: as segments differ more
perceptually, their feature descriptions tend to dif-
fer more formally.
Vieregge's (1984) system distinguishes four
vowel features, advancement, height, length, and
5
roundedness, as well as ten consonantal features,
including place, voice, nasality, height, distribu-
tiveness, and five binary manner features, includ-
ing stop, glide, lateral, fricative, and flap.
In a series of experiments we have applied
these techniques to data is from
Reeks Neder-
lands(ch)e Dialectatlassen
(Blancquaert and Pee,
1925 1982)), which contains 1,956 Netherlandic
and North Belgian transcriptions of 141 sentences.
We selected over 350 dialects, regularly scattered
over the Dutch language area, and 150 words
which appear in each dialect text, and which con-
tain all vowels and consonants. Comparing each
pair of varieties results in a sum of 150 word-
pair comparisons. Because longer words tend to
be separated by more distance than shorter words,
the distance of each word pair is normalized by
dividing it by the mean lengths of the word pair.
This results in a half-matrix of distances, to which
(i)
clustering may be applied to
CLASSIFY
di-
alects (Aldenderfer and Blashfield, 1984); while
(ii)
multidimensional scaling may be applied to
extract the most significant dimensions (Kruskal
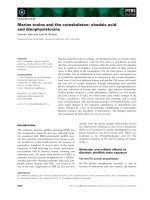
and Wish, 1978). A map is obtained by interpret-
ing MDS dimensions as color intensities and mix-
ing using inverse distance weighting (see Fig. 2).
The maps that are produced distinguish Dutch "di-
alect areas" in a way which non-computational
methods have been unable to do, giving form to
the intuition of dialectologists in Dutch (and other
areas) that the material is best viewed as a "con-
tinuum".
2.2.1 Results
We have confirmed the reliability of the mea-
surements, showing that Cronbach's a > 0.95 at
100 words, and we have validated the technique
using cross-validation on unseen Dutch dialect
data, and also by examining alignments, and by
comparing results to expert consensus (Heeringa
et al., 2002). Ongoing work applies the tech-
nique to questions of convergence/divergence of
dialects using dialect data from two different pe-
riods (Heeringa et al., 2000). Finally, there have
been several experiments on novel data sets, in-
cluding Sardinian, Norwegian and German. See
http : / /www . let, rug. n1/ heeringa
for
papers on these.
2.3 Lemmatizing to Ascertain Lexical
Variation
A second example of the way in which CL tech-
niques may be of service in dialectology comes
from the study of lexical variation. Lexical data is
obtained by asking respondents what words they
use for certain concepts, e.g., by showing a picture
of an object, or by describing it. For example, the
fieldworkers of the Linguistic Atlas of the Middle
and South Atlantic States
(LAMSAS) asked their
respondents the following:
"If the sun comes out after a rain, you
say the weather is doing what?"
to which question they received over 40 different
answers, including:
clearing, clears up, clearing up, fair off
fairing, fairing off faired off fairs off,
See
http : //hyde park .uga edu/
lamsas
for an excellent facility for brows-
ing this dialectological data. The problem is
that the data reflects not only lexical variation,
but also inflection variation. Since LAMSAS
consists of 1162 interviews with an average of
160 responses/interview, it is not an option to
sort the response for lexical identity by hand. In
this case it would have been ideal to apply the
standard CL technique of lemmatizing the data.
Not having a lemmatizer at hand, we applied
the poor man's lemmatizer, the Porter stemmer,
to extract the relevant information from the
strings. It is publicly available at several places.
The example below of its output shows that it
filters a great deal of dialectologically interesting
information, but in every case this is information
about
morphological, not
lexical
variation.
a hundr year
a hundred year
a hundr year
a hundred years
abat
abated
abat
abating
blew
blew
blew
blewed
ceas
cease
ceas
ceased
ceas
ceases
ceas
ceasing
6
come=
•
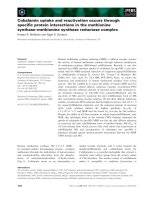
Figure 2: The most significant dimensions in average Levenshtein distance, as identified by multi-
dimensional scaling, are colored red, green and blue. The map gives form to the dialectologist's intuition
that dialects exist "on a continuum," within which, however significant differences emerges. The Frisian
dialects (blue), Saxon (dark green), Limburg (red), and Flemish (yellow-green) are clearly distinct. (In
case you have printed this on a grey-tone printer, see
http: //www . let . rug .n1/
-
nerbonne/
papers/tw
—
se
—
mm.
p s for the correct color rendition.
2.3.1 Results
It turns out that lexical variation is considerably
less consistent than pronunciation variation, show-
ing a Cronbach's
a =
0.62 at 65 words. To obtain
similar levels of consistency as pronunciation, we
should need an order of magnitude more data. On
the one hand this reflects that fact that pronunci-
ation contains a good deal more information that
lexical identity alone, since the average word con-
tains almost five segments. We normalize for work
length, but since the normalization (an average dif-
ference per segment) stabilizes the measure, the
larger number of segments still plays a role in ex-
plaining the greater consistency of pronunciation.
The effect of the larger number of components is
not sufficient to explain the greater consistency of
pronunciation data, however. It remains the case
that pronunciation is the better measure, and we
suspect that this is due to the fact that lexis is
simply more volatile than pronunciation. While
pronunciations tend to be stable, we acquire new
words easily and in great numbers.
In still unpublished work we examine the de-
gree to which pronunciation and lexical varia-
tion correlate. Dialectologists generally claim that
these two levels "coincide fairly well" (Kurath and
McDavid, 1961), but when we calculate the cor-
relation between lexical and pronunciation differ-
7
ences in the LAMSAS data (which Kurath and
McDavid wrote about), we do not find a partic-
ularly strong correlation, viz., r = 0.65. If we
think of a linguistic variety as a coherent collec-
tion of linguistic material subject to the same pres-
sures to conformity—both as a sign of social be-
longing and more profoundly as a requisite for
communication—then we might have expected the
various linguistic levels such as pronunciation and
lexis to correlate more closely.
3 Toward Explanation
The distance-based characterization of language
variation provides a novel perspective on the char-
acterization of the geographical distribution of
linguistic variants. Although the distribution of
concrete linguistic features has resisted aggregate
characterization and therefore explanation, it may
turn out that there are satisfying explanatory char-
acterizations of the linguistic
distance
between
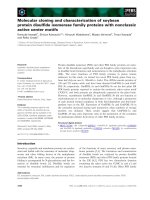
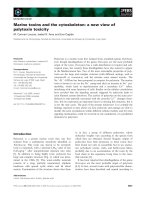
variants. Fig. 3 shows the result of a regression
analysis which sought to explain pronunciation
distance in terms of geographical distance for a
small set of Dutch dialects. The form of the ques-
tion in Fig.3 was also implicit in Seguy (1971),
who, however, focused on lexical variation. The
sample of sites (towns) was chosen to stretch along
a line from the Southwest to the Northeast of the
Dutch speaking area. Pronunciation distance and
the logarithm of geographic distance correlated in
this sample highly (r = 0.89), so pure geogra-
phy appears to account for 80% of the the vari-
ance in the data (r
2
= 0.8). Although further
work has suggested that the sample of towns and
villages was chosen in a way that inflated these
figures (more typical levels range for the Dutch
data suggest r 0.75 as a general level, and data
from other languages often yields still lower lev-
els), still the form of the analysis is suggestive as
an approach to asking for the determinants of di-
alectal variation.
Trudgill (1983, Chap. 3) calls for more at-
tention to the question what determines linguistic
variation—and Heeringa and Nerbonne's (2002)
analysis sketched above suggests a path toward
answers. We may begin to inquire about the de-
terminants of linguistic variation from a different
perspective. For a first example, if sheer geo-
graphic distance is a good predictor of linguistic
(pronunciation) difference, shouldn't travel time
be somewhat better, since it is likely to predict the
chance of social contact more accurately? Can we
show this more convincingly by examining vari-
ation in countries with varying geographies, e.g.,
mountain ranges? Second, older maps and dis-
cussions often partition dialects into several non-
overlapping areas, suggesting that linguistic dis-
tances ought to be predicted by these. The names
of areas even suggest that 'tribal' history played
a role (involving, e.g., Franks, Saxons, Aleman-
nians, and Bavarians). Which is the better pre-
dictor, geography or tribal area? Third, Trudg-
ill's own "gravitational" model suggests that ge-
ography together with settlement size should pre-
dict best, and this is plausible, given their effect
on the chance for social contact, which in turn ex-
erts pressure to reduce variation (in order to allow
communication). At least we have the methodol-
ogy to address suggest questions given the back-
ground of work sketched above.
Let me emphasize that the last paragraph is in-
tended to inspire rather than to report. We have
not demonstrated what the determinants of dialect
distance are, and we should not be misunderstood
as claiming this. But the application of CL tech-
niques has led to the development of a measure
that can claim to reflect pronunciation and lexical
differences faithfully, and this opens the way to
standard quantificational analyses of these differ-
ences.
4 Conclusions
There have been several immediate benefits to ap-
proaching dialectology computationally. Several
studies have involved digitizing large amounts of
data and implementing software such as lexical
analyzers to ensure conformity to specifications.
As we have come to trust the techniques devel-
oped, we have on occasion suggested that some
data is confounded in subtle ways (Nerbonne and
Kleiweg, 2003).
This paper has focus on the the application of
string edit distance to phonetic transcriptions on
the one hand and the use of lemmatization or stem-
ming on the other. Edit distance provides a mea-
sure of pronunciation distance which may be ag-
8
▪
observed
▪
logarithmic
geographic distance
Figure 3: Average pronunciation distances as a logarithm function of geographic distances. Points are
connected in order to illustrate the range of variation for average Levenshtein (pronunciation) distance.
Note that the logarithmic line seems to overestimate the pronunciation differences associated with greater
distances. Reproduced from Heeringa and Nerbonne (2002).
gregated over large samples of phonetic transcrip-
tions solved a long-standing problem in the choice
of features on which dialect divisions should be
based and providing a firmer foundation to the
frequently voiced sentiment of dialectologists that
they were dealing with a "continuum" of varia-
tion. The application of stemming or lemmati-
zation is less ambitious, but nonetheless allows
a systematic view of lexical variation abstracting
away from inflection that would otherwise be in-
feasible.
These and other computational forays enable
a reformulation of key dialectological questions.
We can, for example, reformulate the question of
the determinants of dialectal variation in a way
that focuses on distance, rather than on the con-
crete realization of particular linguistic variants.
We illustrated this opportunity by providing the re-
sults of a regression analysis in which we predict
dialectological distance as a logarithmic function
of geographical distance. It is clear that similar
analyses, exploring the importance of other fac-
tors, may be carried out straightforwardly.
4.1 Prospectus
Computational Linguistics is often defined as "the
scientific study of language from a computational
perspective" (see, e.g., the definition which the
Association for Computational Linguistics offers
at its web site,
/>which ought to interact broadly with lots of lin-
guistic subfields, since Linguistics is normally de-
fined as "the study of language"
(see
the web site
of the Linguistic Society of America at
http:
//www.lsadc . org/)
but in practice there's of-
ten a narrow focus on morphology and
syntax,
perhaps together with lexical semantics, and their
processing. Worse, outsiders commonly
view
CL
as limited to computational applications having to
do with language. But there are opportunities for
computational contributions in any number of sub-
fields of Linguistics. This paper has tried to illu-
minate work on one such subfield, but
I
hope that
it will encourage more.
5 Acknowledgments
Wilbert Heeringa and Peter Kleiweg have been
have been intelligent co-developers of these ideas,
9
and they have implemented all the programs de-
scribed here. Software to support dialectom-
etry is available at
ht tp : / /www .
let .
rug .
n1/
-
kleiweg/levenshtein/.
Brett Kessler. 1995. Computational dialectology in
Irish Gaelic. In
Proc. of the European ACL,
pages
60-67, Dublin.
Grzegorz Kondrak. 2000. A new algorithm for the
alignment of phonetic sequences. In Proc. 1st North
American ACL,
pages 288-293, Seattle. ACL.
References
Mark S. Aldenderfer and Roger K. Blashfield. 1984.
Cluster Analysis.
Quantitative Applications in the
Social Sciences. Sage, Beverly Hills.
Almerindo Almeida and Angelika Braun.
1986.
Richtig' und 'Falsch' in phonetischer Transkrip-
tion: Vorschlage zum Vergleich von Transkriptionen
mit Beispielen aus deutschen Dialekten.
Zeitschrift
fiir Dialektologie und Linguistik,
LIII(2):158-172.
P. Beninca, editor. 1987.
Dialect Variation in the The-
ory of Grammar.
Foris, Dordrecht.
E. Blancquaert and W. Pee. 1925-1982.
Reeks Neder-
landse Dialectatlassen.
De Sikkel, Antwerpen.
Leonard Bloomfield. 1933.
Language.
Holt, Rhine-
hart and Winston, New York.
Jack Chambers and Peter Trudgill. 1980.
Dialectol-
ogy.
Cambridge University Press, Cambridge.
William A. Gale and Kenneth W. Church. 1993. A
program for aligning sentences in bilingual corpora.
Computational Linguistics, 19(1):75-102.
Hans Goebl. 1984.
Dialektometrische Studien: An-
hand italoromanischer, ratoromanischer und gal-
loromanischer Sprachmaterialien aus AIS und ALF.
3 Vol.
Max Niemeyer, Tlibingen.
Wilbert Heeringa and John Nerbonne. 2002. Dialect
areas and dialect continua.
Language Variation and
Change,
13:375-398.
Wilbert Heeringa, John Nerbonne, Hermann Niebaum,
and Rogier Nieuweboer. 2000. Measuring Dutch-
German contact in and around Bentheim. In Dicky
Gilbers, John Nerbonne, and Jos Schaeken, edi-
tors,
Languages in Contact,
pages 145-156. Rodopi,
Amsterdam-Atlanta.
Wilbert Heeringa, John Nerbonne, and Peter Kleiweg.
2002. Validating dialect comparison methods. In
Wolfgang Gaul and Gerd Ritter, editors,
Proceed-
ings of the 24th Annual Meeting of the Gesellschaft
.
fiir Klassifikation,
pages 445-452. Springer, Heidel-
berg.
Wilbert Heeringa. 2003.
Computational Comparison
and Classification of Dialects.
Ph.D. thesis, Univer-
sity of Groningen. in preparation, 2/03.
Joseph Kruskal and Myron Wish. 1978.
Multidimen-
sional Scaling.
Sage, Beverly Hills.
Hans Kurath and Raven McDavid. 1961.
The Pronun-
ciation of English in the Atlantic States : Based upon
the Collections of the Linguistic Atlas of the Eastern
United States.
University of Michigan Press, Ann
Arbor.
John Nerbonne and Wilbert Heeringa. 1998. Compu-
tationele vergelijking en classificatie van dialecten.
Taal en Tongval,
50(2):164-193.
John Nerbonne and Peter Kleiweg. 2003. Lexical vari-
ation in LAMSAS.
Computers and the Humanities.
Accepted to appear.
John Nerbonne, Wilbert Heeringa, and Peter Kleiweg.
1999. Edit distance and dialect proximity. In David
Sankoff and Joseph Kruskal, editors,
Time Warps,
String Edits and Macromolecules: The Theory and
Practice of Sequence Comparison, 2nd ed.,
pages v-
xv. CSLI, Stanford, CA.
Jean Seguy. 1971. La relation entre la distance spa-
tiale et la distance lexicale.
Revue de Linguistique
Romane,
35:335-357.
Peter Trudgill. 1983.
On Dialect. Social and Geo-
graphical Perspectives.
Blackwell, Oxford.
Wilhelm H. Vieregge, A.C.M.Rietveld, and Carel
Jansen. 1984. A distinctive feature based system for
the evaluation of segmental transcription in dutch.
In Marcel P.R. van den Broecke and A. Cohen, ed-
itors,
Proc. of the 10th International Congress of
Phonetic Sciences,
pages 654-659, Dordrecht.
10