Báo cáo khoa học: " A Framework for Evaluating Spoken Dialogue Agents" docx
Bạn đang xem bản rút gọn của tài liệu. Xem và tải ngay bản đầy đủ của tài liệu tại đây (968.75 KB, 10 trang )
PARADISE: A Framework for Evaluating Spoken Dialogue Agents
Marilyn A. Walker, Diane J. Litman, Candace A. Kamm and Alicia Abella
AT&T Labs Research
180 Park Avenue
Florham Park, NJ 07932-0971 USA
walker, diane,cak,
Abstract
This paper presents PARADISE (PARAdigm
for Dialogue System Evaluation), a general
framework for evaluating spoken dialogue
agents. The framework decouples task require-
ments from an agent's dialogue behaviors, sup-
ports comparisons among dialogue strategies,
enables the calculation of performance over
subdialogues and whole dialogues, specifies
the relative contribution of various factors to
performance, and makes it possible to compare
agents performing different tasks by normaliz-
ing for task complexity.
1 Introduction
Recent advances in dialogue modeling, speech recogni-
tion, and natural language processing have made it possi-
ble to build spoken dialogue agents for a wide variety of
applications, n Potential benefits of such agents include
remote or hands-free access, ease of use, naturalness,
and greater efficiency of interaction. However, a critical
obstacle to progress in this area is the lack of a general
framework for evaluating and comparing the performance
of different dialogue agents.
One widely used approach to evaluation is based on the
notion of a reference answer (Hirschman et al., 1990). An
agent's responses to a query are compared with a prede-
fined key of minimum and maximum reference answers;
performance is the proportion of responses that match the
key. This approach has many widely acknowledged lim-
itations (Hirschman and Pao, 1993; Danieli et al., 1992;
Bates and Ayuso, 1993), e.g., although there may be many
potential dialogue strategies for carrying out a task, the
key is tied to one particular dialogue strategy.
In contrast, agents using different dialogue strategies
can be compared with measures such as inappropri-
ate utterance ratio, turn correction ratio, concept accu-
racy, implicit recovery and transaction success (Danieli
LWe use the term agent to emphasize the fact that we are
evaluating a speaking entity that may have a personality. Read-
ers who wish to may substitute the word "system" wherever
"agent" is used.
and Gerbino, 1995; Hirschman and Pao, 1993; Po-
lifroni et al., 1992; Simpson and Fraser, 1993; Shriberg,
Wade, and Price, 1992). Consider a comparison of two
train timetable information agents (Danieli and Gerbino,
1995), where Agent A in Dialogue I uses an explicit con-
firmation strategy, while Agent B in Dialogue 2 uses an
implicit confirmation strategy:
(1) User: I want to go from Torino to Milano.
Agent A: Do you want to go from Trento to Milano?
Yes or No?
User: No.
(2) User: I want to travel from Torino to Milano.
Agent B: At which time do you want to leave from
Merano to Milano?
User: No, I want to leave from Torino in the evening.
Danieli and Gerbino found that Agent A had a higher
transaction success rate and produced less inappropriate
and repair utterances than Agent B, and thus concluded
that Agent A was more robust than Agent B.
However, one limitation of both this approach and the
reference answer approach is the inability to generalize
results to other tasks and environments (Fraser, 1995).
Such generalization requires the identification of factors
that affect performance (Cohen, 1995; Sparck-Jones and
Galliers, 1996). For example, while Danieli and Gerbino
found that Agent A's dialogue strategy produced dia-
logues that were approximately twice as long as Agent
B's, they had no way of determining whether Agent A's
higher transaction success or Agent B's efficiency was
more critical to performance. In addition to agent factors
such as dialogue strategy, task factors such as database
size and environmental factors such as background noise
may also be relevant predictors of performance.
These approaches are also limited in that they currently
do not calculate performance over subdialogues as well as
whole dialogues, correlate performance with an external
validation criterion, or normalize performance for task
complexity.
This paper describes PARADISE, a general framework
for evaluating spoken dialogue agents that addresses these
limitations. PARADISE supports comparisons among di-
alogue strategies by providing a task representation that
decouples
what
an agent needs to achieve in terms of
271
I MAXIMIZE USER SATISFACTION[
l
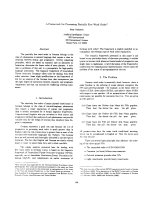
Figure 1: PARADISE's structure of objectives for spoken
dialogue performance
the task requirements from
how
the agent carries out the
task via dialogue. PARADISE uses a decision-theoretic
framework to specify the relative contribution of various
factors to an agent's overall
performance.
Performance
is modeled as a weighted function of a task-based suc-
cess measure and dialogue-based cost measures, where
weights are computed by correlating user satisfaction
with performance. Also, performance can be calculated
for subdialogues as well as whole dialogues. Since the
goal of this paper is to explain and illustrate the appli-
cation of the PARADISE framework, for expository pur-
poses, the paper uses simplified domains with hypothet-
ical data throughout. Section 2 describes PARADISE's
performance model, and Section 3 discusses its general-
ity, before concluding in Section 4.
2 A Performance Model for Dialogue
PARADISE uses methods from decision theory (Keeney
and Raiffa, 1976; Doyle, 1992) to combine a disparate
set of performance measures (i.e., user satisfaction, task
success, and dialogue cost, all of which have been pre-
viously noted in the literature) into a single performance
evaluation function. The use of decision theory requires a
specification of both the objectives of the decision prob-
lem and a set of measures (known as attributes in de-
cision theory) for operationalizing the objectives. The
PARADISE model is based on the structure of objectives
(rectangles) shown in Figure 1. The PARADISE model
posits that performance can be correlated with a mean-
ingful external criterion such as usability, and thus that
the overall goal of a spoken dialogue agent is to maxi-
mize an objective related to usability. User satisfaction
ratings (Kamm, 1995; Shriberg, Wade, and Price, 1992;
Polifroni et al., 1992) have been frequently used in the
literature as an external indicator of the usability of a di-
alogue agent. The model further posits that two types of
factors are potential relevant contributors to user satisfac-
tion (namely task success and dialogue costs), and that
two types of factors are potential relevant contributors to
costs (Walker, 1996).
In addition to the use of decision theory to create this
objective structure, other novel aspects of PARADISE
include the use of the Kappa coefficient (Carletta, 1996;
Siegel and Castellan, 1988) to operationalize task suc-
cess, and the use of linear regression to quantify the rel-
ative contribution of the success and cost factors to user
satisfaction.
The remainder of this section explains the measures
(ovals in Figure 1) used to operationalize the set of objec-
tives, and the methodology for estimating a quantitative
performance function that reflects the objective structure.
Section 2.1 describes PARADISE's task representation,
which is needed to calculate the task-based success mea-
sure described in Section 2.2. Section 2.3 describes the
cost measures considered in PARADISE, which reflect
both the efficiency and the naturalness of an agent's dia-
logue behaviors. Section 2.4 describes the use of linear
regression and user satisfaction to estimate the relative
contribution of the success and cost measures in a single
performance function. Finally, Section 2.5 explains how
performance can be calculated for subdialogues as well
as whole dialogues, while Section 2.6 summarizes the
method.
2.1 Tasks as Attribute Value Matrices
A general evaluation framework requires a task represen-
tation that decouples
what
an agent and user accomplish
from
how
the task is accomplished using dialogue strate-
gies. We propose that an
attribute value matrix (AVM)
can represent many dialogue tasks. This consists of the
information that must be exchanged between the agent
and the user during the dialogue, represented as a set of
ordered pairs of attributes and their possible values. 2
As a first illustrative example, consider a simplification
of the train timetable domain of Dialogues 1 and 2, where
the timetable only contains information about rush-hour
trains between four cities, as shown in Table 1. This AVM
consists of four attributes (abbreviations for each attribute
name are also shown). 3 In Table 1, these attribute-value
pairs are annotated with the direction of information flow
to represent who acquires the information, although this
information is not used for evaluation. During the dia-
logue the agent must acquire from the user the values of
DC, AC, and DR, while the user must acquire DT.
Performance evaluation for an agent requires a corpus
of dialogues between users and the agent, in which users
execute a set of scenarios. Each scenario execution has
2For infinite sets of values, actual values found in the exper-
imental data constitute the required finite set.
3The AVM serves as an evaluation mechanism only. We are
not claiming that AVMs determine an agent's behavior or serve
as an utterance's semantic representation.
272
attribute possible values information flow
depart-city (DC)
arrival-city (AC)
depart-range (DR)
depart-time (DT)
Milano, Roma. Torino, Trento
Milano, Roma, Torino,
Trento
morning,evening
6am,8am,6pm,Spm
to
agent
to agent
to agent
to user
Table 1: Attribute value matrix, simplified train timetable
domain
A 1 : Hello, This is Train Enquiry Service. DC,AC,DR,DT
Please speak after
the tone.
DC,AC,DR,DT
Which information do you need? DC,AC,DR,DT
U 1: I want to go from Torino to Milano. DC,AC
A2: Do you want to go from Trento to Milano? DC,AC
Yes or No? DC,AC
U2: No. DC,AC
A3: Do you want to leave from Trento? DC
Yes or No? DC
U3: No. DC
A4: Where
do you
want to leave from? DC
U4: I want to leave from Torino. DC
A5: Do you want to leave from Torino? DC
Yes or No? DC
U5: Yes. DC
A6: Do you want to go to Milano? AC
U6: Yes. AC
A7: At which time
do you
want to leave? DR
U7: I want to travel in the evening. DR
A8: Do you want to leave between 6 and 9 p.m.? DR
Yes or No? DR
U8: Yes. DR
A9: There is a train leaving at 8:00 p.m. DT
Figure 2: Agent A dialogue interaction (Danieli and
Gerbino, 1995)
a corresponding AVM instantiation indicating the task
information requirements for the scenario, where each
attribute is paired with the attribute value obtained via
the dialogue.
For example, assume that a scenario requires the user
to find a train from Torino to Milano that leaves in the
evening, as in the longer versions of Dialogues 1 and 2 in
Figures 2 and 3.4 Table 2 contains an AVM corresponding
to a "key" for this scenario. All dialogues resulting from
execution of this scenario in which the agent and the
user correctly convey all attribute values (as in Figures
2 and 3) would have the same AVM as the scenario key
in Table 2. The AVMs of the remaining dialogues would
differ from the key by at least one value. Thus, even
though the dialogue strategies in Figures 2 and 3 are
radically different, the AVM task representation for these
dialogues is identical and the performance of the system
for the same task can thus be assessed on the basis of the
AVM representation.
2.2 Measuring Task Success
Success at the task for a whole dialogue (or subdia-
logue) is measured by how well the agent and user achieve
the information requirements of the task by the end of the
4These dialogues have been slightly modified from (Danieli
and Gerbino, 1995). The attribute names at the end of each
utterance will be explained below.
B I : Hello, This is Train Enquiry Service. DC,AC,DILDT
Please speak after
the tone.
DC,AC,DR,DT
Which information
do you need?
DC,AC,DR,DT
U 1 : I want to travel from Torino to Milano. DC,AC
B2: At which time
do you
want to leave
from Merano to Milano? DC,AC,DR
U2: No, I want to leave from Torino
in the evening. DC, DR
B3: Do you want to leave from Torino
between 6 and 11 p.m? DC, DR
Plees~ answer Yes or No. DC, DR
U3: Yes. DC, DR
B4: A train leaves at 8 p.m. DT
Figure 3: Agent B dialogue interaction (Danieli and
Gerbino, 1995)
attribute actual value
depart-city Torino
arrival-city Milano
depart-range evening
depart-time 8pm
Table 2: Attribute value matrix instantiation, scenario
key for Dialogues 1 and 2
dialogue (or subdialogue). This section explains how
PARADISE uses the Kappa coefficient (Carletta, 1996;
Siegel and Castellan, 1988) to operationalize the task-
based success measure in Figure 1.
The Kappa coefficient, ~, is calculated from a confu-
sion matrix that summarizes how well an agent achieves
the information requirements of a particular task for a set
of dialogues instantiating a set of scenarios, s For exam-
ple, Tables 3 and 4 show two hypothetical confusion ma-
trices that could have been generated in an evaluation of
100 complete dialogues with each of two train timetable
agents A and B (perhaps using the confirmation strategies
illustrated in Figures 2 and 3, respectively), 6 The values
in the matrix cells are based on comparisons between the
dialogue and scenario key AVMs. Whenever an attribute
value in a dialogue (i.e., data) AVM
matches
the value in
its scenario key, the number in the appropriate diagonal
cell of the matrix (boldface for clarity) is incremented
by 1. The off diagonal cells represent
misunderstand-
ings
that are not corrected in the dialogue. Note that
depending on the strategy that a spoken dialogue agent
uses, confusions across attributes are possible, e.g., "Mi-
lano " could be confused with "morning." The effect of
misunderstandings that
are
corrected during the course
of the dialogue are reflected in the costs associated with
the dialogue, as will be discussed below.
The first matrix summarizes how the 100 AVMs rep-
resenting each dialogue with Agent A compare with the
AVMs representing the relevant scenario keys, while the
5Confusion matrices can be constructed to summarize the
result of dialogues for any subset of the scenarios, attributes,
users or dialogues.
~The distributions in the tables were roughly based on per-
formance results in (Danieli and Gerbino, 1995).
273
DATA
vl
v2
v3
v4
v5
v6
v7
v8
v9
vlO
vii
v12
v13
vl4
sum
KEY
DEPART.CITY ARRIVAL-CTrY DEPART-RANGE DEPART-TIME
vl v2 v3 v4 v5 v6 v7 v8 v9 vl0 vii v12 v13 v14
22 1 3
29
4 16 4 I
1 1 5 11 1
3 20
22
2 1 1 20 5
1 1 2 8 15
45
10
5 40
oIBI~
15 25 25 30 20
50 50
20 2
I 19 2 4
2 18
2 6 3
21
25 25 25 25
Table 3: Confusion matrix, Agent A
DEPART-CITY
DATA vl v2 v3 v4
v!
16 1
v2 1 20 1
v3 5 1 9 4
v4 1 2 6 6
v5 4
v6 1 6
v7 5 2
v8 1 3 3
v9 2
vl0
vii
v12
v13
v14
sum 30 30 25 15
ARR2VAL-CITY
v5 v6 v7 v8
4
3
2 4
2
15
19
1 1 15
1 2 9
25 25 30
DEPART-RANGE
v9 vl0
3 2
2
3
2 3
4
11
39 10
6 35
20 5O 50
DEPAK'F-TIME
I/E
20 5 5 4
10 5 5
5 5 10 5
5 5 11
25 25 25 25
Table 4: Confusion matrix, Agent B
second matrix summarizes the information exchange with
Agent B. Labels vl to v4 in each matrix represent the
possible values of depart-city shown in Table 1; v5 to
v8 are for arrival-city, etc. Columns represent the key,
specifying which information values the agent and user
were supposed to communicate to one another given a
particular scenario. (The equivalent column sums in both
tables reflects that users of both agents were assumed to
have performed the same scenarios). Rows represent the
data collected from the dialogue corpus, reflecting what
attribute values were actually communicated between the
agent and the user.
Given a confusion matrix M, success at achieving the
information requirements of the task is measured with the
Kappa coefficient (Carletta, 1996; Siegel and Castellan,
1988):
P(A) - P(E)
K
1 - P(E)
P(A) is the proportion of times that the AVMs for the
actual set of dialogues agree with the AVMs for the sce-
nario keys, and P(E) is the proportion of times that the
AVMs for the dialogues and the keys are expected to agree
by chance. 7 When there is no agreement other than that
which would be expected by chance, ~ = 0. When there is
total agreement, ~ = 1. n is superior to other measures of
success such as transaction success (Danieli and Gerbino,
1995), concept accuracy (Simpson and Fraser, 1993), and
percent agreement (Gale, Church, and Yarowsky, 1992)
because n takes into account the inherent complexity of
the task by correcting for chance expected agreement.
Thus ~ provides a basis for comparisons across agents
that are performing
different
tasks.
When the prior distribution of the categories is un-
known, P(E), the expected chance agreement between
the data and the key, can be estimated from the distri-
bution of the values in the keys. This can be calculated
from confusion matrix M, since the columns represent
the values in the keys. In particular:
r~
P(E)
= ~j ,ft_i ~2
L.~, T,
i=l
7~ has been used to measure pairwise agreement among
coders making category judgments (Carletta, 1996; Krippen-
doff, 1980; Siegel and Castellan, 1988). Thus, the observed
user/agent interactions are modeled as a coder, and the ideal
interactions as an expert coder.
274
where ti is the sum of the frequencies in column i of M,
and T is the sum of the frequencies in
M (tl + • • • + tn).
P(A), the actual agreement between the data and the
key, is always computed from the confusion matrix M:
P(A)
-
~'~i~=l M(i, i)
T
Given the confusion matrices in Tables 3 and 4, P(E)
= 0.079 for both agents, s For Agent A, P(A) = 0.795
and • = 0.777, while for Agent B, P(A) = 0.59 and a =
0.555, suggesting that Agent A is more successful than
B in achieving the task goals.
2.3 Measuring Dialogue
Costs
As shown in Figure 1, performance is also a function of a
combination of cost measures. Intuitively, cost measures
should be calculated on the basis of any user or agent
dialogue behaviors that should be minimized. A wide
range of cost measures have been used in previous work;
these include pure efficiency measures such as the num-
ber of turns or elapsed time to complete the task (Abella,
Brown, and Buntschuh, 1996; Hirschman et al., 1990;
Smith and Gordon, 1997; Walker, 1996), as well as mea-
sures of qualitative phenomena such as inappropriate or
repair utterances (Danieli and Gerbino, 1995; Hirschman
and Pao, 1993; Simpson and Fraser, 1993).
PARADISE represents each cost measure as a function
ci that can be applied to any (sub)dialogue. First, consider
the simplest case of calculating efficiency measures over
a whole dialogue. For example, let cl be the total number
of utterances. For the whole dialogue D1 in Figure 2,
el(D1) is 23 utterances. For the whole dialogue D2 in
Figure 3, cl (D2) is 10 utterances.
To calculate costs over subdialogues and for some of
the qualitative measures, it is necessary to be able to spec-
ify which information goals each utterance contributes
to. PARADISE uses its AVM representation to link the
information goals of the task to any arbitrary dialogue
behavior, by tagging the dialogue with the attributes for
the task. 9 This makes it possible to evaluate any potential
dialogue strategies for achieving the task, as well as to
evaluate dialogue strategies that operate at the level of
dialogue subtasks (subdialogues).
Consider the longer versions of Dialogues 1 and 2 in
Figures 2 and 3. Each utterance in Figures 2 and 3 has
been tagged using one or more of the attribute abbrevia-
tions in Table 1, according to the subtask(s) the utterance
contributes to. As a convention of this type of tagging,
SUsing a single confusion matrix for all attributes as in
Tables 3 and 4 inflates n when there are few cross-attribute
confusions by making P(E) smaller. In some cases it might
be desirable to calculate ~; first for identification of attributes
and then for values within attributes, or to average ~ for each
attribute to produce an overall t¢ for the task.
9This tagging can be hand generated, or system generated
and hand corrected. Preliminary studies indicate that reliability
for human tagging is higher for AVM attribute tagging than
for other types of discourse segment tagging (Passonneau and
Litman, 1997; Hirschberg and Nakatani, 1996).
~:E.AC, DR, D
~:AI A9
SEG~cr: S3 S~Ml~Cr: S4
G0~: I£ GOALS: AC
o'rr~cES: A3 u5 0TI/~ES: A6 U6
Figure 4: Task-defined discourse structure of Agent A
dialogue interaction
utterances that contribute to the success of the whole dia-
logue, such as greetings, are tagged with all the attributes.
Since the structure of a dialogue reflects the structure of
the task (Carberry, 1989; Grosz and Sidner, 1986; Litman
and Allen, 1990), the tagging of a dialogue by the AVM
attributes can be used to generate a hierarchical discourse
structure such as that shown in Figure 4 for Dialogue
1 (Figure 2). For example, segment (subdialogue) $2
in Figure 4 is about both depart-city (DC) and arrival-
city (AC). It contains segments $3 and $4 within it, and
consists of utterances U1 U6.
Tagging by AVM attributes is required to calculate
costs over subdialogues, since for any subdialogue, task
attributes define the subdialogue. For subdialogue $4
in Figure 4, which is about the attribute arrival-city and
consists of utterances A6 and U6, ct(S4) is 2.
Tagging by AVM attributes is also required to calculate
the cost of some of the qualitative measures, such as
number of repair utterances. (Note that to calculate such
costs, each utterance in the corpus of dialogues must also
be tagged with respect to the qualitative phenomenon in
question, e.g. whether the utterance is a repair, l°) For
example, let c2 be the number of repair utterances. The
repair utterances in Figure 2 are A3 through U6, thus
c2(D1) is 10 utterances and c2($4) is 2 utterances. The
repair utterance in Figure 3 is U2, but note that according
to the AVM task tagging, U2 simultaneously addresses
the information goals for depart-range. In general, if
an utterance U contributes to the information goals of N
different attributes, each attribute accounts for 1/N of any
costs derivable from U. Thus, c2(D2) is .5.
Given a set of ci, it is necessary to combine the dif-
mPrevious work has shown that this can be done with high
reliability (Hirschman and Pao, 1993).
275
ferent cost measures in order to determine their relative
contribution to performance. The next section explains
how to combine ~ with a set of
ci
to yield an overall
performance measure.
2.4 Estimating a Performance Function
Given the definition of success and costs above and the
model in Figure 1, performance for any (sub)dialogue D
is defined as follows: it
n
Performance = (o~ • .N'(t~)) - ~
wi *
.N'(ci)
i=1
Here ~ is a weight on ~, the cost functions ci are weighted
by wi, and At" is a Z score normalization function (Cohen,
1995).
The normalization function is used to overcome the
problem that the values of ci are not on the same scale as
x, and that the cost measures ci may also be calculated
over widely varying scales (e.g. response delay could
be measured using seconds while, in the example, costs
were calculated in terms of number of utterances). This
problem is easily solved by normalizing each factor x to
its Z score:
N'(x) =
O'.:t:
where ~r= is the standard deviation for x.
user agent US ~ el (#utt) e2 (#rep)
1 A 1 1 46 30
2 A 2 1 50 30
3 A 2 I 52 30
4 A 3 1 40 20
5 A 4 1 23 10
6 A 2 1 50 36
7 A 1 0.46 75 30
8 A 1 0.19 60 30
9 B 6 I 8 0
10 B 5 1 15 1
11 B 6 I 10 0.5
12 B 5 1 20 3
13 B 1 0.L9 45 18
14 B 1 0.46 50 22
15 B 2 0.19 34 18
16 B 2 0.46 40 18
Mean(A) A 2 0.83 49.5 27
Mean(B) B 3.5 0.66 27.8 10,1
Mean NA 2.75 0.75 38,6 18,5
Table 5: Hypothetical performance data from users of
Agents A and B
To illustrate the method for estimating'a performance
function, we will use a subset of the data from Tables 3
and 4, shown in Table 5. Table 5 represents the results
tZWe assume an additive performance (utility) function be-
cause it appears that n and the various cost factors ci are util-
ity independent and additive independent (Keeney and Raiffa,
1976). It is possible however that user satisfaction data col-
lected in future experiments (or other data such as willingness
to pay or use) would indicate otherwise. If so, continuing use of
an additive function might require a transformation of the data,
a reworking of the model shown in Figure 1, or the inclusion of
interaction terms in the model (Cohen, 1995).
from a hypothetical experiment in which eight users were
randomly assigned to communicate with Agent A and
eight users were randomly assigned to communicate with
Agent B. Table 5 shows user satisfaction (US) ratings
(discussed below), ~, number of utterances (#utt) and
number of repair utterances (#rep) for each of these users.
Users 5 and 11 correspond to the dialogues in Figures
2 and 3 respectively. To normalize ct for user 5, we
determine that ~ is 38.6 and crc~ is 18.9. Thus, .N'(cl) is
-0.83. Similarly A/'(cl) for user 11 is -1.51.
To estimate the performance function, the weights
and wi must be solved for. Recall that the claim implicit in
Figure 1 was that the relative contribution of task success
and dialogue costs to performance should be calculated by
considering their contribution to user satisfaction. User
satisfaction is typically calculated with surveys that ask
users to specify the degree to which they agree with one
or more statements about the behavior or the performance
of the system. A single user satisfaction measure can be
calculated from a single question, or as the mean of a
set of ratings. The hypothetical user satisfaction ratings
shown in Table 5 range from a high of 6 to a low of 1.
Given a set of dialogues for which user satisfaction
(US), ~ and the set of ci have been collected experimen-
tally, the weights ~ and
wi
can be solved for using multi-
ple linear regression. Multiple linear regression produces
a set of coefficients (weights) describing the relative con-
tribution of each predictor factor in accounting for the
variance in a predicted factor. In this case, on the basis
of the model in Figure 1, US is treated as the predicted
factor. Normalization of the predictor factors (~ and ci)
to their Z scores guarantees that the relative magnitude
of the coefficients directly indicates the relative contribu-
tion of each factor. Regression on the Table 5 data for
both sets of users tests which factors ~, #utt, #rep most
strongly predicts US.
In this illustrative example, the results of the regression
with all factors included shows that only ~ and #rep are
significant (p < .02). In order to develop a performance
function estimate that includes only significant factors
and eliminates redundancies, a second regression includ-
ing only significant factors must then be done. In this
case, a second regression yields the predictive equation:
Performance = .40.N'(~) - .78.N'(c2)
i.e., c~ is .40 and w2 is .78. The results also show ~ is
significant at p < .0003, #rep significant at p < .0001,
and the combination of ~ and #rep account for 92% of
the variance in US, the external validation criterion. The
factor #utt was not a significant predictor of performance,
in part because #utt and #rep are highly redundant. (The
correlation between #utt and #rep is 0.91).
Given these predictions about the relative contribution
of different factors to performance, it is then possible
to return to the problem first introduced in Section 1:
given potentially conflicting performance criteria such as
robustness and efficiency, how can the performance of
Agent A and Agent B be compared? Given values for
and wi, performance can be calculated for both agents
276
using the equation above. The mean performance of A
is 44 and the mean performance of B is .44, suggesting
that Agent B may perform better than Agent A overall.
The evaluator must then however test these perfor-
mance differences for statistical significance. In this case,
a t test shows that differences are only significant at the p
< .07 level, indicating a trend only. In this case, an eval-
uation over a larger subset of the user population would
probably show significant differences.
2.5 Application to Subdialogues
Since both ~ and ei can be calculated over subdialogues,
performance can also be calculated at the subdialogue
level by using the values for c~ and
wi as
solved for above.
This assumes that the factors that are predictive of global
performance, based on US, generalize as predictors of
local performance, i.e. within subdialogues defined by
subtasks, as defined by the attribute tagging. 12
Consider calculating the performance of the dialogue
strategies used by train timetable Agents A and B, over
the subdialogues that repair the value of depart-city. Seg-
ment $3 (Figure 4) is an example of such a subdialogue
with Agent A. As in the initial estimation of a perfor-
mance function, our analysis requires experimental data,
namely a set of values for ~ and el, and the application of
the Z score normalization function to this data. However,
the values for ~ and ci are now calculated at the subdia-
Iogue rather than the whole dialogue level. In addition,
only data from comparable strategies can be used to cal-
culate the mean and standard deviation for normalization.
Informally, a comparable strategy is one which applies in
the same state and has the same effects.
For example, to calculate ~ for Agent A over the sub-
dialogues that repair depart-city, P(A) and P(E) are com-
puted using only the subpart of Table 3 concerned with
depart-city. For Agent A, P(A) = .78, P(E) = .265, and
= .70. Then, this value of~ is normalized using data from
comparable subdialogues with both Agent A and Agent
B. Based on the data in Tables 3 and 4, the mean ~ is .515
and ~r is .261, so that.M(~c) for Agent A is .71.
To calculate c2 for Agent A, assume that the average
number of repair utterances for Agent A's subdialogues
that repair depart-city is 6, that the mean over all compa-
rable repair subdialogues is 4, and the standard deviation
is 2.79. Then A/'(cz) is .72.
Let Agent A's repair dialogue strategy for subdialogues
repairing depart-city be RA and Agent B's repair strat-
egy for depart-city be RB. Then using the performance
equation above, predicted performance for RA is:
Performance(Ra) = .40 • .71 .78 • .72 = 0.28
For Agent B, using the appropriate subpart of Table
4 to calculate ~, assuming that the average number of
depart-city repair utterances is 1.38, and using similar
12This assumption has a sound basis in theories of dialogue
structure (Carberry, 1989; Grosz and Sidner, 1986; Litman and
Allen, 1990), but should be tested empirically.
calculations, yields
Performance(RB) = .40. 71 - .78 • 94 = 0.45
Thus the results of these experiments predict that when
an agent needs to choose between the repair strategy that
Agent B uses and the repair strategy that Agent A uses
for repairing depart-city, it should use Agent B's strategy
RB, since the performance(RB) is predicted to be greater
than the performance(Ra).
Note that the ability to calculate performance over sub-
dialogues allows us to conduct experiments that simulta-
neously test multiple dialogue strategies. For example,
suppose Agents A and B had different strategies for pre-
senting the value of depart-time (in addition to different
confirmation strategies). Without the ability to calculate
performance over subdialogues, it would be impossible
to test the effect of the different presentation strategies
independently of the different confirmation strategies.
2.6 Summary
We have presented the PARADISE framework, and have
used it to evaluate two hypothetical dialogue agents in a
simplified train timetable task domain. We used PAR-
ADISE to derive a performance function for this task, by
estimating the relative contribution of a set of potential
predictors to user satisfaction. The PARADISE method-
ology consists of the following steps:
• definition of a task and a set of scenarios;
• specification of the AVM task representation;
• experiments with alternate dialogue agents for the
task;
• calculation of user satisfaction using surveys;
• calculation of task success using ~;
• calculation of dialogue cost using efficiency and
qualitative measures;
• estimation of a performance function using linear
regression and values for user satisfaction, K and
dialogue costs;
• comparison with other agents/tasks to determine
which factors generalize;
• refinement of the performance model.
Note that all of these steps are required to develop
the performance function. However once the weights
in the performance function have been solved for, user
satisfaction ratings no longer need to be collected. In-
stead, predictions about user satisfaction can be made on
the basis of the predictor variables, as illustrated in the
application of PARADISE to subdialogues.
Given the current state of knowledge, it is important to
emphasize that researchers should be cautious about gen-
eralizing a derived performance function to other agents.
or tasks. Performance function estimation should be done
iteratively over many different tasks and dialogue strate-
gies to see which factors generalize. In this way, the
field can make progress on identifying the relationship
between various factors and can move towards more pre-
dictive models of spoken dialogue agent performance.
277
3 Generality
In the previous section we used PARADISE to evalu-
ate two confirmation strategies, using as examples fairly
simple information access dialogues in the train timetable
domain. In this section we demonstrate that PARADISE
is applicable to a range of tasks, domains, and dialogues,
by presenting AVMs for two tasks involving more than
information access, and showing how additional dialogue
phenomena can be tagged using AVM attributes.
depart-city
(DC)
arrival-city
(AC)
depart-range
(DR)
depart-time
(DT)
request-type (R'r)
possible values information flow
Milano, Roma, Torino, Trento to agent
Milano, Roma, Torino, Trento to agent
morning,evening to agent
6am,Sam,6pm,8pm to
user
reserve, purchase to agent
I
Table 6: Attribute value matrix, train timetable domain
with requests
First, consider an extension of the train timetable task,
where an agent can handle requests to reserve a seat or
purchase a ticket. This task could be represented using
the AVM in Table 6 (an extension of Table 1), where
the agent must now acquire the value of the attribute
request-type, in order to know what to do with the other
information it has acquired.
U 1: I
want to go from Torino to Roma
DC,AC
C 1:
Approximately what time of day would you like to travel?
DR
U2:
What are the options?
DR
C2:
Morning or evening.
DR
U3:
Are those departure times?
DR
C3: Yes. DR
U4: I'd
like to leave in the morning.
DR
C4: Train 702
leaves Torino Porto at
8 a.m. DT
U5: Please reserve me a seat on that
train. RT
Figure 5: Hypothetical Agent C dialogue interaction
Figure 5 presents a hypothetical dialogue in this ex-
tended task domain, and illustrates user utterance types
and an agent dialogue strategy that are very different from
those in Figures 2 and 3. First, Agent C in Figure 5 uses
a "no confirmation" dialogue strategy, in contrast to the
explicit and implicit confirmation strategies used in Fig-
ures 2 and 3. Second, Figure 5 illustrates new types of
user
utterances that do not directly further the informa-
tional goals of the task. In U2, the user asks the agent
a wh-question about the DR attribute itself, rather than
providing information about that attribute's value. Since
U2 satisfies a knowledge precondition related to answer-
ing C l, U2 contributes to the DR goal and is tagged
as such. In U3, the user similarly asks a yes-no question
that addresses a subgoal related to answering C1. Finally,
U5 illustrates a user request for an agent action, and is
tagged with the RT attribute. The value of RT in the AVM
instantiation for the dialogue would be "reserve"
Second, consider the very different domain and task
of diagnosing a fault and repairing a circuit (Smith and
Gordon, 1997). Figure 6 presents one dialogue from this
domain.
I. C: This
is the circuit fix it shop.
How may I help
you?
2. U:
I want to fix a circuit.
3. C:
What is the ID of the circuit?
4. U:
Rsll 1.
5. C: I
am familiar with that circuit.
The LED is supposed to be displaying
alternately flashing one and seven.
CB
6. U: The LED
is off.
RB
7. C:
What is the switch at when the LED is
off?.
RB
8, U:
The switch is down.
RB
9. C: Put
the switch
up. RB
10. U: Okay.
RB
11. C: Put the knob to one zero.
RB
12. U: Okay. RB
13. C:
What is the LED displaying?
RB
14. U: LED
is displaying only a flashing seven.
RB
15. C: Is there a wire between connector eight four
and connector nine nine?
FT
16. U: No. FT
17. C: Add a
wire between connector eight four
and connector nine
nine.
FC
18. U:
Done.
FC
19. C:
What is the LED displaying?
T
20. U:
Alternately flashing one and seven.
T
2 I. C: Is
the one on the LED displaying for
a
longer period of time?
T
22. U: No. T
23. C: Is
the seven on the LED displaying
for a longer period of time?
T
24. U: No. T
25. C: Put
the knob to zero.
T
26. U: Okay. T
27. C:
What is the LED displaying?
T
28. U:
Alternately displaying one and seven.
T
29. C: Is
the one on the LED displaying
for a longer period of time?
T
30. U: Yes. T
31. C: Put
the switch down.
T
32. U: The
switch is down.
T
33. C:
What is the LED displaying?
T
34. U:
Nothing.
T
35. C:
The circuit is working correctly. Good-bye.
T
ID,CB,RB,FT, FC,T
ID,CB,RB,FT, FC,T
ID,CB,RB,FT, FC,T
ID
ID
CB
Figure 6: A circuit domain dialogue (Smith and Gordon,
1997), with AVM tagging
Smith and Gordon collected 144 dialogues for this task,
in which agent initiative was varied by using different
dialogue strategies, and tagged each dialogue according
to the following subtask structure: 13
• Introduction (I) establish the purpose of the task
. Assessment (A) establish the current behavior
• Diagnosis (D) establish the cause for the errant
behavior
• Repair (R) establish that the correction for the er-
rant behavior has been made
• Test (T) establish that the behavior is now correct
Our informational analysis of this task results in the AVM
shown in Table 7. Note that the attributes are almost
identical to Smith and Gordon's list of subtasks. Circuit-
ID corresponds to Introduction, Correct-Circuit-Behavior
and Current-Circuit-Behavior correspond to Assessment,
t3They report a ~ of.82 for reliability of their tagging scheme.
278
Fault-Type corresponds to Diagnosis, Fault-Correction
corresponds to Repair, and Test corresponds to Test. The
attribute names emphasize information exchange, while
the subtask names emphasize function.
attribute possible values
Circuit-ID (ID) RSI 11, RS112
Correct-Circuit-Behavior (CB) Flash- 1-7, Flash- 1
Current-Circuit-Behavior (RB) Flash-7
Fault-Type (P-'q') MissingWire84-99, MissingWire88-99
Fault-Correction (FC) yes, no
Test
(T)
yes, no
Table 7: Attribute value matrix, circuit domain
Figure 6 is tagged with the attributes from Table 7.
Smith and Gordon's tagging of this dialogue according
to their subtask representation was as follows: turns 1-
4 were I, turns 5-14 were A, turns 15-16 were D, turns
17-18 were R, and turns 19-35 were T. Note that there
are only two differences between the dialogue structures
yielded by the two tagging schemes. First, in our scheme
(Figure 6), the greetings (turns 1 and 2) are tagged with
all the attributes. Second, Smith and Gordon's single
tag A corresponds to two attribute tags in Table 7, which
in our scheme defines an extra level of structure within
assessment subdialogues.
4 Discussion
This paper presented the PARADISE framework for eval-
uating spoken dialogue agents. PARADISE is a gen-
eral framework for evaluating spoken dialogue agents
that integrates and enhances previous work. PARADISE
supports comparisons among dialogue strategies with a
task representation that decouples what an agent needs
to achieve in terms of the task requirements from how
the agent carries out the task via dialogue. Furthermore,
this task representation supports the calculation of perfor-
mance over subdialogues as well as whole dialogues. In
addition, because PARADISE's success measure normal-
izes for task complexity, it provides a basis for comparing
agents performing different tasks.
The PARADISE performance measure is a function of
both task success (~) and dialogue costs (ci), and has
a number of advantages. First, it allows us to evaluate
performance at any level of a dialogue, since n and ci
can be calculated for any dialogue subtask. Since per-
formance can be measured over any subtask, and since
dialogue strategies can range over subdialogues or the
whole dialogue, we can associate performance with indi-
vidual dialogue strategies. Second, because our success
measure n takes into account the complexity of the task,
comparisons can be made across dialogue tasks. Third,
~; allows us to measure partial success at achieving the
task. Fourth, performance can combine both objective
and subjective cost measures, and specifies how to eval-
uate the relative contributions of those costs factors to
overall performance. Finally, to our knowledge, we are
the first to propose using user satisfaction to determine
weights on factors related to performance.
In addition, this approach is broadly integrative, in-
corporating aspects of transaction success, concept accu-
racy, multiple cost measures, and user satisfaction. In our
framework, transaction success is reflected in ~;, corre-
sponding to dialogues with a P(A) of 1. Our performance
measure also captures information similar to concept ac-
curacy, where low concept accuracy scores translate into
either higher costs for acquiring information from the
user, or lower ~ scores.
One limitation of the PARADISE approach is that the
task-based success measure does not reflect that some
solutions might be better than others. For example, in the
train timetable domain, we might like our task-based suc-
cess measure to give higher ratings to agents that suggest
express over local trains, or that provide helpful infor-
mation that was not explicitly requested, especially since
the better solutions might occur in dialogues with higher
costs. It might be possible to address this limitation
by using the interval scaled data version of n (Krippen-
dorf, 1980). Another possibility is to simply substitut*.
a domain-specific task-based success measure in the per-
formance model for n.
The evaluation model presented here has many applica-
tions in apoken dialogue processing. We believe that the
framework is also applicable to other dialogue modal-
ities, and to human-human task-oriented dialogues. In
addition, while there are many proposals in the litera-
ture for algorithms for dialogue strategies that are co-
operative, collaborative or helpful to the user (Webber
and Joshi, 1982; Pollack, Hirschberg, and Webber, 1982;
Joshi, Webber, and Weischedel, 1984; Chu-Carrol and
Carberry, 1995), very few of these strategies have been
evaluated as to whether they improve any measurable as-
pect of a dialogue interaction. As we have demonstrated
here, any dialogue strategy can be evaluated, so it should
be possible to show that a cooperative response, or other
cooperative strategy, actually improves task performance
by reducing costs or increasing task success. We hope
that this framework will be broadly applied in future di-
alogue research.
5 Acknowledgments
We would like to thank James Allen, Jennifer Chu-
Carroll, Morena Danieli, Wieland Eckert, Giuseppe Di
Fabbrizio, Don Hindle, Julia Hirschberg, Shri Narayanan,
Jay Wilpon, Steve Whittaker and three anonymous re-
views for helpful discussion and comments on earlier
versions of this paper.
References
Abella, Alicia, Michael K Brown, and Bruce Buntschuh.
1996. Development principles for dialog-based inter-
faces. In ECAI-96 Spoken Dialog Processing Work-
shop, Budapest, Hungary.
279
Bates, Madeleine and Damaris Ayuso. 1993. A proposal
for incremental dialogue evaluation. In Proceedings of
the DARPA Speech and NL Workshop, pages 319-322.
Carberry, S. 1989. Plan recognition and its use in un-
derstanding dialogue. In A. Kobsa and W. Wahlster,
editors, User Models in Dialogue Systems. Springer
Verlag, Berlin, pages 133-162.
Carletta, Jean C. 1996. Assessing the reliability
of subjective codings. Computational Linguistics,
22(2):249-254.
Chu-Carrol, Jennifer and Sandra Carberry. 1995. Re-
sponse generation in collaborative negotiation. In Pro-
ceedings of the Conference of the 33rd Annual Meet-
ing of the Association for Computational Linguistics,
pages 136-143.
Cohen, Paul. R. 1995. Empirical Methods for Artificial
Intelligence. MIT Press, Boston.
Danieli, M., W. Eckert, N. Fraser, N. Gilbert, M. Guy-
omard, P. Heisterkam p, M. Kharoune, J. Magadur,
S. McGlashan, D. Sadek, J. Siroux, and N. Youd.
1992. Dialogue manager design evaluation. Technical
Report Project Esprit 2218 SUNDIAL, WP6000-D3.
Danieli, Morena and Elisabetta Gerbino. 1995. Metrics
for evaluating dialogue strategies in a spoken language
system. In Proceedings of the 1995 AAAI Spring Sym-
posium on Empirical Methods in Discourse Interpre-
tation and Generation, pages 34-39.
Doyle, Jon. 1992. Rationality and its roles in reasoning.
Computational Intelligence, 8(2):376 409.
Fraser, Norman M. 1995. Quality standards for spoken
dialogue systems: a report on progress in EAGLES. In
ESCA Workshop on Spoken Dialogue Systems Vigso,
Denmark, pages 157-160.
Gale, William, Ken W. Church, and David Yarowsky.
1992. Estimating upper and lower bounds on the per-
formance of word-sense disambiguation programs. In
Proc. of3Oth ACL, pages 249-256, Newark, Delaware.
Grosz, Barbara J. and Candace L. Sidner. 1986. Atten-
tions, intentions and the structure of discourse. Com-
putational Linguistics, 12:175-204.
Hirschberg, Julia and Christine Nakatani. 1996. A
prosodic analysis of discourse segments in direction-
giving monologues. In 34th Annual Meeting of the
Association for Computational Linguistics, pages 286
293.
Hirschman, Lynette, Deborah A. Dahl, Donald P. McKay,
Lewis M. Norton, and Marcia C. Linebarger. 1990.
Beyond class A: A proposal for automatic evaluation
of discourse. In Proceedings of the Speech and Natural
Language Workshop, pages 109-113.
Hirschman, Lynette and Christine Pao. 1993. The cost
of errors in a spoken language system. In Proceedings
of the Third European Conference on Speech Commu-
nication and Technology, pages 1419-1422.
Joshi, Aravind K., Bonnie L. Webber, and Ralph M.
Weischedel. 1984. Preventing false inferences. In
COLING84: Proc. lOth International Conference on
Computational Linguistics., pages 134-138.
Kamm, Candace. 1995. User interfaces for voice appli-
cations. In David Roe and Jay Wilpon, editors, Voice
Communication between Humans and Machines. Na-
tional Academy Press, pages 422 442.
Keeney, Ralph and Howard Raiffa. 1976. Decisions with
Multiple Objectives: Preferences and Value Tradeoffs.
John Wiley and Sons.
Krippendorf, Klaus. 1980. Content Analysis: An Intro-
duction to its Methodology. Sage Publications, Bev-
erly Hills, Ca.
Litman, Diane and James Allen. 1990. Recognizing and
relating discourse intentions and task-oriented plans.
In Philip Cohen, Jerry Morgan, and Martha Pollack,
editors, Intentions in Communication. MIT Press.
Passonneau, Rebecca J. and Diane Litman. 1997. Dis-
course segmentation by human and automated means.
Computational Linguistics, 23(1).
Polifroni, Joseph, Lynette Hirschman, Stephanie Seneff,
and Victor Zue. 1992. Experiments in evaluating in-
teractive spoken language systems. In Proceedings of
the DARPA Speech and NL Workshop, pages 28-33.
Pollack, Martha, Julia Hirschberg, and Bonnie Webber.
1982. User participation in the reasoning process of
expert systems. In Proceedings First National Confer-
ence on Artificial Intelligence, pages pp. 358-361.
Shriberg, Elizabeth, Elizabeth Wade, and Patti Price.
1992. Human-machine problem solving using spo-
ken language systems (SLS): Factors affecting perfor-
mance and user satisfaction. In Proceedings of the
DARPA Speech and NL Workshop, pages 49-54.
Siegel, Sidney and N. J. Castellan. 1988. Nonparametric
Statistics for the Behavioral Sciences. McGraw Hill.
Simpson, A. and N. A. Fraser. 1993. Black box and
glass box evaluation of the SUNDIAL system. In Pro-
ceedings of the Third European Conference on Speech
Communication and Technology, pages 1423-1426.
Smith, Ronnie W. and Steven A. Gordon. 1997. Effects
of variable initiative on linguistic behavior in human-
computer spoken natural language dialog. Computa-
tional Linguistics, 23(1).
Sparck-Jones, Karen and Julia R. Galliers. 1996. Evalu-
ating Natural Language Processing Systems. Springer.
Walker, Marilyn A. 1996. The Effect of Resource Limits
and Task Complexity on Collaborative Planning in Di-
alogue. Artificial Intelligence Journal, 85(1-2): 181-
243.
Webber, Bonnie and Aravind Joshi. 1982. Taking the
initiative in natural language database interaction: Jus-
tifying why. In Coling 82, pages 413 419.
280