- Trang chủ >>
- Khoa Học Tự Nhiên >>
- Vật lý
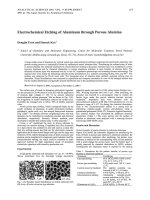
controlling factor of self-ordering of anodic porous alumina
Bạn đang xem bản rút gọn của tài liệu. Xem và tải ngay bản đầy đủ của tài liệu tại đây (1.18 MB, 6 trang )
Controlling Factor of Self-Ordering of Anodic Porous Alumina
Sachiko Ono,
*
,z
Makiko Saito, Miyuki Ishiguro, and Hidetaka Asoh
Department of Applied Chemistry, Faculty of Engineering, Kogakuin University, 1-24-2 Nishi-shinjuku,
Shinjuku-ku, Tokyo 163-8677, Japan
The controlling factor of self-ordering of anodic porous alumina was investigated by focusing on the current density during film
growth. The homogeneity of cell size was improved with increasing formation voltage accompanied by the exponential increase
in current density. The maximum anodizing voltage for proceeding uniform oxide growth while avoiding extremely high current
accompanied by gas evolution was identical with the previously established self-ordering voltage. With the increase in formation
voltage up to the self-ordering voltage, the ratio of pore diameter to cell diameter d
pore
/d
cell
lowered and converged to ϳ0.3
regardless of the electrolyte type. Moreover, domains of highly self-ordered pore arrays were found in the film formed during
burning, where extremely high current was locally concentrated. This suggests that the condition inducing film growth under high
current density, i.e., high electric field strength is the key controlling factor of self-ordering. Based on the above knowledge, a new
self-ordered porous alumina with a 600 nm pore interval was fabricated in citric acid just under the critical voltage of burning.
© 2004 The Electrochemical Society. ͓DOI: 10.1149/1.1767838͔ All rights reserved.
Manuscript submitted September 9, 2003; revised manuscript received February 9, 2004. Available electronically June 25, 2004.
Anodic porous alumina film, a typical self-ordered nanohole ma-
terial formed by anodizing aluminum in an appropriate acidic solu-
tion, is a promising candidate for starting materials of nanofabrica-
tion of various devices.
1-5
Except for the pretexturing methods for
an aluminum substrate such as an imprinting process,
6,7
highly or-
dered self-organizing porous alumina can be obtained only in three
types of electrolyte at individually specified self-ordering voltages,
i.e., sulfuric acid at 25 V, oxalic acid at 40 V, and phosphoric acid at
195 V, giving 63 nm, 100 nm, and 500 nm pore intervals,
8-10
respec-
tively. To widen the applications of anodic porous alumina, the fab-
rication of ordered porous alumina with an arbitrary pore interval is
required.
Jessensky et al.
11
and Li et al.
12
suggested the correlation be-
tween the mechanical stress caused by volume expansion and self-
ordering of porous alumina. However, the mechanism has not been
fully confirmed. Therefore, we have investigated the self-ordering
behavior of anodic porous alumina formed in three major acid elec-
trolytes by focusing on the current density during oxide growth and
the effect of the ratio of pore diameter to cell diameter. The ratio is
controlled by the electric field strength at the barrier layer of porous
alumina during anodizing, as reported previously by Ono and
coworkers.
13-16
Namely, the ratios of cell diameter d
cell
to pore di-
ameter d
pore
obtained at different voltages in different electrolytes
have a linear relationship with log of current density. According to
the classical theory of ionic conduction at the high field strength for
the anodic barrier film grown on various metals,
17,18
the film thick-
ness of each metal is inversely proportional to the logarithm of ionic
current when the film is formed up to the same voltage. Thus, it is
indicated that the log of current density log i is proportional to the
electric field strength E, i.e., the formation voltage/film thickness
ratio at the barrier layer.
19
The purpose of the present study is the
confirmation of the controlling factor of the self-ordering of porous
alumina and the fabrication of a new self-ordering film by applying
the proposed mechanism.
Experimental
High-purity ͑99.99%͒ aluminum sheets were electropolished in a
4:1 mixture of ethanol and 60% perchloric acid at 10°C. Anodizing
was performed at constant voltages in 0.3 mol dm
Ϫ3
sulfuric acid
solution at 20°C, 0.3 mol dm
Ϫ3
oxalic acid solution at 20°C, and 0.2
mol dm
Ϫ3
phosphoric acid solution at 0°C-5°C. 2 mol dm
Ϫ3
citric
acid solution at 20°C was used to fabricate a new self-ordering film
with a large pore interval. The pHs of the electrolytes used were 0.1
for sulfuric acid, 1.2 for oxalic acid, and 2.3 for phosphoric acid.
To estimate the porosity of anodic alumina, voltage-time (V-t)
curves were measured during re-anodizing of the porous alumina
specimens at 5 A m
Ϫ2
in a neutral mixed solution of 0.5 mol dm
Ϫ3
boric acid and 0.05 mol dm
Ϫ3
sodium tetraborate at 20°C, as shown
schematically in Fig. 1. This measurement is based on the fact that
the anodic barrier film growth proceeds both at the oxide/metal in-
terface by the inward migration of O
2Ϫ
and the oxide/electrolyte
interface by the outward migration of Al
3ϩ
. Porosity ␣ in the porous
layer is calculated using the following equation with transport num-
bers of Al
3ϩ
(TAl
3ϩ
) and O
2Ϫ
(TO
2Ϫ
), which are confirmed to be
0.4 and 0.6, respectively
20,21
␣ ϭ
͑
TAl
3ϩ
͒
/
͑
1 Ϫ TO
2Ϫ
͒
͓1͔
where
 ϭ m
2
/m
1
͓2͔
m
1
is the slope of the V-t curve during re-anodizing of the aluminum
specimen having porous alumina layer, and m
2
is the slope of the V-t
curve during the growth of barrier film by anodizing of an aluminum
substrate.
This method for porosity measurement is well established
20,21
and called as a ‘‘Pore-filling’’ technique. Under the condition of the
present set of work, m
2
was measured to be 0.2 ͑V/s͒.
22
The relation
between porosity ␣, cell diameter d
cell
, and pore diameter d
pore
can
be given as
␣ ϭ
͑
d
pore
/d
cell
͒
2
namely, d
pore
/d
cell
ϭ
ͱ
␣͓3͔
The cell arrangement was evaluated by a field-emission scanning
electron microscopy ͑FE-SEM͒ observation of the oxide/substrate
interface after removing the anodic film by immersion in a boiling
mixed solution of 6% phosphoric acid and 2% chromic acid for 10
min in which the selective dissolution of the oxide ensued. This is
the most simple and accurate method for the evaluation of the cell
homogeneity. The level of self-ordering can be assessed by the frac-
tion of regular hexagonal cells, which neighboring to six cells indi-
vidually. When self-ordering progresses, the size of the domain con-
sist of only regular hexagonal cells increases.
Results and Discussion
Current-time transients at constant voltage.—Figure 2 shows
current-time ͑I-t͒ transients during constant-voltage anodizing in
sulfuric acid solution as a typical case. This type of stable I-t curve
is usually obtained when the stable porous film growth proceeds.
With increasing formation voltage, current density increased. When
the formation voltage exceeded the value of self-ordering voltage,
i.e., at 27 V, a high current accompanying intense gas evolution at
*
Electrochemical Society Active Member.
z
E-mail:
Journal of The Electrochemical Society, 151 ͑8͒ B473-B478 ͑2004͒
0013-4651/2004/151͑8͒/B473/6/$7.00 © The Electrochemical Society, Inc.
B473
Downloaded 13 Dec 2010 to 115.145.195.177. Redistribution subject to ECS license or copyright; see />the entire surface was observed. In these cases, no film growth at the
entire specimen surface proceeded. In the case of oxalic acid solu-
tion, similar phenomenon of a high current was appeared at 45 V. As
revealed by the intense gas evolution, electronic current caused by
the electric breakdown at the barrier layer is preferential than the
ionic current. While, in the case of phosphoric acid solution, local
film thickening was observed at 200 V accompanying high current
concentration.
If local film thickening is observed as a result of such an ex-
tremely high current, it is commonly called ‘‘burning’’ because
black spots of the thickened film often appear in some organic acid
electrolytes.
23
In the present cases, ‘‘white burning’’ spots appeared
in phosphoric acid solution, while preferential gas evolution at the
entire specimen surface rather than film growth was observed in
sulfuric acid and oxalic acid electrolytes. The reason for the differ-
ence in appearing reaction of either local film thickening or gas
evolution at the entire surface is unclear although the phenomena of
the extreme high current and termination of uniform film growth are
similarly observed when the formation voltage exceeds a certain
critical voltage.
Voltage-current relationship.—Figure 3 shows the changes in
steady-state current density ͑upper͒ and the porosity of anodic films
͑lower͒ with formation voltage. Anodizing was performed at a con-
stant voltage for 1 h except for cases of phosphoric acid formed at
voltages lower than 90 V. In the latter cases, anodizing was per-
formed for2htoestablish sufficient pore development because
current reached to a steady state value after more than 1 h. It is
caused by the low dissolving ability of the electrolyte at low tem-
perature. Current density increased exponentially for three types of
electrolytes when the voltage increased to a value close to the indi-
vidual self-ordering voltage, i.e., sulfuric acid at 25 V, oxalic acid at
40 V and phosphoric acid at 195 V. The self-ordering voltage is
strongly dependent on the pH of each electrolyte, namely, the oxide
dissolution ability. At a voltage higher than the individually speci-
fied self-ordering voltage, an extremely high current was observed
in the three electrolytes. Thus, it is apparent that self-ordering occurs
at a voltage just under the critical voltage which induces extremely
high current and prevents uniform film growth.
Change in the porosity of anodic alumina with increasing
formation voltage.—The high field theory suggests that log of cur-
rent density has a linear relationship with electric field strength. We
reported previously
16
that the theory was applicable to the porous
film growth and confirmed the linear relationship between log of
current density and the ratio of pore diameter d
pore
to cell diameter
d
cell
. This suggests that the d
pore
/d
cell
ratio is controlled by the
electric field strength E at the barrier layer and the ratio decreased
Figure 1. Schematic representation of ‘‘Pore filling’’ in a neutral solution.
Dotted area corresponds to the oxide layer formed during re-anodizing show-
ing the slope of m
1
.m
1
: The slope of the V-t curve during re-anodizing of
an anodized aluminum specimen having porous alumina layer, which is de-
pendent on the pore volume, i.e., porosity. m
2
: The slope of the V-t curve
during the growth of barrier film by anodizing of an aluminum substrate.
Figure 2. Current-time curves of anodizing in 0.3 mol dm
Ϫ3
sulfuric acid at
20°C in the voltage range from 5 V to 27 V.
Figure 3. Changes in steady-state current density ͑upper͒ and porosity
͑lower͒ of anodic films with formation voltage measured at three electro-
lytes. Anodizing was carried out at constant voltage.
Journal of The Electrochemical Society, 151 ͑8͒ B473-B478 ͑2004͒B474
Downloaded 13 Dec 2010 to 115.145.195.177. Redistribution subject to ECS license or copyright; see />with increasing E. Therefore, it is assumed that self-ordering pro-
ceeds in the film with a low d
pore
/d
cell
ratio formed under a high
electric field.
As shown in the lower part of Fig. 3, the porosity of each anodic
film lowered markedly and converged to ϳ0.1 regardless of the
electrolyte type, which corresponded to a d
pore
/d
cell
ratio of ϳ0.3,
when the voltage approached the individual self-ordering voltage
accompanying the exponential current increase.
For comparison of the three types of electrolyte, the formation
voltage was normalized to the self-ordering voltage. As shown in
Fig. 4, porosity was plotted against the ratio of formation voltage V
f
to the self-ordering voltage V
s
. The three lines corresponding to the
three different electrolytes decreased almost in the same manner
regardless of the electrolyte type and the formation voltage. The
minimum porosity of the films obtained just under the critical volt-
age of extremely high current appears to be 0.1. This indicates an
important fact that self-ordering can be attained when the d
pore
/d
cell
ratio approached 0.3 with the increase in electric field strength re-
gardless of the electrolyte type and the formation voltage itself.
Thus, the mechanism of self-ordering is assumed to be closely re-
lated to the high electric field strength at the barrier layer during
anodic film growth, rather than to the individual self-ordering volt-
age itself.
Nielsch et al.
24
suggested recently that three types of self-
ordered porous alumina all gave a porosity value of 0.1. They ex-
plained that the porosity value of ϳ0.1, which was produced as a
balance of formation and dissolution of anodic oxide, was morpho-
logically most stable from the viewpoint of mechanical stress. They
also claimed that 0.1 was a transitional and optimum porosity value
for self-ordering. However, according to the present results, the po-
rosity value of 0.1 for porous alumina was the optimum and also the
minimum value.
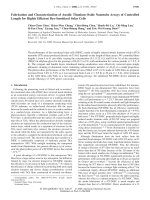
FE-SEM observation of self-ordering behavior.—When anodiz-
ing voltage was three-fourths of the established self-ordering volt-
age, i.e., 30 V in oxalic acid, the size of cells was not uniform, as
clearly shown in Fig. 5a. This implies that the irregular film growth
proceeds under the low current density, i.e., low electric field. The
homogeneity of cell size could be attained and domains of self-
ordered cell arrays in the same direction appeared when anodizing
voltage increased to 40 V, but just under the critical voltage of
extremely high current ͑Fig. 5b͒. To verify the effects of formation
voltage and film thickness on the self-ordering, anodic film was
formed at 30 V for a corresponding time to consume the equivalent
electricity for that consumed at 40 V for 1 h, namely, 1 h and 40
min. As shown in Fig. 5c, the cell homogeneity of anodic film
formed at 30 V for prolonged time was somewhat improved, but it
was apparently inferior to that associated with 40 V even though the
film thickness was similar. Thus, the necessity of high current den-
sity during anodizing for self-ordering of cell arrangement besides
film thickness was clarified. The size of the domain continuously
increased with increasing anodizing time up to6hasshown in Fig.
5d, suggesting the necessity of long-term electrolysis to organize the
cell arrangement and to form the consequential thick porous layer.
A similar self-ordering behavior was also observed in the films
formed in sulfuric acid solution. The homogeneity of cell size was
insufficient for the film formed at 20 V and an ordered domain
structure could be obtained when anodizing voltage increased to the
established self-ordering voltage, i.e., 25 V, as shown in Fig. 6.
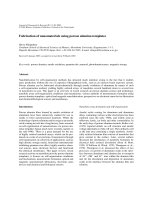
Although the self-ordering voltage in phosphoric acid solution
was as high as 195 V, the behavior was almost the same as those of
the other two electrolytes, as shown in Fig. 7. That is, the homoge-
neity of cell arrangement was not sufficient in the film formed at 150
V but the homogeneity was improved at 195 V. Figure 7b indicates
a tilting SEM image of the aluminum surface obtained after remov-
ing the anodic oxide formed for 1 h. Aluminum pillars formed at
irregular cell junctions, namely, junctions of four to six cells, were
clearly observed, while no such pillars were found at triple cell
junctions where self-ordered cell arrays were formed. It is apparent
Figure 4. Porosity plotted as a function of the ratio of formation voltage V
f
to self-ordering voltage V
s
.
Figure 5. SEM images of the metal/oxide interface after removal of porous
alumina formed in 0.3 mol dm
Ϫ3
oxalic acid at 20°C showing the depen-
dence of cell arrangement on formation voltage and anodizing time. ͑a͒ 30 V
for1h,͑b͒ 40 V 2% for 1 h, ͑c͒ 30 V for 1 h and 40 min, and ͑d͒ 40Vfor
6h.
Figure 6. SEM images of the metal/oxide interface after removal of porous
alumina formed in 0.3 mol dm
Ϫ3
sulfuric acid at 20°C. ͑a͒ 20Vfor1h,͑b͒
25 V for 1 h, and ͑c͒ 25 V for 6 h.
Journal of The Electrochemical Society, 151 ͑8͒ B473-B478 ͑2004͒ B475
Downloaded 13 Dec 2010 to 115.145.195.177. Redistribution subject to ECS license or copyright; see />that these pillars are only formed at the boundaries of domains in
which regular hexagonal cells were arranged in the same direction.
In the case of phosphoric acid electrolyte, it was not easy to
continue electrolysis for a long time without burning, namely, local
current concentration. The addition of Al
3ϩ
ions, vigorous agitation
of electrolyte and repeated experiments were required to perform
electrolysis for more than1hat195Vwithout burning. Moreover,
the homogeneity of cell arrangement is rather inferior to those of
other electrolytes. The reason seems to be high anodizing voltage
such as 195 V compared to 25 and 40 V. The high voltage tends to
induce local events such as electric breakdown, local thickening of
the barrier layer and pore branching because of the weak acidity.
These local events prevent growth of domains of homogeneous cell
arrangement.
Self-ordering of anodic porous alumina formed during burn-
ing.—Although anodizing could be carried out at the established
self-ordering voltage, burning occurred frequently in the case of
phosphoric acid as mentioned above. Thus, the behavior of porous
film growth during burning was also studied to clarify anodizing that
proceeded under an extremely high current density.
A comparison between the current-time curve measured during
burning and that during stable anodizing at 195 V in phosphoric acid
solution is shown in Fig. 8. With a rapid current increase, local
thickening of the film was detected. Figure 9 shows SEM images of
the surface ͑upper part: A in Fig. 9a͒ and horizontal fracture section
͑lower part: B in Fig. 9a, as well as Fig. 9b͒ of the thickened film
formed during burning. The latter fracture section was formed due to
splitting of the outer part of the film as a result of cracking induced
by a strong mechanical stress accompanied by the extremely high
current concentration and the resultant rapid film growth. The pore
arrangement at the film surface, which was formed at the initial
anodizing period, is not uniform, however, the horizontal fracture
section shows domains of highly self-ordered pore arrays although
the film is quite thin. The d
pore
/d
cell
ratio of this part was 0.28, i.e.,
ϳ0.3 as shown in Fig. 10b.
Clearly, film thickness is an important factor because the highly
ordered porous structure is only obtained after prolonged anodizing,
as previous studies have indicated. However, as shown in Fig. 10a,
the self-ordering proceeded instantaneously when current was con-
centrated during the burning. Therefore, it can be said that a high
electric field strength is the more significant factor in self-ordering
than the thickening of the anodic alumina itself.
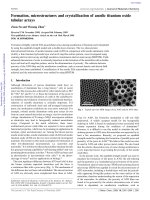
Figure 10a shows an SEM image of a burnt area indicating the
protrusion of thickened anodic film with a large number of cracks.
The protrusion is divided into three regions: ͑A͒ center, ͑B͒ inter-
mediate, and ͑C͒ outer regions. The substrate surface images of the
corresponding regions after the removal of the anodic films are also
shown in Fig. 10b-d. Apparently, the regularity of the cell arrange-
ment is higher at the center region than that at the outer region.
Because the current density seems to be higher at the center, the
regularity of cell arrangement could be further improved. Thus, it is
suggested again that the condition of high current density, i.e., high
electric field, is the most important factor that determines the self-
ordering of the pore arrangement. In addition, the cell size is smaller
when the regularity of the cell arrangement is higher. Because the
voltage dropped to 160 V instantaneously, followed by a rapid cur-
rent increase with burning, the average cell size ratio is 1.7 nm/V at
the center region, 2.1 nm/V at the intermediate region and 2.36
nm/V at the outer region if the final voltage affects the size of whole
cells. Compared to the ratio of cell size to applied voltage of 2.5
͑nm/V͒ observed for the standard anodic porous films,
14,26
the ratios
obtained here are all lower. Therefore, it can be said that the cell size
is affected by the electric field strength E and decreases with in-
creasing E under the condition of the same voltage. This finding is
similar to that observed for the barrier layer thickness.
19
As de-
scribed details in a separate paper,
25
the size of the cells at the exact
center spot of the protruded area made by burning, where the high
current density was most concentrated, was extremely small. Thus,
the size of self-ordered cells observed at the burning protrusion var-
ies to a large extent. This implies the importance of current density
on the self-ordering of porous alumina regardless of the specific
Figure 7. SEM images of the metal/oxide interfaces after removal of porous
alumina formed in 0.2 mol dm
Ϫ3
phosphoric acid at 0-5°C. ͑a͒ 150 V for 1 h,
͑b͒ 195 V for 1 h, and ͑c͒ 195 V for 16 h.
Figure 8. Comparison between current-time curve measured at burning and
that at stable anodizing at 195 V in 0.2 mol dm
Ϫ3
phosphoric acid at 0-5°C.
Figure 9. SEM images of the surface ͑upper part: A in 10a͒ and the hori-
zontal fracture section ͑lower part: B in a, as well as b͒ of the ruptured
porous film formed during burning in 0.2 mol dm
Ϫ3
phosphoric acid at 195
V at 0-5°C.
Journal of The Electrochemical Society, 151 ͑8͒ B473-B478 ͑2004͒B476
Downloaded 13 Dec 2010 to 115.145.195.177. Redistribution subject to ECS license or copyright; see />self-ordering voltage itself. The highly self-ordered cells produced
by burning were also found at the film formed in malonic acid.
25
To confirm the relationship between current density and electric
field strength, cross sections of the barrier layer of the film were
examined. In this experiment, the electric power was switched off
before the voltage drop to maintain the formation voltage of 195 V.
As shown in Fig. 11, the thickness of the barrier layer near the
center of the burned spot was 150 nm giving the smaller anodizing
ratio such as 0.76, while that of outer region was 216 nm giving the
standard anodizing ratio of 1.1. It was clearly observed that the
barrier layer thickness decreased with increasing distance from the
center of burnt spot.
As revealed in the present results, even burning could produce a
highly ordered porous structure. Thus, it is verified that the condi-
tion of high current density, i.e., the high electric field strength E at
the barrier layer is a strong controlling factor of the self-ordering of
cell arrangement.
Newly developed self-ordered porous alumina with 600 nm pore
interval.—Based on the understanding of high electric field as the
self-ordering condition, a new self-ordering porous alumina with a
pore interval of 600 nm formed in 2 mol dm
Ϫ3
citric acid solution at
240 V was developed. When a constant anodizing voltage was ap-
plied in the range from 225 to 245 V, current density increased
gradually with increasing voltage, as shown in Fig. 12. The film
formed just under the burning voltage of 245 V, namely 240 V,
showed self-ordered cell arrays, as shown in the SEM images of the
substrate surface and the film cross section in Fig. 13. Although
anodizing time was 1 h, and the film was as thin as 7 m, domains
of self-ordered cell arrays were found. Thus, the present assumption
in that the high electric field strength induces self-ordering can be
verified. Therefore, it can be concluded that self-ordering of arbi-
trary pore intervals by using adequate electrolytes and conditions is
achievable for maintaining a high current condition, i.e., high elec-
tric field on the entire specimen area, while avoiding extremely high
current leading to burning or electric breakdown. All other factors
such as aluminum ions, concentration of electrolyte and temperature
would be explicable by that they lead to keep high current density
anodizing without occurring local events such as burning which in-
terrupt the uniform film growth.
Conclusions
Self-ordering of the pore arrangement of anodic alumina was
observed at the maximum voltage for inducing high current anodiz-
ing while avoiding burning or electric breakdown. Such a maximum
voltage was identical with the previously established self-ordering
voltage.
Figure 10. ͑a͒ SEM image of a burnt protrusion of thickened anodic film
with a large number of cracks. The protrusion is divided into three regions:
͑A͒ center, ͑B͒ intermediate, and ͑C͒ the outer. ͑b,c,d͒ SEM images of the
respective substrate surfaces of the three regions corresponding to A, B, and
Cin͑a͒ after the removal of anodic films.
Figure 11. SEM images of the fracture sections of the barrier layer of po-
rous anodic film formed during burning in phosphoric acid at 195 V ob-
served at ͑a͒ the center region A and ͑b͒ the outer region C of the burnt spot.
Figure 12. Current-time curves measured at anodizing in 2 mol dm
Ϫ3
citric
acid at 20°C in the voltage range from 225 to 245 V.
Journal of The Electrochemical Society, 151 ͑8͒ B473-B478 ͑2004͒ B477
Downloaded 13 Dec 2010 to 115.145.195.177. Redistribution subject to ECS license or copyright; see />Concurrently, the ratio of pore diameter to cell diameter con-
verged to 0.3, which corresponded to a porosity value of 0.1 regard-
less of the electrolyte type when the formation voltage approached
the individual self-ordering voltage, independent of the formation
voltage itself.
Self-ordering of the pore arrangement of anodic alumina was
found even during burning indicating also a d
pore
/d
cell
ratio of 0.3.
This self-ordering at burning was considered to occur under the high
local current concentration and the resultant high electric field
strength in the specific area.
Based on the above results, a new self-ordering anodic porous
alumina with 600 nm pore interval was successfully fabricated in
citric acid.
Therefore, it can be concluded that the self-ordering of the arbi-
trary pore interval is achievable by choosing adequate electrolyte
and electrolytic condition at the appropriate formation voltage for
maintaining a high current condition, i.e., high electric field on the
entire specimen area, while avoiding extremely high current leading
to burning or electric breakdown.
Acknowledgments
Parts of this work were financially supported by the Promotion
and Mutual Aids Corporation for Private Schools of Japan and the
Light Metal Education Foundation of Japan.
Kogakuin University assisted in meeting the publication costs of this
article.
References
1. S. Shingubara, O. Okino, Y. Sayama, H. Sakaue, and T. Takahagi, Solid-State
Electron., 43, 1143 ͑1999͒.
2. T. Iwasaki, T. Motci, and T. Den, Appl. Phys. Lett., 75, 2044 ͑1999͒.
3. Y. Kanamori, K. Hane, H. Sai, and H. Yugami, Appl. Phys. Lett., 78, 142 ͑2001͒.
4. X. Mei, D. Kim, H. E. Ruda, and Q. X. Guo, Appl. Phys. Lett., 81, 361 ͑2002͒.
5. H. Asoh, M. Matsuo, M. Yoshihama, and S. Ono, Appl. Phys. Lett., 83, 4408
͑2003͒.
6. H. Masuda, H. Yamada, M. Satoh, H. Asoh, M. Nakao, and T. Tamamura, Appl.
Phys. Lett., 71, 2770 ͑1997͒.
7. H. Asoh, S. Ono, T. Hirose, M. Nakao, and H. Masuda, Electrochim. Acta, 48, 3171
͑2003͒.
8. H. Masuda and K. Fukuda, Science, 268, 1466 ͑1995͒.
9. H. Masuda, F. Hasegawa, and S. Ono, J. Electrochem. Soc., 144, L127 ͑1997͒.
10. H. Masuda, K. Yada, and A. Osaka, Jpn. J. Appl. Phys., 37, L1340 ͑1998͒.
11. O. Jessensky, F. Mu
¨
ller, and U. Go
¨
sele, Appl. Phys. Lett., 72, 1173 ͑1998͒.
12. A. P. Li, F. Mu
¨
ller, A. Birner, K. Nielsch, and U. Go
¨
sele, J. Appl. Phys., 84, 6023
͑1998͒.
13. S. Ono, N. Baba, and N. Masuko, Kinzoku Hyomen Gijutsu, 42, 133 ͑1991͒.
14. S. Ono and N. Masuko, Corros. Sci., 33, 503 ͑1992͒.
15. S. Ono, T. Osaka, and N. Masuko, Denki Kagaku oyobi Kogyo Butsuri Kagaku, 64,
1005 ͑1996͒.
16. S. Ono, K. Takeda, and N. Masuko, in Proceedings of the Second International
Symposium on Al Surface Science Technology, H. Terryn, Editor, p. 398, University
of Manchester, Manchester ͑2000͒.
17. N. Cabrera and N. F. Mott, Ret. Pror. Phys., 12, 163 ͑1948͒.
18. C. J. Dell’Oca and L. Young, J. Electrochem. Soc., 117, 1548 ͑1970͒.
19. S. Ono, F. Mizutani, M. Ue, and N. Masuko, in Corrosion and Corrosion Protec-
tion, J. D. Sinclair, R. P. Frankenthal, and E. Ka
´
lma
´
n, Editors, PV 2001-22, p. 1129,
The Electrochemical Society Proceedings Series, Pennington, NJ ͑2001͒.
20. A. Dekker and A. Middelhoek, J. Electrochem. Soc., 117, 440 ͑1970͒.
21. H. Takahashi and M. Nagayama, Corros. Sci., 18,911͑1978͒.
22. S. Ono and K. Takeda, in Passivity of Metals and Semi-Conductors,M.B.Ives,J.
L. Luo, and J. R. Rodda, Editors, PV 99-42, p. 930, The Electrochemical Society
Proceedings Series, Pennington, NJ ͑1999͒.
23. S. Hoshino, T. Imamura, S. Matsumoto, and K. Kojima, Kinzoku Hyomen Gijutsu,
28, 167 ͑1977͒.
24. K. Nielsch, J. Choi, K. Schwim, R. B. Wehrspohn, and U. Go
¨
sele, Nano Lett., 2,
677 ͑2002͒.
25. S. Ono, M. Saito, and H. Asoh, Electrochem. Solid-State Lett., 7, B21 ͑2004͒.
26. S. Ono and N. Masuko, Surf. Coat. Technol., 169-170, 139 ͑2003͒.
Figure 13. SEM images of ͑a͒ substrate surface and ͑b͒ film cross section
formed in 2 mol dm
Ϫ3
citric acid at 240 V for 1 h showing self-ordered cell
arrays.
Journal of The Electrochemical Society, 151 ͑8͒ B473-B478 ͑2004͒B478
Downloaded 13 Dec 2010 to 115.145.195.177. Redistribution subject to ECS license or copyright; see />