- Trang chủ >>
- Khoa Học Tự Nhiên >>
- Vật lý
facile synthesis of porous a - fe2o3 nanorods and their application in ethanol sensors
Bạn đang xem bản rút gọn của tài liệu. Xem và tải ngay bản đầy đủ của tài liệu tại đây (434.2 KB, 5 trang )
Facile Synthesis of Porous r-Fe
2
O
3
Nanorods and Their Application in Ethanol Sensors
Yan Wang, Jianliang Cao, Shurong Wang, Xianzhi Guo, Jun Zhang, Huijuan Xia,
Shoumin Zhang, and Shihua Wu*
College of Chemistry, Nankai UniVersity, Tianjin 300071, P.R. China
ReceiVed: June 2, 2008; ReVised Manuscript ReceiVed: September 12, 2008
A facile solution approach was employed to synthesize R-FeOOH nanorods by using FeSO
4
· 7H
2
O and
CH
3
COONa without templates at low temperature (40 °C). The porous R-Fe
2
O
3
nanorods were successfully
obtained by calcining the R-FeOOH precursors at 300 °C for 2 h. The as-prepared products were characterized
by thermogravimetry-differential thermal analysis, X-ray powder diffraction, transmission electron microscopy
(TEM), high-resolution TEM, and N
2
adsorption-desorption analysis techniques. The as-prepared porous
R-Fe
2
O
3
nanorods have a tiny crystal size (5 nm) and a pore size distribution of 1-10 nm, resulting in a high
specific surface area of 221.9 m
2
· g
-1
. A possible growth mechanism of the porous R-Fe
2
O
3
nanorods was
proposed. The gas-sensing measurement results demonstrated that the porous R-Fe
2
O
3
nanorods presented a
much higher response than the R-Fe
2
O
3
nanoparticles and showed excellent selectivity and stability to ethanol
vapor. Due to the fact that it has exciting gas-sensing properties and can be obtained easily, the as-prepared
porous R-Fe
2
O
3
nanorod would be an ideal candidate for application in ethanol sensors.
1. Introduction
In recent years, the fabrication of nanostructure materials with
a desired size, morphology, and porosity has received steadily
growing interest owing to their special electrical, optical,
magnetic, and physicochemical properties that are superior to
those bulk materials.
1-4
Currently, one-dimensional (1-D)
nanostructures, such as nanorods, nanowires, nanobelts, and
nanotubes, have become the focus of intensive research not only
for their peculiar properties but also for many potential
applications in catalysis, electronics, photonics, drug delivery,
medical diagnostics, sensors, and magnetic materials.
5-8
Hematite (R-Fe
2
O
3
) is the most stable iron oxide with n-type
semiconducting properties (E
g
) 2.2 eV) under ambient
conditions. It has been intensively investigated because of its
wide applications in catalysts, pigments, magnetic materials, gas
sensors, and lithium ion batteries.
9-15
For its excellent properties,
much attention has been directed to the controlled synthesis of
one-dimensional (1-D) R-Fe
2
O
3
, such as nanospindles,
16,17
nanofibers,
18,19
nanorods,
20,21
nanowires,
22,23
nanobelts,
24
and
nanotubes
25,26
by a variety of techniques and methods. Wang
et al. prepared R-Fe
2
O
3
nanobelts and nanowires via a gas-solid
reaction process under 700 and 800 °C.
20
Mann et al. synthesized
R-Fe
2
O
3
nanotubes by using biomacromolecules as templates.
27
Yi-Xie et al. and Bo-Tong et al. prepared R-Fe
2
O
3
nanorods
through a hydrothermal process at 120 and 100 °C, respec-
tively.
28,29
The preparation of R-Fe
2
O
3
nanotubes with alumina
membranes as the substrates was also employed by many
researchers.
30-33
However, the gas-solid reaction usually
requires special equipment and high temperatures, the methods
employing templates or substrates often suffer from disadvan-
tages related to the high cost and the removal of impurities,
and the hydrothermal process usually needs tedious reaction
times. It is still a challenge to develop simple, low-cost, and
environmentally friendly approaches for the synthesis of 1-D
structural R-Fe
2
O
3
.
Recently, the concern over environmental protection and
increasing demands to monitor hazardous gases in industry and
the home has attracted considerable attention to developing gas
sensors for various polluting and toxic gases. Due to its low
cost, good stability, and reversibility, R-Fe
2
O
3
has been proved
to be an important semiconductor gas sensor. The gas sensors
based on R-Fe
2
O
3
nanoparticles have been widely investigated
by many researchers in the past decades.
11,12
However, so far,
there are only a few reports on the gas-sensing properties of
1-D nanostructural R-Fe
2
O
3
. Generally, the properties of a gas
sensor are strongly dependent on its surface area. The relatively
low ratio of surface to volume of the conventional bulk R-Fe
2
O
3
materials leads to their poor gas-sensing properties. Hence,
developing the 1-D nanostructure R-Fe
2
O
3
with high surface
area is very important for increasing their applications on gas
sensors.
Herein, we report a facile route for the preparation of porous
R-Fe
2
O
3
nanorods without any templates via a low-temperature
(40 °C) solution approach. First, the precursor of R-FeOOH
nanorods was prepared by using FeSO
4
· 7H
2
O as the iron source
material in the presence of CH
3
COONa in an aqueous solution.
The CH
3
COONa was used as a source of hydroxide ions during
the hydrolysis of iron salts to form iron oxyhydroxide (FeOOH).
Then the porous R-Fe
2
O
3
nanorods were obtained by the
calcination of as-prepared R-FeOOH at 300 °Cfor2h.The
as-obtained porous R-Fe
2
O
3
nanorods have a tiny crystal size
(5 nm) and a high surface area (221.9 m
2
· g
-1
). The gas-sensing
properties of the sensor based on the porous R-Fe
2
O
3
nanorods
to ethanol were systematically investigated. Meanwhile, the gas-
sensing properties of the porous R-Fe
2
O
3
nanorods were com-
pared with those of R-Fe
2
O
3
nanoparticles.
2. Experimental Section. All chemicals were of reagent
grade and used without further purification.
In a typical synthesis procedure of the R-FeOOH nanorods,
2.78 g of FeSO
4
· 7H
2
O and 3.28 g of CH
3
COONa were
dissolved in 50 mL of deionized water under magnetic stirring.
After stirring vigorously for a period at 40 °C, a yellow slurry
was formed. The products were collected and washed with
* Corresponding author. Phone: +86 22 2350 5896. Fax: +86 22 2350
2458. E-mail:
J. Phys. Chem. C 2008, 112, 17804–1780817804
10.1021/jp806430f CCC: $40.75 2008 American Chemical Society
Published on Web 10/23/2008
distilled water several times by vacuum extraction filtering with
two sheets of medium speed qualitative filter paper (pore
diameter 30-50 µm) and then dried at 40 °C under vacuum
for 2 h. The porous R-Fe
2
O
3
nanorods were obtained by
calcining the as-prepared R-FeOOH nanorods precursor at 300
°Cfor2hinair. The color of the samples changed from yellow
to red. The whole preparation process for the porous R-Fe
2
O
3
nanorods can be finished in no more than 6 h. The short
production process would be helpful for the large-scale industrial
manufacture of porous R-Fe
2
O
3
nanorods.
Thermogravimetry-differential thermal analysis (TG-DTA) of
the as-prepared R-FeOOH precursor was conducted on a ZRY-
2P thermal analyzer. Ten milligrams of an R-FeOOH sample
was heated from room temperature to 600 °C in air at a heating
rate of 10 °C min
-1
. X-ray diffraction (XRD) analysis was
performed on a D/MAX-RAX diffractometer with Cu KR
radiation (λ ) 0.154 18 nm) operating at 40 kV and 100 mA.
Diffraction peaks of crystalline phases were compared with those
of standard compounds reported in the JCPDS data file.
Transmission electron microscopy (TEM) and high-resolution
transmission electron microscopy (HRTEM) analysis were
carried out on a Philips-T20ST electron microscope operating
at 200 kV. N
2
adsorption-desorption isotherms were collected
at liquid nitrogen temperature using a Quantachrome Nova
2000e sorption analyzer. The pore diameter and the pore size
distributions were determined by the Barret-Joyner-Halenda
(BJH) method. The specific surface areas (S
BET
) of the samples
were calculated following the multipoint Brunauer-Emmett-
Teller (BET) procedure.
The gas-sensing performance was systematically investigated
by a HW-30A gas-sensing measurement system (Henan Hanwei
Electronical Technology Co., Ltd.). The fabrication and testing
principle of the gas sensor are similar to that described in our
previous reports.
34,35
The porous R-Fe
2
O
3
nanorod samples were
mixed with terpineol to form a paste and then coated onto the
outside surface of an alumina tube 4 m m in length. The thickness
of the coated sensing layer is around 50 µm. A small Ni-Cr
alloy coil was placed through the tube to supply the operating
temperatures from 100 to 500 °C. Electrical contacts were made
with two platinum wires attached to each gold electrode. To
improve their stability and repeatability, the gas sensors were
sintered at 300 °C for 10 days in air. Here, the sensing properties
of the gas sensors were measured under a steady-state condition
in a chamber with a volume of 15 L at a working temperature
of 250 °C and 40% relative humidity (RH). An appropriate
amount of ethanol vapor was injected into the closed chamber
by a microinjector, and the sensor was exposed to air again by
opening the chamber when the test was completed.
3. Results and Discussion
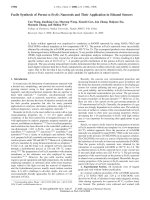
TG-DTA measurement was performed to study the conver-
sion process of the as-prepared R-FeOOH during calcination
in air, and the result is shown in Figure 1. From the TG curve
of Figure 1, it can be seen that the total weight loss is about
12%, which is a little larger than the theoretical value (10.1%),
indicating that about 2% adsorbed water is present in the as-
prepared R-FeOOH. The abrupt weight loss (about 10.5%) that
occurred at the temperature range of 250-300 °C is attributed
to the decomposition of R-FeOOH precursors. Correspondingly,
there are an endothermic peak and an exothermic peak on the
DTA curve which may be ascribed to the removal of the
structural water molecules and the crystallization process of
R-Fe
2
O
3
, respectively. Above 300 °C, the weight of the pre-
cursor no longer changes, which indicates that the stable residue
can reasonably be ascribed to the pure R-Fe
2
O
3
phase. This result
can also be confirmed by the following XRD analysis results.
As expected, porous R-Fe
2
O
3
nanorods have been prepared by
the calcination of the as-prepared R-FeOOH precursors at 300
°C in air.
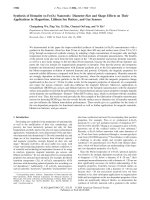
Figure 2 shows the XRD patterns of the samples. The
deflection peaks of the as-prepared precursor (Figure 2a) can
be perfectly assigned to the standard value of the R-FeOOH
phase (JCPDS No. 29-0713). When the R-FeOOH precursor
were calcined in air at 300 °C for 2 h, all the deflection peaks
of the product (Figure 2b) were in agreement with the standard
data of R-Fe
2
O
3
(JCPDS No. 33-0664). No characteristic peaks
are observed for impurities such as γ-Fe
2
O
3
and Fe
3
O
4
,
indicating that the R-FeOOH precursor was completely trans-
formed into hematite at 300 °C, which is also consistent with
the results of TG-DTA.
Figure 1. TG-DTA curves of as-prepared FeOOH nanorods.
Figure 2. XRD patterns of (a) R-FeOOH and (b) R-Fe
2
O
3
nanorods.
Porous R-Fe
2
O
3
Nanorods J. Phys. Chem. C, Vol. 112, No. 46, 2008 17805
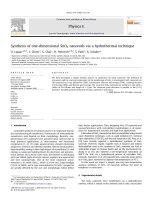
The morphologies of the as-prepared R-FeOOH and R-Fe
2
O
3
nanorods were further investigated by TEM and HRTEM. Figure
3a and b shows the representative TEM and HRTEM micro-
graphs of the as-prepared R-FeOOH sample, respectively. The
images clearly demonstrate that the sample has a smooth, rodlike
morphology with average diameter of about 10-15 nm and a
length of about 200 nm. After being calcined at 300 °Cfor2h,
the sample still maintains the rodlike 1-D morphology, as is
shown in Figure 3c and d. Compared with the smooth surface
of the as-prepared R-FeOOH nanorods, it is interestingly found
that the calcined sample possesses a pore structure. These pores
are 1-10 nm in size, open to the outer surface, and almost
isolated from each other. The formation of the pores may be
due to the removal of H
2
O from the as-prepared R-FeOOH
nanorods during the calcination process. Some shorter rods were
also found in Figure 3c, which may be the rudiments of the
nanorods or the broken ones destroyed by high temperature.
Figure 3e presents the corresponding electron diffraction pattern
of 300 °C calcined products (R-Fe
2
O
3
nanorods); the shape
diffraction ring indicates the product is highly crystallized. The
HRTEM image of a typical R-Fe
2
O
3
nanorod (Figure 3f) shows
regular lattice fringes with a spacing of 0.37 nm, which
corresponds to the (012) plane of R-Fe
2
O
3
.
To investigate the formation processes of the R-FeOOH
nanorods and the porous R-Fe
2
O
3
nanorods, time-dependent
experiments were carried out, and the resultant products were
investigated by TEM (see Figure S1 in the Supporting Informa-
tion). At a shorter reaction time of only 5 min, there are almost
no nanorods formed, and the average diameter of the nanopar-
ticles is about 5 nm. As the reaction time increased to 10 min,
part of the nanoparticles began to combine with each other, and
the rodlike structure appeared. Upon prolonging the reaction
time to 30 min, the products were totally transformed to rodlike
nanostructures. If the reaction time was further increased to 2 h,
as seen in Figure 3, well-structured nanorods were obtained,
and the length of the nanorods increased with the increase in
the reaction time. On the basis of the above results, a growth
mechanism of the porous R-Fe
2
O
3
nanorods can be proposed.
The schematic diagram of the process is described in Figure 4.
In the first stage, the R-FeOOH crystal nucleus formed by the
reaction of Fe
2+
with O
2
and OH
-
produced by the hydrolysis
of CH
3
COO
-
. Then these R-FeOOH particles further assembled
into rodlike structures by combining together with OH groups.
Finally, the porous R-Fe
2
O
3
nanorods formed with the removal
of H
2
O after being calcined at 300 °C in air. The equations of
the reactions in the synthetic process are as follows:
CH
3
COO
-
+H
2
O f CH
3
COOH + OH
-
(1)
4Fe
2+
+8OH
-
+O
2
f 4FeOOH + 2H
2
O (2)
2FeOOH f Fe
2
O
3
+H
2
O (3)
The porosity of the porous R-Fe
2
O
3
nanorods was further
confirmed by nitrogen adsorption-desorption analysis, and the
results are shown in Figure 5. The isotherm indicates that the
R-Fe
2
O
3
nanorods have a porosity of type IV with a distinct
hysteresis loop in the range of 0.5-1.0 P/P
0
.
36
The curve of
pore size distribution of the porous R-Fe
2
O
3
nanorods is shown
in the inset figure. The curve exhibits that the sample has
relatively small pores with a size distribution of 1-10 nm and
centered at 2 nm. This is in good agreement with the TEM
images. Calculated by multipoint the BET method, the porous
R-Fe
2
O
3
nanorods have a high surface area of 221.9 m
2
· g
-1
,
whereas, the surface area of the R-Fe
2
O
3
nanoparticles is only
18.31 m
2
· g
-1
, which is reported in our previous work.
37
The
high surface area of the porous R-Fe
2
O
3
nanorods may be
attributed to their tiny crystal size and porosity structure.
Prompted by the high specific surface area, we forecast that
the sensor based on the as-prepared porous R-Fe
2
O
3
nanorods
should have enhanced gas sensitivity.
As an n-type semiconductor, one of the most important
applications of R-Fe
2
O
3
material is in gas sensors. It has been
reported by many researchers that an R-Fe
2
O
3
sensor exhibits
an excellent gas-sensing property to some combustible or toxic
gases.
38-42
It is generally accepted that the sensing mechanism
of the R-Fe
2
O
3
-based sensor belongs to the surface-controlled
type. The gas-sensing properties of an R-Fe
2
O
3
-based sensor
are coherent with its surface area. The higher the surface area
the sensor has, the more test gas and oxygen molecules it
adsorbs, and the better sensitivity it exhibits. Therefore, the
design of sensing materials with a high specific surface area
should be useful for enhanced gas-sensing performance. In
addition, it has been demonstrated that a decrease in the size of
Figure 3. (a, b) TEM and HRTEM images of R-FeOOH nanorods.
(c, d) TEM and HRTEM images of porous R-Fe
2
O
3
nanorods. (e) The
corresponding ED pattern and (f) HRTEM image of a single R-Fe
2
O
3
nanorod.
Figure 4. Schematic diagram of the formation mechanism of the
porous R-Fe
2
O
3
nanorods.
Figure 5. N
2
adsorption-desorption isotherm and BJH pore-size
distribution plot (inset) of porous R-Fe
2
O
3
nanorods.
17806 J. Phys. Chem. C, Vol. 112, No. 46, 2008 Wang et al.
the crystallites in the sensing layer can result in a considerable
increase in sensitivity.
43
Thus, the as-prepared porous R-Fe
2
O
3
nanorods, which possess a tiny particle size (5 nm) and a high
surface area (221.9 m
2
· g
-1
), are expected to have a good gas-
sensing performance.
Figure 6 illustrates the typical response-recovery character-
istics of the porous R-Fe
2
O
3
nanorods to ethanol vapor with
concentrations of 50, 100, 200, 500, and 1000 ppm. The sensing
properties of R-Fe
2
O
3
nanoparticles with an average particle
size of about 30 nm and a surface area of 18.31 m
2
/g, reported
in our previous work,
37
is also shown in Figure 6 for comparison
purposes. It can be seen from Figure 6 that the response of the
sensor based on the porous R-Fe
2
O
3
nanorods increases dramati
-
cally with the increase in the ethanol vapor concentration and
is much higher than that of the R-Fe
2
O
3
nanoparticles under
the same ethanol concentration. This result indicates that the
gas-sensing property of the as-prepared porous R-Fe
2
O
3
nano
-
rods is much better than that of the previously reported R-Fe
2
O
3
nanoparticles. A comparison study between the nanorods and
the nanoparticles in sensitivities to ethanol of different concen-
trations is shown in Table 1. From Table 1, we can see that the
sensitivities of the porous R-Fe
2
O
3
nanorods are almost several
decade times greater than that of R-Fe
2
O
3
nanoparticles for all
the ethanol vapor of different concentrations. The gas sensitivity
is defined as the resistance ratio R
air
/R
gas
, where R
air
and R
gas
are the electrical resistance for the sensor in air and in gas. When
the sensor is in air, the surface of R-Fe
2
O
3
is covered by plenty
of oxygen adsorbates, such as O
2-
,O
-
, and O
2
-
. The formation
of the oxygen adsorbate layer leads to a decrease in the electron
density on the sensor surface due to the transfer of electrons
from the sensor surface to the adsorbate layer. When the sensor
is exposed to ethanol vapor, the ethanol gas reacts with the
oxygen ions on the surface, which results in the release of free
electrons to the sensor. This leads to the change in resistance
of the R-Fe
2
O
3
sensor. The amount of oxygen and test gas on
the surface of materials is strongly dependent on the micro-
structure of the materials; namely, the specific area, particle size,
and the porosity. The main reason for the above result is that
the conventional R-Fe
2
O
3
nanoparticle sensor has a poor surface
area and a relatively large particle size, whereas the sensor based
on porous R-Fe
2
O
3
nanorods has a high surface area and tiny
crystal size, which can provide more adsorption-desorption sites
for gas molecules. Moreover, the abundant pores on the surface
of the R-Fe
2
O
3
nanorods can facilitate the diffusion of the gas
molecules and enable them to access all surfaces of the nano-
particles contained in the sensing unit.
As is known, response and recovery times, which are defined
as the time required to reach 90% of the final resistance, are
the basic parameters for gas sensors. It can also be seen from
Figure 6 that the porous R-Fe
2
O
3
nanorod sensor still shows a
short response/recovery time, even to high-concentration ethanol
vapor, indicating a good response/recovery capability for prac-
tical application.
For practical use, the selectivity of the sensor is a necessary
consideration. Hence, we also examined the gas-sensing of the
same sensor on the basis of the response of the porous R-Fe
2
O
3
nanorods to methanol, NH
3
,H
2
S, H
2
, and CO. The results are
shown in Figure 7. It can be seen clearly from Figure 7 that the
sensor exhibits the highest response to ethanol and very low
responses to other gases. In addition, the sensor was totally
insensitive to CO and H
2
. According to the experimental results,
the as-prepared porous R-Fe
2
O
3
nanorod sensor can selectively
detect ethanol gas with the interference of other gases.
The effect of humidity on the gas sensitivity of the sensor
has also been investigated. The sensitivity of the sensor to
ethanol at different relative humidities is shown in Figure S2
in the Supporting Information. The result reveals that it is no
problem for the sensor of porous R-Fe
2
O
3
nanorods to detect
ethanol under 60% relative humidity. Furthermore, the sensor
exhibited a nearly constant response to ethanol under the same
conditions, even after 6 months, illustrating the good reversibility
of the porous R-Fe
2
O
3
nanorod sensor.
4. Conclusions
In summary, we have presented a facile route for preparing
porous R-Fe
2
O
3
nanorods via a template-free solution approach
at low temperature (40 °C). This method is feasible for large-
scale industrial manufacture of porous hematite nanorods due
to the advantages of the simple production process, low cost,
and environmental friendliness. The as-prepared porous R-Fe
2
O
3
nanorods have a tiny crystal size (5 nm) and a porosity structure,
resulting in a high surface area of 221.9 m
2
· g
-1
. On the basis
of the experimental results, a possible growth mechanism of
the porous R-Fe
2
O
3
nanorods has been proposed. The gas-
sensing measurements demonstrated that the sensor based on
Figure 6. Responses of porous R-Fe
2
O
3
nanorods and R-Fe
2
O
3
nanoparticles to ethanol of different concentrations.
TABLE 1: Sensitivities of the Two Sensors to Ethanol of
Different Concentration
S to ethanol (ppm)
sample
S
BET
(m
2
/g)
50 100 200 500 1000
porous R-Fe
2
O
3
nanorods
221.9 43.6 60.7 82.8 127.3 174.9
R-Fe
2
O
3
nanoparticles
18.31 1.9 2.2 2.9 4.8 11.8
Figure 7. Sensitivities of porous R-Fe
2
O
3
nanorods to various gases
of 50-1000 ppm.
Porous R-Fe
2
O
3
Nanorods J. Phys. Chem. C, Vol. 112, No. 46, 2008 17807
porous R-Fe
2
O
3
nanorods exhibited a much higher sensitivity
to ethanol vapor than the sensor based on R-Fe
2
O
3
nanoparticles.
This is possibly due to the fact that the porous R-Fe
2
O
3
nanorods
have a high surface area and plentiful pores to adsorb and react
with gas molecules. Moreover, the sensor also presented ex-
cellent selectivity to ethanol and good stability for a rather long
time (6 months). Hence, it is expected that this facile route
prepared porous R-Fe
2
O
3
nanorods would be an ideal candidate
for applications in ethanol sensors. Other properties and app-
lications, such as catalysts and fuel cells, may also be found.
Acknowledgment. The authors thank the National Nature
Science Foundation of China (20871071), the 973 Program
(2005CB623607), and the Applied Basic Research Programs
of Science and Technology Commission Foundation of Tianjin
(08JCYBJC00100) for financial support.
Supporting Information Available: TEM images of the
products obtained at different reaction times and the sensitivities
of porous R-Fe
2
O
3
nanorods to ethanol at different relative
humidity. This material is available free of charge via the
Internet at .
References and Notes
(1) Poizot, P.; Laruelle, S.; Grugeon, S.; Dupont, L.; Tarascon, J. M.
Nature 2000, 407, 496.
(2) Kong, J.; Franklin, N. R.; Zhou, C. W.; Chapline, M. G.; Peng, S.;
Cho, K.; Dai, H. J. Science 2000, 287, 622.
(3) Hamley, I. W. Nanotechnology 2003, 14, 39.
(4) Wan, Y.; Shi, Y. F.; Zhao, D. Y. Chem. Comm. 2007, 897.
(5) Ding, Y.; Gao, P. X.; Wang, Z. L. J. Am. Chem. Soc. 2004, 126,
2066.
(6) Liu, J. F.; Wang, X.; Peng, Q.; Li, Y. D. AdV. Mater. 2005, 17,
764.
(7) Pan, Z. W.; Dai, Z. R.; Wang, Z. L. Science 2001, 291, 1947.
(8) Wang, X.; Li, Y. D. J. Am. Chem. Soc. 2002, 124, 2880.
(9) Zhang, Y. P.; Chu, Y.; Dong, L. H. Nanotechnology 2007, 18,
435608.
(10) Weiss, W.; Zsccherpel, D.; Schlogl, R. Catal. Lett. 1998, 52, 215.
(11) Fukazawa, M.; Matuzaki, H.; Hara, K. Sens. Actuators, B 1993,
13, 521.
(12) Neri, G.; Bonavita, A.; Galvagno, S.; Siciliano, P.; Capone, S. Sens.
Actuators, B 2001, 82, 40.
(13) Bondioli, F.; Ferrari, A. M.; Leonelli, C.; Manfredini, T. Mater.
Res. Bull. 1998, 33, 723.
(14) Mitra, S.; Das, S.; Mandal, K.; Chaudhuri, S. Nanotechnology 2007,
18, 275608.
(15) Feldmann, C. AdV. Mater. 2001, 13, 1301.
(16) Zeng, S. Y.; Tang, K. B.; Li, T. W.; Liang, Z. H.; Wang, D.; Wang,
Y. K; Zhou, W. W. J. Phys. Chem. C 2007, 111, 10217.
(17) Liu, X. M.; Fu, S. Y.; Xiao, H. M.; Huang, C. J. J. Solid State
Chem. 2005, 178, 2798.
(18) Yan, X. H.; Liu, G. J.; Liu, F. T.; Tang, B. Z.; Peng, H.; Pakhomov,
A. B.; Wang, C. Y. Angew. Chem., Int. Ed. 2001, 40, 3593.
(19) Zhu, Y.; Zhang, J. C.; Zhai, J.; Jiang, L. Thin Solid Films 2006,
510, 271.
(20) Jing, Z. H.; Wu, S. H. Mater. Lett. 2004, 58, 3637.
(21) Woo, K.; Lee, H. L.; Ahn, J. P.; Park, Y. S. AdV. Mater. 2003, 15,
1761.
(22) Chueh, Y. L.; Lai, M. W.; Liang, J. Q.; Chou, L. J.; Wang, Z. L.
AdV. Funct. Mater. 2006, 16, 2243.
(23) Fu, Y. Y.; Chen, J.; Zhang, H. Chem. Phys.Lett. 2001, 350, 459.
(24) Wang, H. Z.; Zhang, X. T.; Liu, B.; Zhan, H. L.; Li, Y. C.; Huang,
Y. B.; Du, Z. L. Chem. Lett. 2005, 34, 184.
(25) Wen, X. G.; Wang, S. H.; Ding, Y.; Wang, Z. L.; Yang, S. H. J.
Phys. Chem. B 2005, 109, 215.
(26) Liu, L.; Kou, H. Z.; Mo, W. L.; Lin, H. J.; Wang, Y. Q. J. Phys.
Chem. B 2006, 110, 15223.
(27) Archibald, D. D.; Mann, S. Nature 1993, 364, 430.
(28) Wu, C. Z.; Yin, P.; Zhu, X.; Ouyang, C. Z.; Xie, Y. J. Phys. Chem.
B 2006, 170, 17806.
(29) Tang, B.; Wang, G. L.; Zhuo, L. H.; Ge, J. C.; Cui, L. J. Inorg.
Chem. 2006, 45, 5196.
(30) Chen, J.; Xu, L. N.; Li, W. Y.; Gou, X. L. AdV. Mater. 2005, 17,
582.
(31) Sun, Z. Y.; Yuan, H. Q.; Liu, Z. M.; Han, B. X.; Zhang, X. R.
AdV. Mater. 2005, 17, 2993.
(32) Steinhart, M.; Wendorff, J. H.; Greiner, A.; Wehrspohn, R. B.
Science 2002, 296, 1997.
(33) Schuth, F. Angew. Chem., Int. Ed. 2003, 42, 3604.
(34) Wang, Y.; Wang, S. R.; Zhao, Y. Q.; Zhu, B. L.; Kong, F. H.;
Wang, D.; Wu, S. H.; Huang, W. P.; Zhang, S. M. Sens. Actuators, B 2007,
125, 79.
(35) Wang, Y.; Kong, F. H.; Zhu, B. L.; Wang, S. R.; Wu, S. H.; Huang,
W. P. Mater. Sci. Eng., B 2007, 140, 98.
(36) Brunauer, S.; Deming, L.; Deming, W.; Teller, E. J. Am. Chem.
Soc. 1940, 62, 1723.
(37) Wang, Y.; Wang, Y. M.; Cao, J. L.; Kong, F. H.; Xia, H. J.; Zhang,
J.; Zhu, B. L.; Wang, S. R.; Wu, S. H. Sens. Actuators, B 2008, 131, 183.
(38) Huo, L. H.; Li, Q.; Zhao, H.; Yu, L. J.; Gao, S.; Zhao, J. G. Sens.
Actuators, B 2005, 107, 915.
(39) Tan, O. K.; Cao, W.; Zhu, W.; Chai, J. W.; Pan, J. S. Sens.
Actuators, B 2003, 93, 396.
(40) Dai, G. R. Sens. Actuators, B 1998, 53,8.
(41) Malyshev, V. V.; Eryshkin, A. V.; Koltypin, E. A.; Varfolomeev,
E. A.; Vasiliev, A. A. Sens. Actuators, B 1994, 19, 434.
(42) Poghossian, A. S.; Abovian, H. V.; Aroutiounian, V. M. Sens.
Actuators, B 1994, 18, 155.
(43) Yamazoe, N. Sens. Actuators, B 1991, 5,7.
JP806430F
17808 J. Phys. Chem. C, Vol. 112, No. 46, 2008 Wang et al.