- Trang chủ >>
- Khoa Học Tự Nhiên >>
- Vật lý
nano - sized pdo loaded sno2 nanoparticles by reverse micelle method
Bạn đang xem bản rút gọn của tài liệu. Xem và tải ngay bản đầy đủ của tài liệu tại đây (1019.43 KB, 6 trang )
Sensors and Actuators B 136 (2009) 99–104
Contents lists available at ScienceDirect
Sensors and Actuators B: Chemical
journal homepage: www.elsevier.com/locate/snb
Nano-sized PdO loaded SnO
2
nanoparticles by reverse micelle method
for highly sensitive CO gas sensor
Masayoshi Yuasa
a,∗
, Takanori Masaki
b
, Tetsuya Kida
a
, Kengo Shimanoe
a
, Noboru Yamazoe
a
a
Department of Energy and Material Sciences, Faculty of Engineering Sciences, Kyushu University, 6-1 Kasuga-Koen, Kasuga, 816-8580 Fukuoka, Japan
b
Department of Molecular and Material Sciences, Interdisciplinary Graduate School of Engineering Sciences, Kyushu University, Kasuga, Fukuoka, Japan
article info
Article history:
Received 12 June 2008
Received in revised form 22 October 2008
Accepted 14 November 2008
Available online 30 November 2008
Keywords:
CO sensor
Nanoparticle
Reverse micelle method
abstract
A reverse micelle method was investigated for preparing nano-sized PdO loaded on SnO
2
nanoparticles.
PdO–SnO
2
nano-composite was prepared by precipitating Pd(OH)
2
and Sn(OH)
4
inside a reverse micelle.
The microstructure and thegas sensing properties of obtained nanoparticles were investigated. Although
the particle size of SnO
2
was as same as ca. 10 nm at each observed sample, the particle size of PdO
got larger as increasing with loading amount of PdO because of agglomeration of PdO nanoparticles
each other. As a result of the gas sensing measurement, it was found that the particle size of PdO on
SnO
2
nanoparticle influences the gas sensing property closely. That is, the sensor response declined
gradually with increasing the particle size of PdO although the maximum of the sensor response was
obtained in PdO =0.1 mol%. In this method, small amount of PdO loading can be achieved as compared
with PdO-loaded SnO
2
sensor prepared by the conventional impregnation method.
© 2008 Elsevier B.V. All rights reserved.
1. Introduction
For semiconductor gas sensors, tin oxide (SnO
2
) has been one of
the attractive materials because of its high sensitivity and chemical
stability. Duringthe past decades,the physicaland chemical proper-
ties of SnO
2
have been well studied with the aim of improving the
performance of SnO
2
-based gas sensors [1–6]. More importantly,
recent extensive studies have found three basic factors concerning
the sensing properties of semiconductor gas sensors. In particular,
the followings areproposed asthe mostinfluential factors: (1)grain
size of particles [7], (2) microstructure of the sensing body [8], and
(3) surface modification of particles (noble metal loading) [9–14].
For the grain size effect (first factor), Xu et al. have reported that
the sensor response increased drastically as thegrain size decreased
to less than 6 nm, which value is twice as large as the thickness of
depletion layers in SnO
2
[7]. On the basis of these findings, we pre-
pared almost mono-dispersed SnO
2
nanoparticles (mean diameter:
4 nm) suspended in an aqueous solution by hydrothermal treat-
ment of tin hydroxide gel, and succeeded in achieving a significant
increase in the sensor response to H
2
gas [15]. In addition, we con-
tinued to investigate the nature of the grain size effect and reported
that small crystals can be depleted of conduction electrons beyond
the scheme of convention depletion theories [16]. On the other
hand, for the second factor, it has been proved experimentally and
theoretically that the sensor performances such as sensitivity and
∗
Corresponding author. Tel.: +81 92 583 7539; fax: +81 92 583 7538.
E-mail address: (M. Yuasa).
response speed depend largely on the rates of diffusion of a tar-
get gas and its surface reaction (with oxygen adsorbed on SnO
2
)
[17–22]. This clearly demonstrates the importance of microstruc-
ture control of sensing layers, and indicates that sensing layers with
porous structures allow detection of larger sized gases by facilitat-
ing their diffusion deep inside the sensing layer. Indeed, we have
achieved a higher response to CO larger than H
2
by controlling the
microstructure of the sensing body [8]. For the surface modifica-
tion effect (third factor), it is now well accepted that loading of
small amounts of noble metals, such as Pd and Pt on the SnO
2
,
promotes gas response as well as the rate of response. In partic-
ular, Pd has frequently been loaded on commercial SnO
2
-based gas
sensors. In this case, the sensitization originated in electronic inter-
action between Pd (actually PdO) and SnO
2
, as follows. The loading
of PdO on SnO
2
increases the electric resistance often by about one
order of magnitude, because PdO acts as a strong acceptor of elec-
trons and remove electrons from the oxide. On the other hand, the
resistance, when PdO is reduced to Pd on contact with the reducing
gases, decreases by back electron transfer from Pd to SnO
2
. The dif-
ference in the electric resistance of SnO
2
induced by a change in the
oxidized and reduced states of Pd is often large, giving rise to a large
increase in response to the reducing gases. Matsushima et al. suc-
ceeded in loading fine PdO particles of 3–20 nm on SnO
2
particles
(mean diameter: 40nm) by several routes including impregnation,
colloid adsorption, and chemical fixation methods, and observed
more than ten times higher H
2
gas response by the loading [23,24].
Hence, according to the above three factors concerning the sen-
sor performance, it can be proposed that the loading of Pd onto
porous sensing layers composed of SnO
2
nanoparticles would offer
0925-4005/$ – see front matter © 2008 Elsevier B.V. All rights reserved.
doi:10.1016/j.snb.2008.11.022
100 M. Yuasa et al. / Sensors and Actuators B 136 (2009) 99–104
a way to further improve the sensor response. However, the loading
of fine Pd nanoparticles onto SnO
2
nanoparticles is not still chal-
lenged in contrast to the case where larger SnO
2
particles were
used as the matrices [23,24]. Thus, development of a new loading
method of PdO onto SnO
2
nanoparticles is required to selectively
bind PdO nanoparticles onto SnO
2
nanoparticles without coagu-
lation. In this study, we focused on a reverse micelle method as
a new route for loading PdO nanoparticles onto SnO
2
nanoparti-
cles. It is well known that when small amounts of aqueous solution
and surfactant are mixed together with organic solvent in a des-
ignated ratio, nano-sized water droplets called as reverse micelles
stabilized by the surfactant were formed in the organic solvent.
This method utilizes the reverse micelles (abbreviated as “RM”) as
nano-spaces for chemical reaction. Preparation of nano-sized par-
ticles by RM methods has been reported for various materials, e.g.
metals [25–27], metal oxides [28–32], sulfides [33], supported cat-
alysts [34–36] and nanocomposites [37]. Recently, we adopted a
RM method for preparing carbon-supported LaMnO
3
nanoparti-
cles as an electrocatalyst for an oxygen reduction electrode [38,39].
The promising feature of the RM methods is that nanoparticles
can be prepared in nano-sized water droplets as a reaction place.
Furthermore, other nanoparticles can be deposited subsequently
on the nanoparticles formed in nano-sized water droplets, would
result in homogeneous deposition of Pd nanoparticles onto SnO
2
nanoparticles. In this study, PdO-loaded SnO
2
nanoparticles were
prepared by precipitating Pd(OH)
2
on Sn(OH)
4
of nano-sized pre-
cursor with hydroxides inside RMs, followed by calcination. The
obtained nanocomposites (PdO-loaded SnO
2
) were used to form
thick film type sensor devices, and the relationship between thegas
sensing properties and nanostructure of PdO-loaded SnO
2
particles
are discussed.
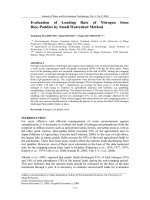
2. Experimental
2.1. Material preparation
The preparation procedure of PdO-loaded SnO
2
nanoparticles
by using RM method is schematically shown in Fig. 1. Three dif-
ferent RM solutions were prepared in this preparation process. The
molar ratio of water to surfactant was in the range of 3–12. The mix-
ing ratio of surfactant to organic solution was 4:6 in weight ratio
for all RM solutions. The amount of aqueous solutions used was
constant at 10 mL. At first, a RM solution containing [Sn(OH)
4
]
2−
(RM-A) was prepared by mixing cyclohexane (C
6
H
12
), non-ionic
surfactant (NP-6, polyoxyethylene (6) nonylphenyl ether), and an
aqueous solution containing [Sn(OH)
4
]
2−
(0.1 M). Mixing was per-
formed at 10
◦
C until the solution became colorless. The solution
containing [Sn(OH)
6
]
2−
was prepared by dissolving Sn(CH
3
COO)
4
in a tetramethylammonium hydroxide solution (10%). The pH of the
aqueous solution was around 13, and as such [Sn(OH)
6
]
2−
was likely
formed at this high pH. To precipitate precursor Sn(OH)
2
, the solu-
tion RM-A was mixed together with a RM solution containing an
aqueous HNO
3
solution (6%, pH 2) (RM-B). The mixing results in a
decrease in the pH of the aqueous phase by collision between dif-
ferent reverse micelles, precipitating Sn(OH)
4
nanoparticles inside
the reverse micelles collided. The final pH of the aqueous phase in
the mixed solution was around 9. Then, the mixed solution was fur-
ther mixed with the RM solution containing an aqueous Pd(NO
3
)
2
solution (0.1–5.0mM, pH 4)(RM-C) to precipitate Pd(OH)
2
particles
onto Sn(OH)
4
particles inside RMs. The loading amount of Pd was
controlled between 0.05 and 5.0 mol% by changing the concentra-
tion of Pd ions in the solution RM-C. By adding ethanol to break RMs
containing Pd(OH)
2
–Sn(OH)
4
, the resulting precipitates were col-
lected by centrifugation and they were washed with ethanol. After
drying at 120
◦
C, the obtained powder was calcined at 600
◦
Cfor3h
to form PdO–SnO
2
nanocomposites.
Fig. 1. Schematic diagram of the preparation method of PdO-loaded SnO
2
nanopar-
ticles by a reverse micelle method.
2.2. Material characterization
The diameter of RMs in solutions containingSn(OH)
4
or Pd(OH)
2
particles was measured bya dynamiclight scattering analyzer (DLS)
(ELS6000/8000, Otsuka electronics Co., Ltd.). The morphology of
the composites was observed by TEM (JEM-2000EX, JEOL Co., Ltd.,
Japan). Qualitative and quantitative analyses of PdO in the obtained
samples were performed by a wavelength dispersion-type X-ray
fluorescence spectrometer with LiF analyzing crystals and Pd K␣ X-
ray source (ZSX-mini, Denki Co. Ltd., Japan). The crystalline size of
the samples was calculated by Scherrer’s formula from their XRD
patterns measured by an X-ray diffractmeter with nickel-filtered
Cu K␣ (1.5418Å) source (RINT2100, Rigaku Denki Co., Ltd., Japan).
2.3. Sensor fabrication and measurement
Sensor devices werefabricated by ascreen-printing method. The
obtained PdO (0.05–5 mol%)–SnO
2
powders were mixed mechani-
cally with diethanolamine asa binderto formpasts forprinting. The
PdO–SnO
2
powders were pasted on alumina substrates attached
with a pair of comb-type Au electrodes (at a space of 90 m
between the electrodes) through patterned-screens to fabricate
sensor devices. Then, the devices were heat-treated at 600
◦
Cfor
3 h in air to burn the organic binder. The sensor device thus fabri-
cated was settled in a quartz tube and heated by an electric furnace
for sensing property measurements. The sensor device was con-
nected with a standard resistor in series, and the voltage across
M. Yuasa et al. / Sensors and Actuators B 136 (2009) 99–104 101
the standard resistor was measured under an applied voltage of dc
4 V to evaluate the electrical resistance of the device. The electri-
cal signal of the sensor devices was acquired with an electrometer.
The electric resistances of the devices in air and in air containing
target gas (200 ppm CO) were measured at 300
◦
C which was the
most suitable operation temperature. As a target gas, we choose CO
which don’t generate a by-product in order to evaluate only loading
effect. Sensor response (S =R
air
/R
gas
) was defined as the ratio of the
electric resistance in air (R
air
)tointargetgas(R
gas
).
3. Results and discussion
3.1. Characterization of PdO–SnO
2
nanocomposites
For reverse micelle formation, the molar ratio of water to surfac-
tant called as R
w
value (R
w
=[H
2
O]/[surfactant]) is a critical factor;
the size of water droplets substantially depends on this value.
The stability of reverse micelles is also affected by the R
w
value.
Hence, to prepare precursor hydroxide particles with desired sizes,
the effects of the R
w
on the diameter of reverse micelles were
first examined. Fig. 2 shows the dependences of the mean diame-
ters of reverse micelles containing precursor Pd(OH)
2
and Sn(OH)
4
nanoparticles. The reverse micelles containing Pd(OH)
2
were pre-
pared by mixing the solution RM-C with a reverse micelle solution
containing a tetramethylammonium hydroxide solution (10%) as
the precipitating agent. The diameters of the two different reverse
micelles increased monotonically with increasing their R
w
values.
This tendency can be explained as follows: for reverse micelles to
form, the head of the hydrophilic group of surfactant molecules
(here, –(CH
2
CH
2
O)–) has to adsorb on the surface of nano-sized
water droplets in an organic solvent [40,41]. When the amount of
surfactant molecules is decreased, the small water droplets seem to
cohere for reducing theinterfacefree energy between water droplet
and organic solvent. Accordingly, the diameter of the water droplets
inside reverse micelles tends to increase with increasing the R
w
value. For the revere micelles containing Sn(OH)
4
, they were sta-
ble when the R
w
value was 6–12. In this case, the diameter of the
reverse micelles was in the range of 4–13 nm. On the other hand,
for Pd(OH)
2
, stable reverse micelle solutions were obtained when
the R
w
value is around 3–9. This difference is likely due to the
difference in the pH of the aqueous phase in the two RMs. Con-
sidering the size and the stability of reverse micelles, the R
w
value
of 9 was selected as appropriate for the preparation of precursor
Sn(OH)
4
–Pd(OH)
2
composites. Fig. 3 shows the particle size dis-
tribution of reverse micelles (R
w
= 9) in the RM solution containing
Pd(OH)
2
(1.0 mol%)–Sn(OH)
4
. Thesize distribution was very narrow
Fig. 2. Dependence of the diameter of reverse micelles containing Pd(OH)
2
(open
circle) or Sn(OH)
4
particles (closed circle) on the molar ratio of water to surfactant.
Fig. 3. Theparticle size distribution of reversemicellescontainingPd(OH)
2
–Sn(OH)
4
(1.0 mol%).
and no agglomeration was observed. The above results suggest that
Pd(OH)
2
–Sn(OH)
4
nanocomposites of 7–12 nm in diameter was
successfully obtained in nanosized water droplets inside reverse
micelles.
The PdO-loaded SnO
2
nanoparticles obtained by calcination
of the above composite powder were characterized. Fig. 4 shows
the XRD pattern of PdO (1.0 mol%)–SnO
2
calcined at 600
◦
C. In
the pattern, only peaks ascribable to SnO
2
(tetragonal structure,
a =b =4.7382 Å, c = 3.1871 Å, JCPDS 41-1445) were seen, suggest-
ing the successful conversion of precursor Sn(OH)
4
to SnO
2
.No
peaks of PdO were observed because of its small loading amount
(1.0 mol%). The crystalline size of SnO
2
calculated with Scherer’s
formula using the XRD peaks was 13.5 nm. This is in nearly good
agreement of the size of the precursor composite as shown in Fig. 2.
The results suggest that no significant crystal growth occurred in
the composite. The qualitative and quantitative analyses of PdO in
the composite were performed by X-ray fluorescence (XRF) analy-
sis. Fig. 5 shows a representative XRF spectrum (Pd K␣) of the PdO
(1 mol%)–SnO
2
nanocomposite, indicating the presence of Pd in the
sample. The ratio of Pd to Sn was also determined by the calibration
curve obtained with reference samples. For the 1.0 mol% Pd-loaded
sample, it was confirmed that the determined loading amount was
within 1.0% deviation from the nominal amount. Thus, it is sug-
gested that Sn and Pd ions were almost completely precipitated
from the precursor solutions in the present method, although the
small amount of Pd below 1 mol% loading could not be precisely
quantified because of difficulty in separating noise from signal of
XRF.
Fig. 4. XRD pattern of PdO (1.0mol%)-loaded SnO
2
nanoparticles prepared by the
reverse micelle method.
102 M. Yuasa et al. / Sensors and Actuators B 136 (2009) 99–104
Fig. 5. Representative XRF spectrum (Pd K␣) of PdO (1.0mol%)-loaded SnO
2
nanoparticles.
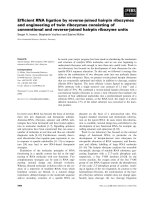
The morphology and the particle size of SnO
2
and PdO were
observed by TEM. Fig. 6 shows TEM and high-resolution (HR)-TEM
images of PdO–SnO
2
nanocomposites with different PdO loading
amounts. The obtained TEM images show that the particle size of
SnO
2
in all samples was as same as ca 10 nm, in good agreement
with the XRDresults.Thus, the observed particles are judged to be of
single crystalline without significant sintering even after high tem-
perature calcination. This suggests the effectiveness of the present
method for preparing thermally stable SnO
2
nanoparticles. On the
other hand, the particle size of PdO was different, depending on its
loading amount. To differentiate between SnO
2
and PdO particles,
lattice images were taken by HR-TEM. For 0.5mol% PdO loading, the
particle sizeof PdOwas observed to be lessthan 5nm. Withincreas-
ing the loading amount, PdO particles tended to be agglomerated
each other and grew up larger. For smaller 0.1 mol% PdO loading,
no PdO particles with clear lattice images were observed. However,
this issupposed to be owing to smallerparticle sizeof PdO,probably
Fig. 7. The dependence of the electric resistance in air at 300
◦
C on the loading
amount of PdO for the devices prepared by the reverse micelle (closed circle) and
impregnation methods (closed square).
less than 1 or 2 nm. In addition, from the results of electric resis-
tance in air, as shown later, it is understood that smaller particles
of PdO are loaded on nano-sized SnO
2
. This is in marked contrast to
the reported case where PdO particles with a wider size distribu-
tion (3–20 nm) by an impregnation method were loaded on larger
SnO
2
particles (ca. 50–100 nm) [42].
3.2. Gas sensing properties of PdO–SnO
2
nanocomposite films
Fig. 7 shows the dependence of the electric resistance of sensor
films in air at 300
◦
C on the loading amount of PdO. For compar-
ison, the electric resistances of the sensor films prepared by the
conventional impregnation method [42] were also shown in this
figure.
In the conventional impregnation method, stannic acid precipi-
tated from an aqueous solutionof SnCl
4
with ammoniasolution was
Fig. 6. TEM and HR-TEM images of PdO (1.0 mol%)-loaded SnO
2
nanoparticles: (a) 0.5 mol%, (b) 1.5 mol%, and (c) 5.0 mol% PdO loading.
M. Yuasa et al. / Sensors and Actuators B 136 (2009) 99–104 103
Fig. 8. The dependence of the sensor response to 200 ppm CO at 300
◦
C on the
loading amount of PdO for the devices prepared by the reverse micelle method.
calcined at 900
◦
C for 5 h to obtain the SnO
2
powder. Then, PdCl
2
solution was impregnated to the above SnO
2
powder, and then the
solution evaporated to dryness and reduced in a flow of H
2
gas for
3 h. The particle size of SnO
2
and Pd in the conventional method
was 50–100 nm and 3–10 nm, respectively. The electric resistance
of SnO
2
nanoparticles increased with loading PdO, and reached the
maximum at 0.1 mol% loading. The increase at 0.1 mol% was more
than one order of magnitude. The increase observed in the elec-
tric resistance is similar to the trend reported in the literature [42],
and can be interpreted in terms of the electric interaction between
PdO and SnO
2
, for which PdO attracts electrons from SnO
2
and pro-
duces electron depleted layers on the SnO
2
surface. The obtained
results thus confirm that PdO nanoparticles were effectively loaded
on SnO
2
nanoparticles as observed in TEM images. On the other
hand, loading more than 0.1mol% decreased the resistance. The
further loading of PdO may lead to the agglomeration of PdO par-
ticles and impede the formation of effective contacts between PdO
and SnO
2
. Note that the observed dependence of the resistance on
amount of PdO loading is somewhat different from the reported
dependences for samples prepared through impregnation, colloid
adsorption, and chemical fixation methods [42]. This means that
the electrical resistance depends on preparation methods, namely,
the dispersion state of PdO over the SnO
2
surface. In addition, for
the reverse micelle method, the loading amount at the maximum
resistance was 15 times lower than those for the above methods.
It is considered that finer dispersion of PdO was attained by the
present method, reducing the optimum PdO loading amount for
maximizing the depletion effects.
Fig. 8 shows the dependence of the sensor response to 200 ppm
CO at 300
◦
C on amount of PdO loading. The maximum sensor
response was obtained at 0.1 mol% PdO loading, reaching a high
value of S =320. On the other hand, the sensor response was
decreased with further increasing the loading amount. Such a trend
is ingood accordance with the dependence ofthe electricresistance
as shown above. This good consistency between the resistance
and the sensor response indicates that the electrical interaction
between PdO and SnO
2
is dominant for the improvement of the
sensor response rather than the catalytic effect of PdO that assists
the combustion of CO with adsorbed oxygen.
As revealed in this study, the developed method can improve
the sensor response even by a smaller loading amount of PdO, as
compared with the other reported methods. The reduction of the
loading amount is the favorable feature of the present method.
Note that the size of PdO was decreased by reducing the loading
amount, as deduced by the TEM observations. Moreover, based on
the obtained results, it can be suggested that the sensor response is
associated with the number of contacts between PdO andSnO
2
par-
ticles. Itis speculated that the number ofthe contacts was increased
bythe sizereductionof PdO.To examine thepossibilityof thiseffect,
the number of PdO loaded on SnO
2
was roughly estimated using
the representative sizes of PdO observed in the HR-TEM images.
The number of PdO particles per mass (N) for each sample can be
calculated using the following equation under the assumption that
their sizes are constant for each sample:
N =
the total volume of PdO per mass
the volume of a PdO particle
(1)
For the estimation of N, the total volume of PdO per mass in the
0.5 mol%-loaded sample is abbreviated as V. Likewise, those val-
ues for 1.5 and 5.0 mol%-loaded samples are expressed as 3V and
10V, respectively. The representative particle sizes of PdO in the 0.5,
1.5 and 5.0 mol% PdO-loaded samples was approximately 4,6 and
10 nm, respectively. Thus, when the particle diameter for 0.5 mol%
is abbreviated as D, then thosefor 1.5and 5.0 mol% can be expressed
as 1.5D and 2.5D, respectively. By using these values for Eq. (1),
the number of PdO particles for each sample can be calculated as
follows:
0.5mol%:N =
V
(4/3)(D/2)
3
= 6 ×
V
D
3
(2)
1.5mol%:N =
3V
(4/3)(1.5D/2)
3
= 3.96
V
D
3
(3)
5.0mol%:N =
10V
(4/3)(2.5D/2)
3
= 2.88
V
D
3
(4)
The above simple calculation results indicate that the number of
PdO particlestends to increase with decreasing theloading amount.
Such an increase in the number of PdO particles is readily expected
to cause an increase in the density of contacts between PdO and
SnO
2
particles, provided that the size of SnO
2
is constant. Conse-
quently, the surface depletion effect, induced by the formation of
PdO–SnO
2
junctions, is enhanced. This significantly increases the
electric resistance as well as the sensor response even by the quite
low PdO loading.
4. Conclusions
PdO-loaded SnO
2
nanoparticles were prepared by the reverse
micelle method. Stable and mono-disperse reverse micelles of ca.
10 nm containing both Pd(OH)
2
and Sn(OH)
4
were obtained at
R
w
= 9. The calcination of the collected hydroxide composites at
600
◦
C produced PdO-loaded SnO
2
nanoparticles; the particle size
of SnO
2
was ca. 10 nm irrespective of the PdO loading amount.
Nano-sized PdO particles of ca. 4nm were prepared at 0.5 mol%
loading. However, with increasing the PdO loading amount, PdO
particles agglomerated each other and grew up larger. It was found
that both of the electric resistance and the sensor response of
PdO-loaded SnO
2
were dependent onthe loading amount.The max-
imum electric resistance and sensor response were obtained at
0.1 mol% PdO loading. The optimum amount of PdO for maximiz-
ing the sensor response was fairly smaller for the reverse micelle
method, as compared with those for conventional methods. This is
suggested to be owing to that the number of PdO particles in con-
tact with SnO
2
increased by reducing the size of the PdO particles
with the developed preparation method. The obtained results con-
firmed that the electrical resistance as well as the sensor response
is significantly dependent on dispersion states of PdO particles on
SnO
2
.
104 M. Yuasa et al. / Sensors and Actuators B 136 (2009) 99–104
Acknowledgement
This work has been financially supported by a Grant-in-Aid for
Scientific Research (B) (No. 18350075) from the Ministry of Educa-
tion, Science, Sports and Culture of Japan.
References
[1] N. Yamazoe, J. Fuchigami, M. Kishikawa, T. Seiyama, Interaction of tin oxide
surface with O
2
,H
2
O and H
2
, Surf. Sci. 86 (1979) 335–344.
[2] J. Tamaki, M. Nagaishi, Y. Teraoka, N. Miura, N. Yamazoe, Adsorption behavior
of CO and interfering gases on SnO
2
, Surf. Sci. 221 (1989) 183–196.
[3] V.Lantto, P.Romppainen, S. Leppavuori, A study of the temperaturedependence
of the barrier energy in porous tin dioxide, Sens. Actuators 14 (1988) 149–163.
[4] S. Roy Morrison, Selectivity in semiconductor gas sensors, Sens. Actuators 12
(1987) 425–440.
[5] K.D. Schierbaum, U. Weimar, W. Gopel, R. Kowalkowski, Conductance, work
function and catalytic activity of SnO
2
-based gas sensors, Sens. Actuators B:
Chem. 3 (1991) 205–214.
[6] N. Barsan, M. Schweizer-Berberich, W. Göpel, Fundamental and practical
aspects in the design of nanoscaled SnO
2
gas sensors: a status report, Fresenius
J. Anal. Chem. 365 (1999) 287–304.
[7] C. Xu, J. Tamaki, N. Miura, N. Yamazoe, Grain size effects on gas sensitivity of
porous SnO
2
-based elements, Sens. Actuators B: Chem. 3 (1991) 147–155.
[8] K. Yoshida, K. Shimanoe, N. Yamazoe, Preparation of SnO
2
cluster by hydrother-
mal treatment for highly sensitive thin film sensor, in: Proceedings of the
Technical Digest of the 6th East Asian Conference on Chemical Sensor, 2005,
pp. 515–516.
[9] N. Yamazoe, Y. Kurokawa, T. Seiyama, Effects of additives on semiconductor gas
sensors, Sens. Actuators 4 (1983) 283–289.
[10] S. Matsushima, T. Maekawa, J. Tamaki, N. Miura, N. Yamazoe, Role of additives
on alcohol sensing by semiconductor gas sensor, Chem. Lett. (1989) 845–848.
[11] T. Maekawa, J. Tamaki, N. Miura, N. Yamazoe, Sensing behavior of CuO-loaded
SnO
2
element for H
2
S detection, Chem. Lett. (1991) 575–578.
[12] J.G. Duh, J.W. Jou, Catalytic and gas sensing characteristics in Pd-doped SnO
2
,J.
Electrochem. Soc. 136 (1989) 2740–2747.
[13] J. Kappler, N. Bârsan, U. Weimar, A. Dièguez, J.L. Alay, A. Romano-Rodriguez, J.R.
Morante, W. Göpel, Correlation between XPS, Raman and TEM measurements
and the gas sensitivity of Pt and Pd doped SnO
2
based gas sensors, Fresenius J.
Anal. Chem. 361 (1998) 110–114.
[14] K.H. Cha, H.C. Park, K.H. Kim, Effect of palladium doping and film thickness on
the H
2
gas sensing characteristics of SnO
2
, Sens. Actuators B: Chem. 21 (1994)
91–96.
[15] N.S. Baik, G. Sakai, N. Miura, N. Yamazoe, Hydrothermally treated sol solution
of tin oxide for thin-film gas sensor, Sens. Actuators B: Chem. 63 (2000) 74–79.
[16] N.Yamazoe, K. Shimanoe, Rolesofshapeandsizeofcomponentcrystals in semi-
conductor gas sensors. I. Response to oxygen, J. Electrochem. Soc. 155 (2008)
J85–J92.
[17] N.S. Baik, G. Sakai, K. Shimanoe, N. Miura, N. Yamazoe, Hydrothermal treat-
ment of tinoxide solsolution for preparation of thin-filmsensor with enhanced
thermal stability and gas sensitivity, Sens. Actuators B: Chem. 65 (2000) 97–
100.
[18] G.Sakai, N.S. Baik, N. Miura, N. Yamazoe, Gas sensing properties oftin oxidethin
films fabricated from hydrothermally treated nanoparticles dependence of CO
and H
2
response on thickness, Sens. Actuators B: Chem. 77 (2001) 116–121.
[19] V.V. Kissinea, S.A. Voroshilovb, V.V. Sysoeva, A comparative study of SnO
2
and
SnO
2
:Cu thin flms for gas sensor applications, Thin Solid Films 348 (1999)
304–311.
[20] G. Sakai, N. Matsunaga, K. Shimanoe, N. Yamazoe, Theory of gas-diffusion con-
trolled sensitivity for thin film semiconductor gas sensor, Sens. Actuators B:
Chem. 80 (2001) 125–131.
[21] N. Matsunaga, G. Sakai, K. Shimanoe, N. Yamazoe, Formulation of gas dif-
fusion dynamics for thin film semiconductor gas sensor based on simple
reaction–diffusion equation, Sens. Actuators B: Chem. 96 (2003) 226–233.
[22] D.D. Vuong, G. Sakai, K. Shimanoe, N. Yamazoe, Preparation of grain size-
controlled tin oxide sols by hydrothermal treatment for thin film sensor
application, Sens. Actuators B: Chem. 103 (2004) 386–391.
[23] S.Matsushima, Y.Teraoka,N. Miura,N.Yamazoe, Electronic interactionbetween
metal additives and tin dioxide in tin dioxide-based gas sensors, Jpn. J. Appl.
Phys. 27 (1988) 1798.
[24] S. Matsushima, J. Tamaki, N. Miura, N. Yamazoe, TEM observation of the disper-
sion state of Pd on SnO
2
, Chem. Lett. (1989) 1651.
[25] P. Bartnickel, A. Wokaun, W. Sager, H F. Eicke, Size tailoring of silver colloids
by reduction in W/O microemulsions, J. Colloid Interf. Sci. 148 (1992) 80.
[26] I. Lisiecki, M.P. Pileni, Synthesis of copper metallic clusters using reverse
micelles as microreactors, J. Am. Chem. Soc. 115 (1993) 3887–3896.
[27] J. Solla-Gullon, V. Montiel, A. Aldaz, J. Clavilier, Electrochemical characterisa-
tion of platinum nanoparticles prepared by microemulsion: how to clean them
without loss of crystalline surface structure, J. Electroanal. Chem. 491 (2000)
69–77.
[28] V. Chhabra, V. Pillai, B.K. Mishra, A. Morrone, D.O. Shah, Synthesis, character-
ization, and properties of microemulsion-mediated nanophase TiO
2
particles,
Langmuir 11 (1995) 3307–3311.
[29] K. Osseo-Asare, F.J. Arriagada, Preparation of SiO
2
nanoparticles in a non-ionic
reverse micellar system, Colloids Surf. 50 (1990) 321–339.
[30] W. Que, S. Buddhudu, Y. Zhou, Y.L. Lam, J. Zhou, Y.C. Chan, C.H. Kam, L.H. Gan, G.
Roshan Deen, Preparation and characterization of erbium oxalate and erbium
oxide nanoparticles by microemulsion technique, Mater. Sci. Eng. C 16 (2001)
51–54.
[31] K.C. Song, J.H. Kim, Preparation of nanosize tin oxide particles from water-in-oil
microemulsions, J. Colloid Interf. Sci. 212 (1999) 193–196.
[32] D. Chen, L. Gao, Novel synthesis of well-dispersed crystalline SnO
2
nanopar-
ticles by water-in-oil microemulsion-assisted hydrothermal process, J. Colloid
Interf. Sci. 279 (2004) 137–142.
[33] P.S. Khiew, S. Radiman, N.M. Huang, Md. Soot Ahmad, Studies on the growth
and characterization of CdS and PbS nanoparticles using sugar–ester nonionic
water-in-oil microemulsion, J. Cryst. Growth 254 (2003) 235–243.
[34] A. Towata, Y. Uwamino, M. Sando, K. Iseda, H. Taoda, Synthesis of titania pho-
tocatalysts dispersed with nickel nanosized particles, Nanostruct. Mater. 10
(1998) 1033–1042.
[35] T.Masui, K. Fujiwara, Y. Peng, K. Machida, G. Adachi, Carbon monoxide oxidation
characteristics over the Al
2
O
3
-supported CeO
2
–ZrO
2
catalysts prepared by the
microemulsion method, Chem. Lett. (1997) 1285.
[36] T. Miyao, N. Toyoizumi, S. Okuda, Y. Imai, K. Tajima, S. Naito, Preparation of
Pt/SiO
2
ultra-fine particles in reversed micelles and their catalytic activity,
Chem. Lett. (1999) 1125.
[37] T. Kida, G. Guan, Y. Minami, T. Ma, A. Yoshida, Photocatalytic hydrogen produc-
tion from water over a LaMnO
3
/CdS nanocomposite prepared by the reverse
micelle method, J. Mater. Chem. 13 (2003) 1186–1191.
[38] M. Yuasa, G. Sakai, K. Shimanoe, Y. Teraoka, N. Yamazoe, Reverse micelle-based
preparation of carbon-supported La
1−x
Sr
x
Mn
1−y
Fe
y
O
3+d
for oxygen reduction
electrode, J. Electrochem. Soc. 151 (2004) A1690–A1695.
[39] M.Yuasa,K.Shimanoe,Y.Teraoka, N.Yamazoe, Preparationofcarbon-supported
nano-sized LaMnO
3
using reverse micelle method for energy-saving oxygen
reduction cathode, Catal. Today 126 (2007) 313–319.
[40] M. Nakamine, M. Abe, K. Ogino, The effects of alkyl chain lengths of sodium
alkyl sulfates and n-alkanes on microemulsion formation, J. Colloid Interf. Sci.
135 (1990) 449–454.
[41] S.K. Ghosh, P.K. Khatua, S.C. Bhattacharya, Physicochemical characteristics of
reverse micelles of polyoxyethylene nonyl phenol in different organic solvents,
J. Colloid Interf. Sci. 279 (2004) 523–532.
[42] S. Matsushima, T. Maekawa, J. Tamaki, N. Miura, N. Yamazoe, New methods
for supporting palladium on a tin oxide gas sensor, Sens. Actuators B: Chem. 9
(1992) 71–78.
Biographies
Masayoshi Yuasa has been an assistant professor at Kyushu University Since 2005.
He received his ME degree in materials science in 2003.Hiscurrentresearchinterests
include the development of chemical sensors and active electrocatalysts for oxygen
reduction and oxygen evolution.
Takanori Masaki received his ME degree in materials science in 2007 from Kyushu
University.
Tetsuya Kida has been an associate professor at Kyushu University since 2006. He
received his ME degree in materials science in 1996 and his Dr. Eng degree in 2001
from Kyushu University. His current research interests include the development
of chemical sensors, nanoparticle synthesis, and self-assembles inorganic–organic
hybrid materials.
Kengo Shimanoe has been a professor at Kyushu University since 2005. He received
the BE degree in applied chemistry in 1983 and the ME degree in 1985 from
Kagoshima University and Kyushu University, respectively. He joined Nippon Steel
Corp. in 1985, and received PhD in engineering in 1993 from Kyushu University.
His current research interests include the development of gas sensors and other
functional devices.
Noboru Yamazoe had been a professor at Kyushu University since 1981 until he
retired in 2004. He received his BE degree in applied chemistry in 1963 and PhD in
engineering in 1969 from Kyushu University. His research interests were directed
mostly to development and application of functional inorganic materials.