- Trang chủ >>
- Khoa Học Tự Nhiên >>
- Vật lý
solvent-controlled synthesis of tio2 1d nanostructures growth mechanism and characterization
Bạn đang xem bản rút gọn của tài liệu. Xem và tải ngay bản đầy đủ của tài liệu tại đây (1.87 MB, 8 trang )
Solvent-controlled synthesis of TiO
2
1D nanostructures: Growth mechanism
and characterization
Kajari Das
Ã
, Subhendu K. Panda, Subhadra Chaudhuri
Department of Materials Science and DST Unit of Nanoscience, Indian Association for the Cultivation of Science, Raja S. C. Mallick Road, Kolkata, WB 700 032, India
article info
Article history:
Received 18 February 2008
Received in revised form
19 May 2008
Accepted 26 May 2008
Communicated by K. Nakajima
Available online 3 July 2008
PACS:
78.67.Ch
Keywords:
A1. Growth models
A2. Growth from solutions
B1. Nanomaterials
B2. Semiconducting materials
abstract
One-dimensional (1D) anatase TiO
2
nanostructures such as nanorods, nanowires and nanotubes with
different aspect ratios were synthesized by a simple solvothermal process. The influence of the different
organic solvents and the reaction time on the morphology, size and the formation of the nanostructures
were investigated. The anatase TiO
2
precursor powder reacted with highly alkaline aqueous solution,
yielding layered sodium titanate nanosheets. These nanosheets transformed to different 1D sodium
titanates nanostructures like nanorods, nanowires and nanotubes in the different solvents i.e. highly
alkaline aqueous solution, highly alkaline water–ethanol and highly alkaline water–ethylene glycol
mixed solvent, respectively. Acid treatment of these 1D sodium titanates resulted hydrated titanates
and finally dehydration by calcinations at 500 1C in air gave the products retaining the morphology. The
synthesized samples were characterized with XRD, SEM and TEM. All the 1D nanostructures showed
intense and sharp absorption spectra indicated that the products were almost defect free.
Photoluminescence studies of the nanostructures showed photostable UV emission properties that
arise from the band-edge free excitation.
& 2008 Elsevie r B.V. All rights reserved.
1. Introduction
In the past few years, the design and fabrication of the
nanostructured semiconductors based on metal oxides have
received considerable attention due to their interesting physical
and chemical properties, and their potential applications in
industry and technology [1–5]. TiO
2
is an n-type wide band-gap
oxide semiconductor used for variety of applications such as dye-
sensitized solar cell, environmental purification, nanodevices, gas
sensors, and photocatalysts [6–13]. Many techniques such as
sol–gel processing with electrophoretic deposition, spin-on
process, sol–gel template method, metalorganic chemical vapor
deposition, anodic oxidative hydrolysis, sonochemical synthesis,
inverse microemulsion method, and molten salt-assisted pyrolysis
routes have been developed to synthesize different TiO
2
nanos-
tructures [14–21]. Recently, the reaction between different TiO
2
precursors and a concentrated NaOH solution under moderate
hydrothermal method [22] is observed to be an effective approach
to prepare 1D nanostructures of titania. However, the main
attention is directed towards the control over structure and
morphology of titania only by varying the reaction temperature,
reaction time and pH of the solution during hydrothermal
treatment, while an important experimental parameter, solvent,
has rarely been deliberately controlled to achieve different 1D
nanostructures of titania. Solvothermal process is the most useful
technique to synthesize nanocrystalline materials with different
morphologies and sizes where properties of the solvents like
density, viscosity and diffusion coefficient change dramatically
and the solvent behaves much differently from that expected at
the normal conditions. Consequently, the solubility, diffusion
process and the chemical reactivity of the reactants are greatly
enhanced. The detailed studies of the effect of different organic
solvents on the morphologies of the TiO
2
nanocrystals under
solvothermal conditions have not been reported so far.
In this paper we have synthesized phase pure anatase TiO
2
in
different nanoforms such as single-crystalline nanorods, nano-
wires and nanotubes using a solvothermal route and investigate
the effects of the different solvents and reaction time on the
shape, size, and the optical properties of the nanostructures.
2. Experimental section
All the reactants and the solvents were of analytical grade and
were used without further purification. In a typical procedure,
274mg of pure anatase phase TiO
2
bulk-powder was mixed with
10 N NaOH (19.2 g of NaOH in 48 ml water) aqueous solution of
pH ¼ 12.77 under constant magnetic stirring for 1 h. A milky
ARTICLE IN PRESS
Contents lists available at ScienceDirect
journal homepage: www.elsevier.com/locate/jcrysgro
Journal of Crystal Growth
0022-0248/$ - see front matter & 2008 Elsevier B.V. All rights reserved.
doi:10.1016/j.jcrysgro.2008.05.039
Ã
Corresponding author. Tel.: +9133 2473 4971; fax: +9133 2473 2805.
E-mail address: (K. Das).
Journal of Crystal Growth 310 (2008) 3792– 3799
white solution was appeared, which was then transferred to a
Teflon-lined stainless steel autoclave with 60 ml capacity and heat
treated at 150 1C for 16 h. The sample obtained was denoted by S1.
Likewise, to investigate the effect of the co-solvent on the
morphology and the properties of TiO
2
nanostructures, 19.2 g of
NaOH was dissolved in 48 ml mixed solvent of water and an
organic solvent (ethylene glycol or ethanol or polyethylene glycol-
300 (PEG-300)) with a volume ratio 1:1. 274 mg TiO
2
precursor
powder was then mixed with the highly alkaline solvent mixer
under constant magnetic stirring for 1 h and the solution was heat
treated at 150 1C for 16 h in the autoclave. The samples obtained
were named as S2, S3, and S4, respectively (Table 1). Since the
solubility of NaOH decreases in the organic solvents than the
water, the pH values of the mixed solvents were less than that of
pure alkaline aqueous solution. For all the cases, the autoclave
chambers were air-cooled to room temperature after the reac-
tions. The formed white precipitates were recovered by centrifu-
gation and washed several times with distilled water. An
ultrasonic treatment of the products with 0.1 N HCl solution was
carried out at pH$7, and the precipitates were finally calcinated at
500 1C for 4 h in air. To investigate the formation mechanism of
the different nanostructures, some additional experiments were
also carried out at 150 1C for different time intervals, i.e. for
30 min, 1, 8, 16 and 24 h in pure alkaline aqueous solution and for
30 min, 1, 8 and 16 h in different alkaline mixed solvents.
The crystalline phases of the products were determined by
X-ray powder diffraction by using a Seifert 3000P diffractometer
with Cu Ka radiation (l ¼ 1.54 A
˚
). The morphologies of the
samples were studied by a scanning electron microscope (SEM;
Hitachi S-2300). Microstructural properties were obtained using
transmission electron microscope and high-resolution transmis-
sion electron microscope (TEM and HRTEM; JEOL 2010). For the
TEM observations, the powders were dispersed in 2-propanol and
ultrasonicated for 15 min. A few drops of this ultrasonicated
solution were taken on a carbon-coated copper grid. FTIR spectra
recorded in the range 4000–400 cm
À1
with a Shimadzu model
FTIR spectrometer using KBr wafer. Optical absorbance of the
samples was recorded by a UV–vis–NIR spectrophotometer
(Hitachi, U-3410). Photoluminescence (PL) measurements were
carried out at room temperature with a Fluorescence spectro-
meter (F-2500) using 310 nm excitation wavelength.
3. Results and discussion
The crystal structure, morphology and size of the synthesized
products determined by XRD, SEM, and TEM are listed in Table 1.
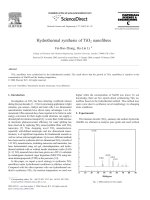
Fig. 1(a) shows the XRD pattern of all the samples, which revealed
ARTICLE IN PRESS
20 30 40 50 60 70 80
S4
S3
S2
S1
(204)
(211)
(105)
(200)
(
004)
(101)
Intensity (arb.unit)
FWHM
S1
= 0.465°
FWHM
S2
= 0.485°
FWHM
S3
= 0.519°
FWHM
S4
= 0.586°
10 20 30 40 50 60 70 80
III
II
I
#
#
#
#
#
#
#
#
#H
2
Ti
3
O
7
#
#
#
#
#
#
*Na
2
Ti
3
O
7
*
*
*
*
Intensity (arb.unit)
2
θ
(in degree)
2θ (in degree)
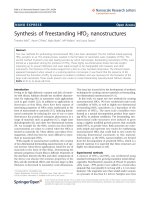
Fig. 1. XRD spectra of (a) samples S1–S4 synthesized in the different solvents and
(b) the TiO
2
precursor powder (I), synthesized intermediate products washing with
water (II) and obtained after ultrasonic acid treatment (III).
Table 1
The effect of experimental parameters on the morphologies, sizes and band gaps of
the TiO
2
nanoforms
Sample
name
Solvent Reaction
temperature
(1C)
Reaction
time
(h)
Morphology Size (nm) Band
gap
(eV)
S1 Water 150 16 Nanorods D ¼ 9,
L ¼ 120–170
3.69
S2 Water:
ethylene
glycol
(1:1)
150 16 Nanotubes D ¼ 11,
L ¼ 100–140
3.67
S3 Water:
ethanol
(1:1)
150 16 Ultralong
nanowires
D ¼ 4,
L ¼ several
micrometers
3.73
S4 Water:
PEG-
300 (1:1)
150 16 Nanoparticles 16 3.63
K. Das et al. / Journal of Crystal Growth 310 (2008) 3792–3799 3793
that irrespective of the variation of the solvents, all the peaks
corresponding to the reflections from (10 1), (0 0 4), (2 0 0), (1 0 5),
(211), and (20 4) planes of anatase tetragonal TiO
2
were
observed, which are well matched with the standard reported
values (JCPDS file No. 21-1272). The (101) peaks of all the samples
were fitted to the Gaussian curves and the FWHM (full-width at
half-maximum) were estimated, as mentioned in Fig. 1(a). It is
noted that the FWHM were decreased in the order S1oS2o-
S3oS4, which may be attributed to the improvement of crystal-
linity of the samples in the order S14S24S34S4. Fig. 1(b) shows
the XRD patterns of the TiO
2
precursor and the two intermediate
products obtained after washing the as synthesized products with
water and ultrasonicating with HCl. The spectrum II indicates the
presence of the Na
2
Ti
3
O
7
and H
2
Ti
3
O
7
in the products washing
with water. After treatment with 0.1 N HCl, the products were
completely transformed to the hydrated titanate (H
2
Ti
3
O
7
)by
substitution of the Na
+
by H
+
, which is clearly revealed from the
XRD spectrum III. These two intermediate phases were appeared
for all the samples. Final products were obtained after calcination
of the hydrated titanates at 500 1C for 4 h.
The growth process of the different 1D TiO
2
nanostructures
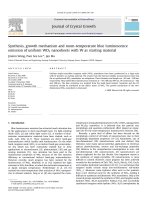
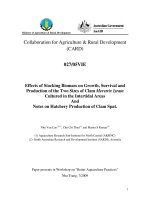
was monitored by SEM and TEM. Fig. 2(a–c) shows the SEM
images of the samples S1–S3, respectively, which reveal that the
reaction of TiO
2
precursor with highly alkaline aqueous solution
and highly alkaline mixed solvents gave 1D nanostructures.
Although the shapes of these 1D nanostructures are not clear by
the SEM images, the TEM images later clearly show nanostruc-
tures’ morphologies. Fig. 2(d) shows the SEM image of the 1D
nanostructures obtained in highly alkaline aqueous solution at
150 1C for 24 h. By comparing the images in Fig. 2(a) and (d), it
may be concluded that the diameters of the 1D nanostructures
obtained in highly alkaline aqueous solution decrease with
increasing reaction time.
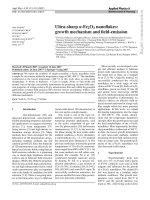
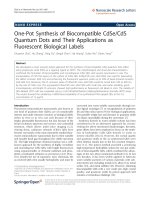
Fig. 3(a–c) shows the low magnification TEM images of the
TiO
2
samples obtained in highly alkaline aqueous solutions at
150 1C for 8, 16 and 24 h, respectively, which clearly reveal that the
diameters of the nanorods decreased, whereas the lengths of the
rods increased with the increasing reaction time. Ultimately, the
nanorods transformed to nanowires when the reaction time was
greater than 24 h. The possible explanation of this transformation
is given later in the formation mechanism part. In Fig. 3(d), the
low magnification TEM image of the sample S2 gives the
nanotubes having inner diameter 6 nm and outer diameter
11 nm; and length 100–140 nm. Fig. 3(e) shows the HRTEM image
of a nanotube. The number of the walls counted from the two
sides of the tubes was not identical. Moreover, the wall thickness
generally varied along the tube. The left inset in Fig. 3(e) is an
enlarged picture of the tube wall as marked by the white circle.
The periodicity of the fine fringes was 0.37 nm, which indicates
the (1 0 1) plane of the anatase TiO
2
. The interspacing of the tube
walls was 0.77 nm. Crystal structures of the TiO
2
nanorods
(sample S1) were also studied through HRTEM, which is shown
in Fig. 3(f). The fringes parallel to the nanorod axis correspond to
an interplanar distance of about 0.35nm, which is characteristic
of (10 1) plane of TiO
2
in the anatase phase. The clear lattice
fringes confirm the nanorods are single-crystalline and defect free.
The inset of Fig. 3(f) shows the FFT pattern of the nanorod, which
also indicates the (1 0 1) plane of the anatase TiO
2
and confirms
the single-crystalline nature of the nanorod. Fig. 3(g) shows the
low-magnification TEM image of the ultralong nanowires of
sample S3. Fig. 3(h) gives the TEM image of the nanoparticles of
16 nm obtained for sample S4. The inset of Fig. 3(h) is the HRTEM
image of a nanoparticle showing lattice fringes (d ¼ 0.342 nm)
corresponding to the (1 0 1) lattice plane of the anatase TiO
2
. The
diameters and lengths of the different nanostructures calculated
from TEM images are shown in Table 1. SEM and TEM images
revealed that in all the solvents except PEG-300, 1D nanostruc-
tures of different morphologies such as nanorods, nanowires and
nanotubes with different diameters and lengths were formed.
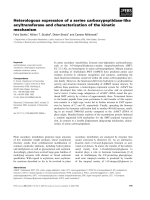
To understand the formation of the different 1D nanostruc-
tures controlled experiments were carried out and the products at
different time intervals were examined. SEM images of the
ARTICLE IN PRESS
Fig. 2. SEM micrographs for (a–c) the samples S1, S2 and S3, respectively and (d) the product obtained in highly alkaline aqueous solution at 150 1C for 24 h.
K. Das et al. / Journal of Crystal Growth 310 (2008) 3792–37993794
intermediate products at different time intervals are shown in
Fig. 4. The reaction of the TiO
2
precursor with the highly alkaline
aqueous solution at room temperature gave single layered titanate
nanosheets. Fig. 4(a) shows the single layered nanosheets and
some unreacted TiO
2
particles. At high temperature (150 1C) and
pressure in autoclave, the splitting of the nanosheets occurred
within 30 min of the reaction, which is clearly shown in Fig. 4(b).
Fig. 4(c) reveals that the formation of the network of the nanorods
began with the further splitted nanosheets at 150 1C for 1 h.
Finally, the crystalline anatase nanorods were obtained; when the
reaction time was 8 h as shown in Fig. 4(d). The bended
multilayered titanate nanosheets were obtained when TiO
2
precursor reacted with the highly alkaline water–ethylene glycol
mixed solvent at room temperatures, shown in Fig. 4(e). The
splitting and simultaneous rolling of these bended multilayered
nanosheets occurred at 150 1C for 30 min, which is clearly shown
in Fig. 4(f). Fig. 4(g) shows that the product obtained for the
reaction time 1 h gave nanotubes (arrow I) coexisting with
splitted and bended multilayered nanosheets (arrow II), left inset
of the figure shows the enlarged picture of the agglomerated
nanotubes; but the product for 8h (Fig. 4(h)) gave complete
formation of the nanotubes. Ultimately, well crystalline nanotubes
were observed for the reaction time 16 h. In Fig. 4(i), the SEM
image of the nanoparticles obtained in the highly alkaline
water–PEG-300 mixed solvent at room temperature indicates
that no sheet-like morphology was formed in this mixed solvent.
Fig. 5 shows the FTIR spectra of the samples S1–S4. All the
spectra show broad bands at 3435 and 1635 cm
À1
, which
correspond to the presence of the OH group and water, absorbed
on the surface of the TiO
2
samples [23–25]. In addition, for
samples S2–S4, two bands at 2860 and 2931 cm
À1
are observed,
which are attributed to the symmetric and asymmetric CH
2
stretching vibrations, respectively [26], coming from the co-
solvents. The peak at 2348 cm
À1
was due to CO
2
and was not
related to the samples. Also a band appears around 453cm
À1
for
all the samples, which corresponds to a Ti–O band of anatase
phase of TiO
2
[27,28]. The intensity of this band increases in the
order S14S24S34S4, revealing that the crystallinity of the
products improve in this order, which is in good agreement with
the XRD and TEM observations of the samples.
ARTICLE IN PRESS
Fig. 3. Low-resolution TEM images of the (a–c) TiO
2
samples obtained in highly alkaline aqueous solution at 150 1C for 8, 16 and 24 h, respectively, and (d) TiO
2
nanotubes
(sample S2); (e) HRTEM image of the sample S2 and the inset shows the enlarged picture of the tube wall; (f) HRTEM image of sample S1 and the inset shows the FFT
pattern; (g) low-resolution TEM image of the sample S3; (h) low-resolution TEM image of sample S4 and the inset shows the HRTEM image of a nanoparticle.
K. Das et al. / Journal of Crystal Growth 310 (2008) 3792–3799 3795
The growth process toward the formation of 1D nanostructures
can be explained from the microstructural and crystallographic
evidence. Fig. 6 is the simplified schematic model showing the
different stages for the growth of different TiO
2
nanostructures.
TiO
6
octahedron is the basic unit of the crystalline structure of the
anatase TiO
2.
The three-dimensional framework of the oxide is
build up by sharing the vertice edges of the octrahedra. When TiO
2
precursor reacts with highly alkaline NaOH solution, some of the
Ti–O–Ti bonds of the raw material are broken and layered
titanates composed of octahedral TiO
6
units with Na
+
metal ions
are formed in the form of thin small sheets. The formation of the
intermediate nanosheets of sodium titanate (Na
2
Ti
3
O
7
) phase is
confirmed by XRD spectrum and SEM image. The titanate and
anatase have common structural features: both crystal lattices
consist of the octahedral sharing four edges and the zigzag
ribbons [29]. The strength of Na–O bonding is weaker than that of
Ti–O bonding in Na
2
Ti
3
O
7
layered structure. These Na–O bonds
may break at the high temperature and pressure in the autoclave
and the single layered nanosheets split to form the nanorods. As
the reaction time increases, further splitting of the nanosheets
may increase the aspect ratio of the nanorods and hence after
24 h reaction transformation of the nanorods to nanowires
was observed. After washing with water and ultrasonic acid
treatment, hydrated titanates (H
2
Ti
3
O
7
) are formed by the
substitution of Na
+
by H
+
, which is revealed by the XRD. The final
anatase TiO
2
products are obtained when dehydration of the
hydrated titanates are occurred at the time of the calcinations of
the products at 500 1C for 4 h [30]. The SEM images of the sodium
ARTICLE IN PRESS
Fig. 4. SEM micrographs for (a–d) the intermediate products obtained in highly alkaline aqueous solution at room temperature and at 150 1C for 30min, 1 and 8h,
respectively; (e–h) the intermediate products in highly alkaline water–ethylene glycol mixed solvent at room temperature and at 150 1C for 30 min, 1 h, 8 h, respectively and
inset of (g) shows the enlarged picture of the agglomerated nanotubes; (i) the intermediate product in highly alkaline water-PEG-300 mixed solvent at room temperature.
3500 3000 2500 2000 1500 1000 500
2348
453
S1
S4
S3
S2
1635
2860
2931
Transmittance (arb. unit)
Wave number (cm
-1
)
3435
Fig. 5. FTIR spectra of the samples S1–S4.
K. Das et al. / Journal of Crystal Growth 310 (2008) 3792–37993796
and hydrated titanates also indicate that the morphology of the
intermediate products was almost same as the final anatase TiO
2
products.
It is well known that the solvent plays an important role to
control the morphology of the product. In our experiments, the
polarity and coordinating ability of a co-solvent have strong effect
on the solubility, reactivity, and diffusion behavior of the
reactants, thus ultimately influencing the structure and morpho-
logical features of the resulting products. Zhang et al. [31]
considered that the bending of the multilayered titanate
nanosheets occurred in highly alkaline aqueous solution at
130 1C due to the imbalance of ion concentration on two different
sides of the nanosheets in an asymmetrical chemical environ-
ment. In our experiment, when ethylene glycol was used as the
co-solvent with highly alkaline aqueous solution, multilayered
sodium titanate nanosheets were formed due to the chelating
property of ethylene glycol. TiO
6
octrahedra may coordinate with
glycol to form chain-like structures [32], whereas the NaOH may
form titanate nanosheets by sharing the vertice edges of the
octrahedra. The negative charge of the titanate layers coordinated
with glycol on the side underneath the surface is neutralized by
Na
+
in the interlayer space. The Na
+
on the top surface of the
layers may undergo frequent collision with OH
À
from the solution.
The electronegativity of the titanate layers coordinated with
glycol is greater than that of titanate layers in normal alkaline
aqueous solution. The Na
+
deficiency on the upper surface of the
multilayered titanates coordinated with glycol bends the na-
nosheets to minimize the excess surface energy. The bending of
the multilayered nanosheets is confirmed by the SEM image. At
high temperature and pressure in the autoclave, the splitting and
simultaneous rolling of the sheets give nanotube structures.
Another reason for the rolling of the splitted multilayered
nanosheets at high temperature may be due to the mechanical
tensions that arise during the process of dissolution/crystal-
lization in nanosheets [33]. Due to chelating property of the
ethylene glycol, the slow nucleation rate and the very fast growth
rate of the crystal may favor the rolling process of the sheets.
During spontaneous crystallization and rapid growth of layers, it
is possible that the width of the different layers varies, which
gives rise to excess surface energy. In order to decrease the excess
surface energy, the rolling of splitted nanosheets occurs. Bavykin
et al. [34] described that the nanotubes were formed in highly
alkaline aqueous solutions at low temperature (110–150 1C) and
nanofibres were formed at the temperature 150 1C. These
nanotubes were transformed to the nanorods as calcinated at
500 1C. These observations revealed that the nanotube structures
are thermally unstable than the nanorods and nanofibres. In our
present work, the nanotubes were obtained at 150 1C using
ethylene glycol as the co-solvent and the structures remained
unchanged after calcination at 500 1C for 4 h, which indicate that
the nanotubes formed by the ethylene glycol assisted method are
more thermally stable than the normal alkaline aqueous solution.
The formation of ultralong nanowires may arise from the very fast
growth rate and the rapid splitting of the sodium titanate
nanosheets in highly alkaline water–ethanol mixed solvent. The
rapid growth rate and the fast splitting of the nanosheets may
cause various defects in the crystals, which were clearly revealed
from the optical absorbance and photoluminescence studies
discussed later. For the co-solvent PEG-300, the intermediate
products were investigated and in this case no sheet-like
morphology was observed and finally nanoparticles of 16 nm
were obtained. The SEM image shown in Fig. 4(i) confirms
the presence of nanoparticles instead of the nanosheets. Pre-
viously, Zhu et al. [35] reported the formation of TiO
2
mesoporous
structures using PEG-200 as the solvent in a hydrothermal
method, which destroyed and grains were appeared when
the reactions time was increased. Also, due to the presence
of the inorganic polymer, the degree of the crystallization
was observed to be poor. One-dimensional nanostructures
were not formed, when we used only pure organic solvent
without alkaline aqueous solution. Thus it may be concluded
that in highly alkaline aqueous solution formation of the 1D
ARTICLE IN PRESS
Highly
alkakline
aqueous
solution
Nanosheets &
unreacted particles
High temperature
& pressure
High temperature
& pressure
Bended multilayered nanosheets
& unreacted particles
Nanosheets &
unreacted particles
Highly alkaline
water-EG
mixed soluiton
Highly alkaline
water-ethanol
mixed soluiton
TiO2 bulk
powder
Splitting
Splitted
nanosheets
Reaction
time > 8h
Reaction
time > 30 min
Reaction
time > 24h
Nanorods
Nanowires
Reaction
time > 16h
Nanotubes
Splitting & simultaneous rolling
of the multilayred nanosheets
High
temperature &
pressure
Splitting
Ultra long
nanowires
Fig. 6. Schematic diagram showing formation of different TiO
2
nanostructures under different synthesis conditions.
K. Das et al. / Journal of Crystal Growth 310 (2008) 3792–3799 3797
nanostructures takes place and the organic solvents used with
highly alkaline aqueous solution only control the shapes of the 1D
nanostructures.
Fig. 7(a) shows the optical absorption spectra of the samples
S1–S4 prepared in different solvents. It is interesting to note that
the 1D nanostructures show intense and sharp absorption spectra
indicating the formed 1D nanostructures were almost defect free
and high crystalline in nature. The spectra also show that the
sharpness of the absorption peaks near the band edge increased in
the order S14S24S34S4, indicates that well crystalline products
were obtained using water and water–ethylene glycol mixed
solvent. Fig. 7(b) shows the differential absorbance spectra (dA/dl
versus l) of the TiO
2
precursor powder and the sample S1. The
band gaps of all the other samples were also determined from
differential absorbance spectra, which are shown in Table 1. The
band gaps of the TiO
2
nanostructures were varied from 3.63 to
3.73 eV, which are slightly blue shifted from the bulk value of
anatase phase of the TiO
2
(3.21 eV) may be due to the nanosize
effect.
The room temperature PL spectra of all the samples were
recorded with 310 nm excitation. Fig. 8 shows the PL spectra of all
the samples. The signal at $372 nm could be attributed to
emission peak from band edge free excitation [36]. The red shift
takes place for the samples S3 and S4, which may be due to the
oxygen vacancies [37]. In addition, another broad band between
400 and 510 nm was observed. The origin of this broad band was
already reported by Daude and co-workers [38]. The lowest
energy allowed phonon-assisted transitions of the anatase TiO
2
from center to the edge of the Brillouin zone are the indirect
transitions, namely G
1b
-X
2b
(406 nm) and G
1b
-X
1a
(426 nm).
The emissions at 455 and 504 nm are due to the transitions from
intragap energy levels implicating lattice defects and oxygen
vacancy. The PL results also reveal that the nanostructures
showed photostable UV emission properties and also clearly
indicate that the almost defect free, well crystalline TiO
2
samples
were prepared at 150 1C using highly alkaline aqueous solution
and highly alkaline water–ethylene glycol mixed solvent.
4. Conclusions
Different 1D nanostructures such as nanorods, nanowires, and
nanotubes of TiO
2
in anatase phase were synthesized by a simple
solvothermal method. We have demonstrated the control over the
structures, sizes and morphologies of the products by controlling
the reaction temperature, time and by using different mixed
solvents. In such synthesis, the reaction of the anatase TiO
2
precursor powder with highly alkaline aqueous solution produced
layered sodium titanate nanosheets at room temperature. The
splitting of the single layered nanosheets at high temperature and
pressure in the autoclave gave the nanorods. As the reaction time
increases, further splitting of the nanosheets may increase the
aspect ratio of the nanorods and hence after 24 h reaction
transformation of the nanorods to nanowires was observed.
When ethylene glycol was used as the co-solvent with highly
alkaline aqueous solution, multilayered sodium titanate na-
nosheets were formed at room temperature and the splitting
and simultaneous rolling of these sheets gave nanotube structures
at high temperature and pressure in the autoclave. The ultralong
nanowires were obtained in highly alkaline water–ethanol mixed
solvent, whereas nanoparticles were formed in highly alkaline
water–PEG-300 mixed solvent. A plausible mechanism for the
ARTICLE IN PRESS
400 500 600 800
S1
S2
S3
S4
Absorbance (arb.unit)
TiO
2
precursor
3.21eV
3.69eV
S1
300
λ (nm)
700
400 500 600 800300
λ (nm)
700
dA/dλ (arb.unit)
TiO
2
precursor
Fig. 7. (a) Optical absorbance spectra of all the samples, (b) differential absorbance
spectra (dA/dl versus l) of the TiO
2
precursor powder and the sample S1.
360 420 450 480
S4
S3
S1
S2
Intensity (arb.unit)
λ (nm)
330 390 510
Fig. 8. Photoluminescence spectra of all the samples.
K. Das et al. / Journal of Crystal Growth 310 (2008) 3792–37993798
formation of different 1D nanostructures has been proposed. The
final anatase TiO
2
products were obtained by dehydration of
the hydrated titanates at 500 1C in air, where retention of the
morphologies of the products was observed during the phase
transformation. TEM and SEM observations revealed that the
solvent is the most crucial factor in determining the morphologies
of the products and the reaction time is the most influential factor
in controlling the diameters and lengths of the products. Due to
the phase purity and well crystalline nature of the TiO
2
1D
nanostructures, they will be certainly applicable in the fields of
photocatalysis, electrocatalysis, lithium batteries, hydrogen sto-
rage, and solar-cell technologies.
Acknowledgments
This paper is dedicated to the memory of Prof. Subhadra
Chaudhuri whose continuous support and effective guidance have
made this work possible. The authors thank Mr. K. K. Das of IACS
for recording the SEM micrographs.
References
[1] D. Li, Y. Xia, Adv. Mater. 16 (2004) 1151.
[2] X. Huang, C. Pan, J. Crystal Growth 306 (2007) 117.
[3] C.N.R. Rao, F.L. Deepak, G. Gundiah, A. Govindaraj, Prog. Solid State Chem. 31
(2003) 5.
[4] C.S. Kim, B.K. Moon, J.H. Park, B.C. Choi, H.J. Seo, J. Crystal Growth 257 (2003)
309.
[5] D.S. Seo, J.K. Lee, H. Kim, J. Crystal Growth 229 (2001) 428.
[6] T. Kasuga, M. Hiramatsu, A. Hoson, T. Sekino, K. Niihara, Langmuir 14 (1998)
3160.
[7] T. Kasuga, M. Hiramatsu, A. Hoson, T. Sekino, K. Niihara, Adv. Mater. 11 (1999)
1307.
[8] Q. Chen, W.Z. Zhou, G.H. Du, L.M. Peng, Adv. Mater. 14 (2002) 1208.
[9] G.H. Du, Q. Chen, R.C. Che, Z.Y. Yuan, L.P. Peng, Appl. Phys. Lett. 79 (2001)
3702.
[10] B.D. Yao, Y.F. Chan, X.Y. Zhang, W.F. Zhang, Z.Y. Yang, N. Wang, Appl. Phys. Lett.
82 (2003) 281.
[11] Z.Y. Yuan, W. Zhou, B.L. Su, Chem. Commun. (2002) 1202.
[12] J.G. Yu, J.C. Yu, W.K. Ho, L. Wu, X.C. Wang, J. Am. Chem. Soc. 126 (2004)
3422.
[13] D.Y. Zhang, L.M. Qi, Chem. Commun. (2005) 2735.
[14] S.J. Limmer, G. Cao, Adv. Mater. 15 (2003) 427.
[15] D.K. Yi, S.J. Yoo, D. -Y. Kim, Nano Lett. 2 (2002) 1101.
[16] Z. Miao, D. Xu, J. Ouyang, G. Guo, X. Zhao, Y. Tang, Nano Lett. 2 (2002)
717.
[17] J J. Wu, C C. Yu, J. Phys. Chem. B 108 (2004) 3377.
[18] Y. Lei, L.D. Zhang, J.C. Fan, Chem. Phys. Lett. 338 (2001) 231.
[19] Y. Zhu, H. Li, Y. Koltypin, Y.R. Hacohen, A. Gedanken, Chem. Commun. (2001)
2616.
[20] G. Wang, G. Li, Eur. Phys. J. D 24 (2003) 355.
[21] C. Xu, Y. Zhan, K. Hong, G. Wang, Solid State Commun. 126 (2003) 545.
[22] Y. Lan, X.P. Gao, H.Y. Zhu, Z.F. Zheng, T.Y. Yan, F. Wu, S.P. Ringer, D.Y. Song, Adv.
Funct. Mater. 15 (2005) 1310.
[23] T. Nakayama, J. Electrochem. Soc. 141 (1994) 237.
[24] E. Sanchez, T. Lopez, R. Gomea, A. Morales, O. Novaro, J. Solid State Chem. 122
(1996) 309.
[25] Z. Ding, G.Q. Lu, P.F. Greenfield, J. Phys. Chem. B 104 (2000) 4815.
[26] J. Joo, S.G. Kwon, T. Yu, M. Cho, J. Lee, J. Yoon, T. Hyeon, J. Phys. Chem. B 109
(2005) 15297.
[27] S. Music, M. Gotic, S. Ivanda, S. Popovic, A. Turkovic, R. Trojko, A. Seculic,
K. Furic, Mater. Sci. Eng. B 47 (1997) 33.
[28] M. Ocana, V. Fornes, J.V. Serna, J. Solid State Chem. 75 (1988) 364.
[29] B. Wang, Y. Shi, D. Xue, J. Solid State Chem. 180 (2007) 1038.
[30] X. Jing, Y. Li, Q. Yang, Q. Yin, Mat. Sci. and Eng. B 110 (2004) 18.
[31] S. Zhang, L M. Peng, Q. Chen, G.H. Du, G. Dawson, W.Z. Zhou, Phys. Rev. Lett.
91 (2003) 256103.
[32] X. Jiang, Y. Wang, T. Herricks, Y. Xia, J. Mater. Chem. 14 (2004) 695.
[33] D.V. Bavykin, V.N. Parmon, A.A. Lapkin, F.C. Walsh, J. Mater. Chem. 14 (2004)
3370.
[34] D.V. Bavykin, J.M. Friedrich, F.C. Walsh, Adv. Mater. 18 (2006) 2807.
[35] R. Tan, Y. He, Y. Zhu, B. Xu, L. Cao, J. Mater. Sci. 38 (2003) 3973.
[36] L.D. Zhang, C.M. Mou, Nanostruct. Mater. 6 (1995) 831.
[37] I. Justicia, P. Ordejon, G. Canto, J.L. Mozos, J. Fraxedas, G.A. Battiston,
R. Gerbasi, A. Figueras, Adv. Mater. 14 (2002) 1399.
[38] N. Daude, C. Gout, C. Jouanin, Phys. Rev. B 15 (1977) 3229.
ARTICLE IN PRESS
K. Das et al. / Journal of Crystal Growth 310 (2008) 3792–3799 3799