- Trang chủ >>
- Khoa Học Tự Nhiên >>
- Vật lý
studies on tin oxide-intercalated polyaniline nanocomposite for ammonia gas
Bạn đang xem bản rút gọn của tài liệu. Xem và tải ngay bản đầy đủ của tài liệu tại đây (1.35 MB, 9 trang )
Sensors and Actuators B 138 (2009) 76–84
Contents lists available at ScienceDirect
Sensors and Actuators B: Chemical
journal homepage: www.elsevier.com/locate/snb
Studies on tin oxide-intercalated polyaniline nanocomposite for ammonia gas
sensing applications
N.G. Deshpande
a,c
, Y.G. Gudage
a
, Ramphal Sharma
a,∗
, J.C. Vyas
b
, J.B. Kim
c
, Y.P. Lee
c
a
Thin Film and Nanotechnology Laboratory, Department of Physics, Dr. B.A. Marathwada University, Auranganbad 431004 (M.S.), India
b
Technical Physics and Prototype Engineering Division, Bhabha Atomic Research Center, Trombay, Mumbai 400085, India
c
Quantum Photonic Science Research Center and BK21 Program Division of Advanced Research and Education in Physics, Hanyang University, Seoul 133-791, Republic of Korea
article info
Article history:
Received 12 August 2008
Received in revised form
22 December 2008
Accepted 2 February 2009
Available online 20 February 2009
Keywords:
Conducting polymer
Solution route technique
Nanocomposite PANI films
Surface morphology
Optical studies and gas sensor analysis
abstract
Thin films oftin oxide-intercalated polyaniline nanocomposite have been deposited at room temperature,
through solution route technique. The as-grown films were studied for some of the useful physico-
chemical properties, making use of XRD, FTIR, SEM, etc. and optical methods. XRD studies showed peak
broadening andthe peak positions shift from standard values, indicating presence of tinoxide innanopar-
ticles form in the polyaniline (PANI) matrix. FTIR study shows presence of the Sn–O–Sn vibrational peak
and characteristic vibrational peaks of PANI. Study of SEM micrograph revealed that the composite par-
ticles have irregular shape and size with micellar templates of PANI around them. AFM images show
topographical features of the nanocomposite similar to SEM images but at higher resolution. Optical
absorbance studies show shifting of the characteristics peaks for PANI, which may be due to presence
of tin oxide in PANI matrix. On exposure to ammonia gas (100–500 ppm in air) at room temperature, it
was found that the PANI film resistance increases, while that of the nanocomposite (PANI+ SnO
2
) film
decreases from the respective unexposed value. These changes on removal of ammonia gas are reversible
in nature, and the composite films showed good sensitivity with relatively faster response/recovery time.
© 2009 Elsevier B.V. All rights reserved.
1. Introduction
Metal oxide thin-film gas sensors are widely used for detecting
gas species by measuring changes in their physical properties on
exposure to specificgas, in particularmaking use ofreversibleredox
reactions in presence or absence of the specific gas media. Usually,
the smallchange inchemical state ofthe film material may reflect as
measurable change in some physical properties, such as electrical
conductivity, whichcanbe monitored by externalelectricalcircuits.
Pure tin oxide, SnO
2
is a remarkable n-type semiconductor material
having wide band gap (∼3.6 eV), and by making use of small quan-
tity of dopant into it’s matrix, thin films of this material find use in
several devices such as flat panel displays, gas sensors [1,2], etc. to
name a few. However, the sensors incorporating tin oxide require
an elevated temperature (≥200
◦
C) for their optimum operation.
This calls for a separate temperature controlled heater assembly to
operate the device, and requiring extra power for heating. In addi-
tion, the sensor operation at elevated temperature in itself causes
gradual changes in the tin oxide film properties, which in turn devi-
ate gas sensing properties of the device with time. Therefore, it is
highly desirable to have sensors, which can operate at room tem-
∗
Corresponding author. Tel.: +91 9422793173; fax: +91 240 2403335/3115.
E-mail address: (R. Sharma).
perature, but having comparable properties with that of tin oxide
for gas sensing.
Conducting polymers (CPs) are in use as an alternative to
metal oxide materials for gas sensing applications. Among the CPs,
polyaniline (PANI) has become one of the technologically impor-
tant CPs, because of it’s relatively easier synthesis, and for having
excellent electronic and electro-chromic properties. It has been
used in making organic solar cell, as well as gas sensor applications
[3–6]. However, PANI is not as sensitive as metal oxides towards gas
species, and its poor solubility in organic solvents limits its applica-
tions. In spite of these problems with PANI, efforts are being made
to improve itssolubilityby involving protonation withorganic acids
or preparing it using emulsion polymerization in presence of sur-
factants [7]. There have been several reports on improving PANI’s
sensitivity and selectivity by making use of new methods, such as
its synthesis in nano-structured forms [8,9], or by addition of metal
catalysts [10,11], and by combination with other polymers [12].
Recently a new class of materials emerged, known as compos-
ites, prepared by mixing suitably the organic and inorganic base
materials in proper form. The composite materials have special
properties, but as seen in some of the cases, they can also have few
desirable properties from both the parent organic and inorganic
class of materials. As a consequence, there are growing interests in
combining both organic and inorganic materials for applications in
electronics, optics, magnetism, etc. [13–15]. In literature, there are
0925-4005/$ – see front matter © 2009 Elsevier B.V. All rights reserved.
doi:10.1016/j.snb.2009.02.012
N.G. Deshpande et al. / Sensors and Actuators B 138 (2009) 76–84 77
some reports concerning PANI/inorganic nanocomposite sensors
[16–18]. However, very few researchers have studied the composite
SnO
2
/PANI for sensor application [19,20].
We fabricated nanocomposites thin films of SnO
2
/PANI by incor-
porating SnO
2
particles in the form of colloidal suspensions in PANI
through solution route technique. The as-grown composite films
were characterized using X-ray diffraction (XRD), Fourier transform
infrared (FTIR) spectroscopy, scanning electron microscopy (SEM),
atomic force microscopy (AFM),and optical absorbancestudies. The
as-grown films were exposed to NH
3
gas at room temperature and
the electrical response was noted. For a comparison, thin films of
tin oxide, and PANI were also prepared separately, and evaluated
along with the tin oxide/PANI composite films for sensing ammo-
nia gas at room temperature. We report our findings in this paper
and discuss a plausible mechanism for the formation and electronic
behaviour of such nanocomposites.
2. Experimental
2.1. Synthesis
We employed solution-route technique, to synthesize tin
oxide/polyaniline nanocomposites. In this technique, formation of
nanocomposites proceeds through an inorganic/organic interface
reaction. Tin chloride (SnCl
4
·5H
2
O), hydrogen peroxide (H
2
O
2
),
aniline, ammonium peroxydisulphate (APS) [(NH
4
)
2
S
2
O
8
] and
hydrochloric acid (HCl) (all chemicals having AR grade), were pur-
chased from M/s Loba Chemie, Mumbai (India). Aniline monomer
was distilled under reduced pressure. Initially, SnCl
4
·5H
2
O, was
hydrolyzed, using 2 g of SnCl
4
·5H
2
O in 50 ml of double distilled
water (DDW) with constant stirring, and it’s pH was maintained
at ≤4, using dilute HCl. Hydrogen peroxide was added in the above
solution, which oxidizes tin ions to tin oxide, and the solution turns
into a white colored suspension of SnO
2
and it serves as the starting
reaction mixture for further processing. From this reaction mixture,
40 ml volume was taken and mixed with appropriate volume of ani-
line, and kept below 4
◦
C. After 30 min, the APS solution was added
in the above mixture to make the reaction bath mixture. In this
bath mixture pre-cleaned glass substrates were inserted vertically.
It was found that after few minutes the solution color turns bluish
to green, which also mark the growth of film on the substrate.
The reaction mechanism was studied by monitoring thechanges
in pH and temperature of the reaction bath with time [21–24],for
both cases, i.e., for baths having with the tin oxide nanoparticles
suspension and without it. ThepHand temperature were measured
by digital -pH system 361, supplied by Systronics.
The as-grown films were washed with DDW and dried. Simi-
larly, the precipitate was washed thoroughly using DDW, dried and
casted into pellets. In order to study the response of the above
films to ammonia gas, silver contacts were made on top of the
film surface, by vacuum evaporation technique and making use
of shadow masking. For this purpose HIND-HIGHVAC system was
used. The chamber pressure during silver evaporation was kept
around 0.5 × 10
−5
Torr, and during metal evaporation, film sub-
strates were not heated.
2.2. Characterization
The physical thickness of the as-grown nanocomposites film
was measured using Fizeau fringe technique, and it was about
191nm. The XRD patterns of these films were recorded on a Bruker
AXS (D8 Advanced, Germany) diffractometer in the scanning range
of 20–70
◦
(2Â) using Cu K␣ radiation having a wavelength of
1.5405 Å. The infrared spectrum of nanocomposite samples pel-
letized with KBr were measured using a Fourier transformed
infrared spectrometer (PerkinElmer’s Spectrum1 spectrometer).
The surface morphology was studied by field emission scanning
electron microscopy (FESEM JEOL-JSM 6500F). The surface mor-
phology was studied using an AFM (Nanoscope IIIa produced
by Vecco Digital Instruments). The root mean square (rms) sur-
face roughness was determined using software provided with
the microscope. Absorbance spectra were recorded in a range of
300–1000 nm by means of a PerkinElmer Lambda 25 UV–VIS spec-
trophotometer. For evaluating the gas sensing properties of these
films, a known concentration of ammonia gas (3N purity, sup-
plied by M/s Chemtron Industries, Mumbai) was purged into a test
chamber (made up of steel) kept at room temperature, by using
micro-syringe. Thegas sensing behaviour oftheas-grown films was
determined by measuring the current–voltage (I–V), characteristics
in absence/presence ofNH
3
gas,anddata was recorded online,using
a computer interfaced with the system.
3. Results and discussion
3.1. Reaction mechanism
Variation in pH and temperature of reaction bath with respect to
time for both cases, i.e., for bath containing tin oxide nanoparticles
Fig. 1. Reaction kinetics for (a) polyaniline and (b) tin oxide/polyaniline nanocom-
posite.
78 N.G. Deshpande et al. / Sensors and Actuators B 138 (2009) 76–84
suspension and without it, is shown in Fig. 1a and b. It may be seen
that during the induction period (starting time of about 2–3 min),
small change in bath temperature noticed, but subsequently a pro-
nounced increase in bath temperature follows, indicating a faster
film growth rate, and mainly due to the exothermic nature of aniline
polymerization.
A simple explanation to describe such a process may be follow-
ing. The cation radicals, as the primary intermediates of aniline
oxidation, are produced in the homogeneous aqueous medium and
a fraction of them is adsorbed at available surfaces sites in random
way, as allowed by thermo-dynamical state of the system. These
sites initiate growth of future PANI chains, in which the monomer
molecules join (with such chains) and in the process give out their
own kinetic energy (of free monomer state) to the system. This
transfer of energy apparently raises the temperature of the bath
by an equivalent amount, and observed during the process of poly-
merization (Fig. 1a and b).
The heterogeneous catalytic film growth requires formation of
initial seeding on the fresh substrate. In the reaction bath without a
substrate into it, aniline monomers are in random thermo-dynamic
state, and depending upon thermo-chemical conditions can join
with each other to form small size (2 and higher monomer units)
polymer molecules(such as dimer, trimer,etc.) known asoligomers.
In normal conditions, the reverse of this process, i.e., the breaking
of oligomers into smaller units also goes on simultaneously in the
reaction bath, at about similar rate. At a fresh surface (based on its
electro-phobic or electro-philic nature), the reactivity of adsorbed
entities (monomer and oligomers) can be substantially enhanced
compared with free species, allowing a relatively larger probability
of surface attachment [25]. Once initial nucleation takes place on
the fresh surface, the activation energy for the next layers (steps)
in the polymerization slowly decrease as number of steps increase.
Finally, after some time there is no net growth of the film when
equilibrium between the joining rate and detaching rate become
almost equal.
The polymerization at the surface, producing a PANI film, and
the polymerization in the bulk, giving rise to a PANI precipitate,
proceed in succession, the former having relatively larger rates in
the start, but after some finite time it equals with the latter. How-
ever, when tin oxide nanoparticles are also present in the reaction
bath, these SnO
2
particles impede the growth rate of the PANI film,
and we see different times for the induction, and oxidative poly-
merization periods. Similarly the pH, and the temperature of the
bath are also different for above two cases. Therefore, tin oxide
composite film formation should take somewhat larger time, and
indeed we observed this difference experimentally as shown in
Fig. 1a and b. It was found that for PANI reaction to occur the
induction time was about 2 min, polymerization time was about
5 min, the maximum temperature evolved was 39.4
◦
C and pH
was ∼1.17. In case of tin oxide-intercalated polyaniline reaction to
occur the induction time was 2 min 40 s, polymerization time was
8 min, maximum temperature was 34.9
◦
C and pH was 1.01.
3.2. Structural analysis
The XRD patterns for tin oxide, PANI and tin oxide/PANI
nanocomposites, are shown in Fig. 2a–c, respectively. Fig. 2a reveals
that the material deposited is SnO
2
of polycrystalline in nature.
On comparing the observed XRD peaks and corresponding planes
with the standard (hkl) planes a good matching was seen between
the two sets, confirming that the deposited films consist of SnO
2
having primitive tetragonal structure (JCPDS DATA CARD 41-1445).
The XRD pattern for tin oxide thin films showed diffraction peaks
along (1 10), (1 01), (2 0 0), (2 1 1), (3 1 0) and (3 0 1), respectively.
The films were preferentially oriented along (20 0) plane. The aver-
age value of lattice parameters was found to be a =b = 4.755 Å and
Fig. 2. XRD patterns for (a) tin oxide, (b) polyaniline and (c) tin oxide/polyaniline
nanocomposite.
c =3.205Å, while the standard bulk value for tin oxide crystalline
structure is respectively, a =b= 4.738 Å and c =3.187 Å. This suggests
that the tin oxide grains in thin film form are strained, may be due
to the smaller average physical size of the grains themselves. The
average crystallite size found using the standard Scherer’s formula
was equal to 40 nm. Fig. 2b shows the XRD pattern for PANI films,
which suggests that the film has amorphous structure. Fig. 2cis
the XRD patterns for tin oxide intercalated in the PANI matrix, and
one can see the presence of peaks corresponding to tin oxide nano-
crystallites. However, these peaks are slightly shifted, from their
respective standard positions, may be due presence of PANI matrix.
In addition, we observed reduced intensity of the peaks, and rela-
tively larger peak broadening, compared with XRD of pure SnO
2
film. This indicates still smaller average size of tin oxide nano-
crystallites in composite film, compared that for pure SnO
2
film.
The lattice constant was found to be a =b = 4.716 Å and c = 3.24 Å;
while the average crystallite size was found to be nearly 23 nm. The
(2 00) peak of tin oxide is seen in XRD of composite material shown
in Fig. 2c, along with some other peaks. However, intensity of (3 0 1)
peak is suppressed in the composite film compared to XRD of pure
tin oxide. This suggests that tin oxide is present in the PANI matrix,
and presence of PANI has influenced the preferred orientation of
tin oxide grains in the film to some extent.
3.3. Fourier transform infrared analysis
In order to find the nature of bonding in the film material we
studied FTIR spectrum of tin oxide/PANI precipitate. Fig. 3 shows
the FTIR spectrum for SnO
2
/PANI nanocomposites, having peaks at
wave numbers 1579, 1490, 1446, 1288, 1367, 1160, and 738 cm
−1
,
N.G. Deshpande et al. / Sensors and Actuators B 138 (2009) 76–84 79
Fig. 3. FTIR spectrum for tin oxide/polyaniline nanocomposite.
respectively. These peaks correspond to most of the characteris-
tic peaks for PANI, as described in literature [26,27]. The peaks
at wave numbers 1579 and 1490 cm
−1
are attributed to C N and
C
C stretching mode for the quinoid and benzenoid rings; while
the peak at wave number 1446 cm
−1
is attributed to C–C aromatic
ring stretching of the benzenoid diamine unit. The peaks at wave
numbers 1288 and 1367 cm
−1
are attributed to C–N stretching; and
peak at wave number 1160 cm
−1
is considered to be due to N Q N
stretching. The peak at the wave number 738 cm
−1
is attributed
to C–H out of plane bending vibrations. However it may be noted
that these peaks are slightly shifted with respect to their normal
positions as seen for pure PANI films. Once again these peak shift-
ings might be due to the presence of tin oxide in the PANI matrix.
Furthermore, we observed a strong peak at wave number 615 cm
−1
,
which is dueto the antisymmetric Sn–O–Snmode in SnO
2
as shown
in literature [28–30], and in a way confirms presence of tin oxide
in the PANI matrix. Dutta and De [28] have observed similar results
for tin oxide/PANI nanocomposites.
3.4. Surface morphological analysis
The SEM micrographs of as-grown films of tin oxide, polyani-
line and tin oxide/PANI nanocomposites, are shown in Fig. 4a–c,
respectively. The SEM profile shown in Fig. 4a, indicates fine gran-
ular surface of tin oxide, covering the entire glass substrate, with
some agglomeration of finer particulates to form bigger clusters.
Such agglomerations result in case of metal oxide films deposited
by chemical methods [31,32]. The average grain size was ∼120 nm.
In case of pure PANI, the film growth appears to be of dendritic
nature, with some part of it having growth of amorphous phase
(Fig. 4b). In case of tin oxide/PANI nanocomposites films (Fig. 4c),
Fig. 4. FESEM micrographs for (a) tin oxide, (b) polyaniline and (c) tin
oxide/polyaniline nanocomposite (inset is a high-resolution magnified image of
nanocomposite).
the composite particles are highly dispersed, with less amount of
agglomeration. The average grain size was ∼80 nm, with dispersion
of ±5 nm. The observed difference in the measurement of the grain
size by XRD and SEM would be due to the fact that two or more
Fig. 5. Schematic diagram of the formation of tin oxide/polyaniline nanocomposite thin films.
80 N.G. Deshpande et al. / Sensors and Actuators B 138 (2009) 76–84
crystallites may be fused together to form a particle (not resolved
by SEM profile, but XRD can figure out easily) [33,34].
The grain growth of nanoparticles in such films may be
understood through two basic mechanisms of aggregation. These
mechanisms depend on the dispersion of colloidal particles at low-
solid volume fractions (ϕ
0
→ 0) having with
(a) diffusion-limited cluster aggregation (DLCA), and
(b) reaction-limited cluster aggregation (RLCA).
In DLCA every collision between two clusters results in the for-
mation of a new cluster, the aggregate of the two colliding clusters.
In RLCA only a small fraction of all the collisions leads to the forma-
tion of a new aggregate [35].InFig. 5, a simple schematic is shown,
which provides reaction mechanism for formation of such kind of
structures. In the present case, formation of polymer shell around
the nano-crystalline particle/s can easily be seen in the magnified
image inset of Fig. 4c, assisting the growth and further aggre-
gates formation indicating a DLCA type mechanism; but it appears
that for SnO
2
/PANI film formation, the RLCA mechanism preferably
dominates. This is because, the reaction kinetics as reflected from
Fig. 1a andb,show arelatively lower temperature of polymerization
at low-pH values, and gives rise to limited aggregation. Secondly,
the final thickness of the film is limited to around less than 200 nm.
In contrast tothis,with theDLCA mode, amuch larger filmthickness
can be achieved, but not observed by us.
The concentration of surface states has correlation with the
roughness and grain size via the surface-to-volume ratio, and the
gas sensitivity has a proportional relationship with the film rough-
ness. In order to study the surface roughness, the film samples were
characterized using AFM. Fig. 6a–c show respective AFM profiles
for tin oxide, PANI and SnO
2
/PANI nanocomposites. The rms sur-
face roughness was found to be 46.1, 22.7 and 31.5 nm for tin oxide,
PANI and SnO
2
/PANI nanocomposites, respectively. Notice that the
surface roughness of nanocomposites films 31.5 nm, is in between
that of the pure tin oxide and pure PANI films.
3.5. Optical analysis
In case of conducting polymers, optical spectroscopy is an
important technique to understand the conducting states corre-
sponding to the absorption bands of inter-gap and intra-gap states
[36]. Usually PANI-HCl shows three characteristic peaks of absorp-
tion in wavelength bands 306–324, 402–420 and 828–835 nm,
respectively. The peak in wavelength band 306–324 nm is due to
the –
*
transition of benzenoid ring; the peakofwavelength band
402–420 nm, is due to the polaron–
*
transition and the peak in
wavelength band 828–835nm, is attributed to the –polaron tran-
sition. In addition, the peaks in wavelength bands 402–420 and
828–835 nm, arise owing to the doping level and the formation of
polarons [37–39].InFig. 7, we show optical absorbancewith respect
to wavelength, for pure PANI and tin oxide/PANI nanocomposite
thin films. The observed absorption peak positions in present case
were found at ∼324, ∼430, and ∼828 nm, for pure PANI; whereas in
case of tin oxide/PANI nanocomposites these peaks were at ∼303,
∼430, and ∼800 nm, respectively. It is interesting to note that the
characteristic peaks of the doped PANI appear in the SnO
2
/PANI
nanocomposite thin films, but with some shift in their positions
(especially for 324 and 828 nm peaks) compared with the pure film.
Such shifts in the characteristic peak positions of one or both of the
composite forming species are related with surface modifications,
and similar shift of peak positions in CdS/PANI nanocomposites
films, has been observed by Pethkar et al. [14]. In addition, there is
an increase inthe absorptionat lowerwavelengths inthe SnO
2
/PANI
nanocomposites case. This is characteristic property of oxides, indi-
cating the presence of tin oxide.
Fig. 6. AFM images for (a) tin oxide, (b) polyaniline and (c) tin oxide/polyaniline
nanocomposites.
3.6. Gas sensor analysis
The as-grown films of tin oxide, polyaniline, and SnO
2
/PANI
composites were tested for ammonia gas at room temperature. For
this films having metallic contacts were kept in the test chamber
of known volume with electrical leads taken out for electrical mea-
surements. A fixed amount (corresponding to 100 ppm) of NH
3
gas
was injected into the test chamber, and film resistance measured
with respect to time (for every 10 s interval), until it reached a
steady value. This procedure was followed once again after remov-
N.G. Deshpande et al. / Sensors and Actuators B 138 (2009) 76–84 81
Fig. 7. Optical absorbance versus wavelength for tin oxide/polyaniline nanocom-
posites.
ing NH
3
and exposing the test chamber to clean air. These steps
were repeated for all three different films and for different NH
3
gas concentrations (100–500 ppm). In Fig. 8a–c, we show typical
current–voltage characteristics taken for pure tin oxide, pure PANI,
and the SnO
2
/PANI composite films kept at room temperature (RT),
respectively. It is seen from Fig. 8a that no appreciable change
noticed in the film resistance for the case of pure tin oxide film, on
exposure to different concentrations of NH
3
gas, and tin oxide films
remained insensitive to this gas at RT. However, in case of pure PANI
films (Fig. 8b), we see large changes in the film resistance on NH
3
gas exposure. The filmresistance increases by more than an order of
magnitude from its original value within a minute, indicating that
the electrical resistance of PANI films is a sensitive parameter in the
presence of ammonia gas, as reported earlier in literature [40,41].
The I–V characteristics of the composite films show a different but
more interesting phenomenon as may be seen from Fig. 8c, that
the composite SnO
2
/PANI film resistance decreases on exposure to
ammonia (∼300 ppm). Furthermore, the I–V characteristics of com-
posite SnO
2
/PANI films show a diode-like exponential behaviour,
a characteristic of percolation in disordered systems, wherein the
electrical conductance is through hopping mechanism. Kukla et al.
[41] proposed that the sensitivity and reversibility of pure PANI lay-
ers to NH
3
gas exposure is a deprotonation–reprotonation process,
and the film resistance show an exponential rise with increase in
NH
3
concentration, this mechanism seems to fit with our obser-
vations. However, the decrease in resistance of composite film on
exposure to ammonia gas needs further explanation.
It is well known that tin oxide is an n-type semiconductor, while
PANI films are normally of p-type semiconductor. This is due to the
fact that duringthe polymerization process of aniline, acids(such as
HCl) are used, which acts as dopant for PANI molecules, and usually
bound with the central N atom of aniline (monomer) molecule, like
H
+
N Cl
−
(other bonds on sides of N atom are left here for want
of clarity, and more details are provided in literature, see Fig. 4 of
Ref. [41]). In equilibrium at room temperature, the positive charge
of bonded hydrogen shifts on N atom, making the structure looks
like H
N
+
Cl
−
. While the negative charge on Cl
−
is retained with
it and remains localized, the positive charge on nitrogen becomes
mobile charge in PANI matrix, via its other bonds, making the PANI
as a p-type semiconductor [41].
In presence of SnO
2
crystallites, the PANI matrix gets a modified
structure electronically. The PANI molecules encapsulate each SnO
2
crystallite, similarly to Fig. 5. The SnO
2
crystallites being an n-type
Fig. 8. I–V curves (in the presence of ammonia gas) for (a) tin oxide, (b) polyaniline
and (c) tin oxide/polyaniline nanocomposites.
surrounded by p-type PANI molecules make a p–n junction like
formation locally, immersed within PANI matrix of the composite
film. The n-type nature of SnO
2
crystallites annihilate the holes of
PANI molecules, near its boundary making a depletion layer like
region, which in turn makes the overall PANI matrix electrically
more insulating in nature.
A tentative explanation of change in electrical resistance of com-
posite film may be following. On exposing the composite film with
ammonia (which can be permeated into the PANI matrix freely),
some of the NH
3
molecules might reach into the depletion region,
which is surrounding the SnO
2
crystallite and act as a dielectric
82 N.G. Deshpande et al. / Sensors and Actuators B 138 (2009) 76–84
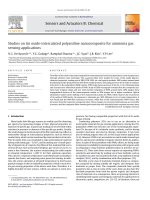
Fig. 9. Sensitivity versus concentration plot for tin oxide, polyaniline and tin
oxide/polyaniline nanocomposites.
betweenthePANI and SnO
2
border. Thedepletion region fieldmight
polarize the ammonia molecules, and in turn provide a positive
charge to PANI molecules, which can become mobile on its transfer
to the central N atom of PANI molecule. So in all this process cre-
ates somefree holeson PANI molecules, which increasethehopping
conductivity of the film, and therefore make the composite film rel-
atively more conducting electrically. Once the process of polarizing
the ammonia moleculesby p–n junctionlike formation issaturated,
this mechanism cannot generate additional holes in the composite
PANI film and therefore no additional change in the film conductiv-
ity even by further additionof ammonia to it. Inthe present casethis
saturation happened at around 300 ppm, as seen in Fig. 9. However,
it may be noted that ammonia gas within PANI regions of the com-
posite film, opens up another channel parallel to above mechanism
always present in case of pure PANI films, making them more resis-
tive on gas exposure. In this channel, ammonia molecules exchange
the mobile hole charge with central N atom of PANI molecule and
make it localized. This reduces the conductivity of the film, as found
in caseof purePANIfilms. So onexposurewith ammonia, both of the
channels compete with each other, and the dominating channels
dictate the direction of net change in resistance of the composite
film.
Sensitivity (S%) is defined as the relative variation of the
resistance of the sensitive film in percent per ppm of applied
gas concentration, i.e., (|Rgas − Rair|/Á·Rair) × 100, whereas gas
response is defined as |Rgas − Rair|/Rair, ‘Rair’ is the resistance of
sensor in air, ‘Rgas’ is the steady resistance of sensor in the pres-
ence of a test gas and ‘Á’ is the concentration of gas (in ppm). In
Fig. 9, we show sensitivity (S%) of pure tin oxide, pure PANI, and
the tin oxide/PANI nanacomposite film, on exposure to ammonia
for different concentrations (100–500 ppm). For the case of pure
tin oxide film, no response found (i.e., having response value 1, or
no change in film resistance) within explored range. However, for
purePANIfilms theresponse value increaseslinearly upto 300 ppm,
and saturate thereafter or slightly decrease for larger ammonia gas
concentrations. In case of SnO
2
/PANI nanocomposite film, a smooth
increase of response was seen up to 300 ppm, and it remains same
thereafter. It can be seen that at 300 ppm concentration of ammo-
nia gas, both pure PANI, and SnO
2
/PANI composite films hadhighest
response.
We also studied response and recovery time of the films with
respectto ammoniagas exposure. Theresponse time,and the recov-
ery time are defined as the time required for a film resistance to
Fig. 10. Sensing reproducibility and reversibility curves for (a) polyaniline and (b)
tin oxide/polyaniline nanocomposites.
reach 90% of its saturation value from the starting value on gas
exposure, and on removal of the gas, respectively. In our case, the
PANI films had relatively faster response times ∼8–10 s, but as usual
the recovery times were relatively larger, around 160s. Notice that
the larger recovery times are due to the slower out diffusion rate
(concentration dependent) of the gas, which always decreases as
time progress. Furthermore, these diffusion rates are small at room
temperature. The SnO
2
/PANI nanocomposites films have response
times of 12–15 s, and the recovery times around 80 s. It may be seen
that the SnO
2
/PANI nanocomposites films showed faster recovery
time (a factor of 2) as compared to the PANI films. In Fig. 10a and
b, we show typical response of the film with respect to time, for
repeated exposure and removal of ammonia (300 ppm) gas, and it
may be seen that both PANI and SnO
2
/PANI nanocomposites films
showed goodreproducible resistance changefor a numberof cycles.
4. Conclusions
We synthesized tin oxide-intercalated polyaniline nanocompos-
ites (SnO
2
/PANI) in thin film form, and compared the properties
of the composite films with that of the thin films made from the
constituent base materials. XRD studies were used to find particu-
late size, while FTIR study showed presence of both SnO
2
and PANI
molecules. SEM micrograph of these nanocomposite films revealed
that the constituent composite particles have irregular shape and
size, and encapsulated by fibrous PANI matrix. It was found that
N.G. Deshpande et al. / Sensors and Actuators B 138 (2009) 76–84 83
pure SnO
2
films remain inert on NH
3
gas exposure at RT. However,
presence ofSnO
2
crystallites inthe nanocomposites SnO
2
/PANI film
changesthe electronicproperty ofPANImatrix in drastic way. While
pure PANI films become more resistive on exposure to NH
3
gas, the
composite film becomes less resistive on a similar exposure. We
have provided a suitable explanation for such behaviour of these
films. These SnO
2
/PANI nanocomposites films showed good sensi-
tivity, reproducibility with relatively faster response for ammonia
gas, at room temperature. In addition, the nanocomposites films
showed faster recovery time (twice) as compared with the PANI
films. However, there are still many other issues pertaining to gas
sensing activity which need more attention, such as long-term sta-
bility, selectivity with specific gas, etc. and need further research in
this field.
Acknowledgments
We are thankful to BRNS-DAE Project No. 2005/34/1/BRNS/380
for financial assistance to carry out the research work. We are
also thankful to Head, Department of Physics, Dr. B.A.M. Univer-
sity, Aurangabad for providing the lab facilities. In addition, we
highly acknowledge the help rendered by Dr. R.S. Devan and Prof. Y.
Ma, Department of Physics, National Dong Hwa University, Taiwan
for doing SEM characterization of our samples as well as help-
ful discussions. Authors especially, N.G. Deshpande (currently), J.B.
Kim and Y.P. Lee were supported by the KOSEF through Quan-
tum Photonic Science Research Center, Seoul, Korea, and by MEST,
Korea.
References
[1] M.J. Madou, S.Y. Morison, Chemical Sensing with Solid State Devices, Academic
Press, San Diego, 1989.
[2] N. Barsan, U. Weimar, Understanding thefundamental principles of metal oxide
based gas sensors; the example of CO sensingwith SnO
2
sensors inthe presence
of humidity, J. Phys. Condens. Matter 15 (2003) R813–R839.
[3] M. Gratzel, Photoelectrochemical cells, Nature 414 (2001) 338–344.
[4] A.G. MacDiarmid, Synthetic metals: a novel role for organic polymers (nobel
lecture), Angew. Chem. Int. Ed. 40 (2001) 2581–2590.
[5] A.G. MacDiarmid, A.N. Xia, J.M. Wiesinger, Electrically Active Polymers, US Pat.
5,773,568, 1998.
[6] Y.S. Negi, P.V. Adhyapak, Development in polyaniline conducting polymers, J.
Macromol. Sci. Polym. Rev. 42 (2002) 35–53.
[7] G.G. Wallace, G.M. Spinks, A.P. Kane-Maguire, P.R. Tesdale, Conductive Elec-
troactive Polymers: Intelligent Materials Systems, CRC Press, 2002.
[8] J. Huang, S. Viriji, B.H. Weiller, R.B. Kaner, Nanostructured polyaniline sensors,
Chem. Eur. J. 10 (2004) 1314–1319.
[9] J. Huang, R.B. Kaner, The intrinsic nanofibrillar morphology of polyaniline,
Chem. Commun. 4 (2006) 367–376.
[10] H.S. Li, M. Josowicz, D.R. Baer, M.H. Engelhard, J. Janata, Preparation and char-
acterization of polyaniline–palladium composite films, J. Electrochem. Soc. 142
(1995) 798–805.
[11] A.A. Athawale, S.V. Bhagwat, P.P. Katre, Nanocomposite of Pd–polyaniline as a
selective methanol sensor, Sens. Actuat. B 114 (2006) 263–267.
[12] S.T. McGovern, G.M. Spinks, G.G. Wallace, Micro-humidity sensors based on a
processable polyaniline blend, Sens. Actuat. B 107 (2005) 657–665.
[13] S.J. Su, N. Kuramoto, Processable polyaniline–titanium dioxide nanocompos-
ites: effect of titanium dioxide on the conductivity, Synth. Met. 114 (2000)
147–153.
[14] S.Pethkar, R.C.Patil,J.A. Kher,K. Vijaymohanan,Deposition andcharacterization
of CdS nanoparticle/polyaniline composite films, Thin Solid Films 349 (1999)
105–109.
[15] K.R. Reddy, K.P. Lee, A.I. Gopalan, Self-assembly approach for the synthesis of
electro-magnetic functionalized Fe
3
O
4
/polyaniline nanocomposites: effect of
dopant onthe properties, Colloid Surf. A: Physicochem. Eng. Aspects 320 (2008)
49–56.
[16] J. Wang, I. Matsubara, N. Murayama, S. Woosuck, N. Izu, The preparation of
polyaniline intercalated MoO
3
thin film and its sensitivity to volatile organic
compounds, Thin Solid Films 514 (2006) 329–333.
[17] T. Taka, Humidity dependency of electrical conductivity of doped polyaniline,
Synth. Met. 57 (1993) 5014–5019.
[18] S.S. Joshi, T.P. Gujar, V.R. Shinde, C.D. Lokhande, Fabrication of n-CdTe/p-
polyaniline heterojunction-based room temperature LPG sensor, Sens. Actuat.
B 132 (2008) 349–355.
[19] M.K. Ram, O. Yavuz, M. Aldissi, NO
2
gas sensingbased on ordered ultrathin films
of conducting polymer and its nanocomposites, Synth. Met. 151 (2005) 77–84.
[20] L. Geng, Y. Zhao, X. Huang, S. Wang, S. Zhang, S. Wu, Characterization and gas
sensitivitystudy of polyaniline/SnO
2
hybridmaterial prepared by hydrothermal
route, Sens. Actuat. B 120 (2007) 568–572.
[21] Y. Fu, R.L. Elsenbaumer, Thermochemistry and kinetics of chemical polymer-
ization of aniline determined by solution calorimetry, Chem. Mater. 6 (1994)
671–677.
[22] T. Sulimenko, J. Stejskal, J. Proke
ˇ
s, Poly(phenylenediamine) dispersions, J. Col-
loid Interf. Sci. 236 (2001) 328–334.
[23] Y. Fong, J.B. Schlenoff, Polymerization ofaniline using mixed oxidizers, Polymer
36 (1995) 639–643.
[24] P.M. Beadle, Y.F. Nicolau, E. Banka, P. Rannou, D. Djurado, Controlled polymer-
ization of aniline at sub-zero temperatures, Synth. Met. 95 (1998) 29–45.
[25] P.W. Atkins, Physical Chemistry, 3rd ed., Oxford University Press, Oxford, 1986,
pp. 762–789.
[26] T. Abdiryim, Z.X. Gang, R. Jamal, Comparative studies of solid-state synthesized
polyaniline doped with inorganic acids, Mater. Chem. Phys. 90 (2005) 367–372.
[27] S. Quillard, G. Louarn, S. Lefrant, A.G. MacDiarmid, Vibrational analysis of
polyaniline: a comparative study of leucoemeraldine, emeraldine, and perni-
graniline bases, Phys. Rev. B 50 (1994) 12496–12508.
[28] K. Dutta,S.K. De, Optical andnonlinear electrical properties of SnO
2
–polyaniline
nanocomposites, Mater. Lett. 61 (2007) 4967–4971.
[29] G. Zhong, M. Liu, Preparation of nanostructured tin oxide using a sol–gel pro-
cess based on tin tetrachloride and ethylene glycol, J. Mater. Sci. 34 (1999)
3213–3219.
[30] S. Monredon, A. Cellot, F. Ribot, C. Sanchez, L. Armelao, L. Gueneau, L. Delattre,
Synthesis and characterization of crystalline tin oxide nanoparticles, J. Mater.
Chem. 12 (2002) 2396–2400.
[31] T.P. Niesenand, M.R. De Guire, Review: deposition of ceramic thin films at low
temperatures from aqueous solutions, J. Electroceram. 6 (2001) 169–207.
[32] G. Korotcenkov, V. Tolstoy, J. Schwank, Successive ionic layer deposition (SILD)
as a new sensor technology: synthesis and modification of metal oxides, Meas.
Sci. Technol. 17 (2006) 1861–1869.
[33] D.S. Sutrave, G.S. Shahane, V.B. Patil, L.P. Deshmukh, Micro-crystallographic and
optical studies onCd
1−x
Zn
x
Se thinfilms,Mater. Chem. Phys. 65(2000) 298–305.
[34] C.M. Shen, X.G. Zhang, H.L. Li, Influence of different deposition potentials on
morphology and structure of CdSe films, Appl. Surf. Sci. 240 (2005) 34–41.
[35] P. Sandkuhler, J. Sefcik, M. Morbidelli, Kinetics of gel formation in dilute dis-
persions with strong attractive particle interactions, Adv. Colloid Interf. Sci.
108–109 (2004) 133–143.
[36] M.K. Ram, O. Yavuz, V. Lahsangah, M. Aldissi, CO gas sensing from ultrathin
nano-composite conducting polymer film, Sens. Actuat. B 106 (2005) 750–757.
[37] A.G. Macdiarmid, A.J. Epstein, The concept of secondary doping as applied to
polyaniline, Synth. Met. 65 (1994) 103–116.
[38] H. Jiang,Y. Geng,J.Li, F.Wang, Organic aciddoped polyaniline derivatives, Synth.
Met. 84 (1997) 125–126.
[39] B.J. Kim, S.G.Oh, M.G.Han, S.S. Im, Synthesis and characterization ofpolyaniline
nanoparticles in SDS micellar solutions, Synth. Met. 122 (2001) 297–304.
[40] D.S. Sutar, N. Padma, D.K. Aswal, S.K. Deshpande, S.K. Gupta, J.V. Yakhmi, Prepa-
ration of nanofibrous polyaniline films and their application as ammonia gas
sensor, Sens. Actuat. B 128 (2007) 286–292.
[41] A.L. Kukla, Y.M. Shirshov, S.A. Piletsky, Ammonia sensors based on sensitive
polyaniline films, Sens. Actuat. B 37 (1996) 135–140.
Biographies
Mr. N.G. Deshpande is currently working for his PhD degree (from 2008) in Depart-
ment of Physics, Hanyang University, Seoul, South Korea under the supervision
of Prof. YoungPak Lee. Current interest of research work is 1D and 2D magnetic
photonic crystals and their applications. Earlier worked as Senior Research Fellow
(SRF) in BRNS-DAE project related to oxides, polymers and hybrid materials for
gas sensor application (2005–2008). He published nearly 18 international research
papers and attended/presented (research work) at various international/national
conferences.
Mr Y.G. Gudage is currently working for his PhD degree (from 2006) in Depart-
ment of Physics, Dr. B.A. Marathwada Univeristy, Aurangabad (M.S.), India under the
supervision of Dr. Ramphal Sharma. Current research interest is photoelectrochem-
ical solar cells. He worked as Senior Research Fellow (SRF) in BRNS-DAE project on
gas sensor applications. He has published nearly 12 international research papers
and attended various conferences.
Dr. Ramphal Sharma received his PhD in 1991 from Rajasthan University, Jaipur,
India. Currently, he is Associate Professor at Department of Physics, Dr. B.A.M. Uni-
versity, Aurangabad (M.S.), India. Currently, he is a Brain Pool Fellow in Department
of Chemistry, Hanyang University, Seoul, Korea. He has more than 15 years of expe-
rience in teaching field; while 20 years of experience in research, i.e., in thin film
technology. He has published more than 80 international and national papers in
reputed journals. His main interest of research is gas sensor, photosensor and solar
cells. He was visiting fellow of ICTP, Trieste, Italy in 1999–2001.
Dr. J.C. Vyas postgraduated in Physics from University of Rajasthan, Jaipur, and
received PhD from Bombay University, Mumbai. He joined BARC in 1980, and over
years worked in several different fields of technical interests, such as fabrication
of space quality Si solar cells, growth and characterization of non-linear optical
84 N.G. Deshpande et al. / Sensors and Actuators B 138 (2009) 76–84
single crystals, oriented thin films growth using MBE and their characterization,
high-temperature superconducting thin films based weak links for device applica-
tions, and thin film based gas sensors. He is a member of Indian Thermal Analysis
Society, Material Research Society of India, etc.
Mr. JinBae Kim received his BS and MS degrees in Department of Physics of
Sunmoon University, Korea, in 2000 and 2002, respectively. He has been a PhD
candidate in Department of Physics from Hanyang University from 2002. He is cur-
rently focused on the physics and applications of magnetic nanostructures and
magnetic photonic crystals. He has published nearly 20 papers in international
journals and attended/presented his work at various reputed international/national
conferences.
Prof. YoungPak Lee is currently Director of Quantum Photonic Science Research
Center and Distinguished Professor in Department of Physics, Hanyang University,
Seoul, Korea. He received his PhD degree in Condensed-Matter Physics, Iowa State
University, Ames, Iowa, U.S.A. (1987). Besides this he has worked at various reputed
posts and has been awarded many honors from Ministry of Science and Technology,
Korea and others. His research interest is magnetic photonic crystals, meta-materials,
nanomagnetism.