- Trang chủ >>
- Khoa Học Tự Nhiên >>
- Vật lý
TiO2nanotubes and CNT–TiO2hybrid materials for the photocatalytic oxidation ofpropene at low concentration
Bạn đang xem bản rút gọn của tài liệu. Xem và tải ngay bản đầy đủ của tài liệu tại đây (606.4 KB, 7 trang )
TiO
2
nanotubes and CNT–TiO
2
hybrid materials for the photocatalytic oxidation of
propene at low concentration
N. Bouazza
a
, M. Ouzzine
a
, M.A. Lillo-Ro
´
denas
a,
*
, D. Eder
b
, A. Linares-Solano
a
a
Grupo de Materiales Carbonosos y Medio Ambiente, Dpto. Quı
´
mica Inorga
´
nica, Facultad de Ciencias, Universidad de Alicante, Ap. 99, E-03080, Alicante, Spain
b
Department of Materials Science and Metallurgy, University of Cambridge, New Museums Site, Pembroke Street, Cambridge CB23QZ, UK
1. Introduction
In the last decade, the synthesis of nanostructured TiO
2
materials has received a great deal of attention. Three approaches
have been reported for the preparation of TiO
2
-nanotube
materials: the hydrothermal synthesis [1–7], the anodic oxidation
[8–11] and the template synthesis [12–17]. The advantage of the
template-based synthesis route is the straightforward control over
the morphology of the resulting TiO
2
nanotubes. For instance, the
initial dimensions of carbon nanotubes (CNTs) determine both,
diameter and length of the TiO
2
nanotubes, while the TiO
2
nanotube wall thickness depends on the type and initial
concentration of the Ti precursor with respect to the CNTs [15].
The use of CNTs as a template was further significant as they can
also support the tubular morphology of TiO
2
during the phase
transformation from anatase to rutile, resulting in the first
synthesis of pure rutile nanotubes [16]. A significant innovation
was the addition of small amounts of benzyl alcohol as a linking
agent, which enabled the use of pristine CNTs as templates without
the need for covalent functionalisation [17].
The last few years have seen a boost in interest in TiO
2
nanotubes, due to their improved performance as photocatalysts in
heterogeneous photocatalysis [2,7,11,18–22]. However, most of
these studies have been devoted to photocatalysis in solution and
only the work of Inagaki et al. deals with gaseous phase oxidation
[22]. According to some authors, the advantages of TiO
2
nanotubes
are solely based on their high surface areas [2,18,19,23]. Other
authors showed that TiO
2
nanotubes contain a high amount of
hydroxyl groups in comparison with TiO
2
in the form of powder
[6,24]. In general, nanotubes have a particular advantage in the
way they enable three-dimensional mechanically coherent struc-
tures, which provide ready gas and radiation access to the material
[14]. For example, Macak et al. [20] demonstrated that TiO
2
nanotubes showed higher photocatalytic activity than P25, despite
their smaller surface area. Eder et al. investigated anatase
nanotubes, both pure and doped with iron ions, for the
photocatalytic splitting of water and observed that – in contrast
to the inactive P25 – the TiO
2
nanotubes did produce a significant
amount of hydrogen [21]. Both authors related this improvement
to the structure of the TiO
2
nanotubes, which favours short
diffusion paths of the pollutant molecules and, in addition, also
decreases the electron–hole pair recombination velocity.
Despite these promising studies, the photocatalytic perfor-
mance of TiO
2
nanotubes is far from completely understood. One
important question involves the phase composition of TiO
2
, which
Applied Catalysis B: Environmental 92 (2009) 377–383
ARTICLE INFO
Article history:
Received 7 April 2009
Received in revised form 4 August 2009
Accepted 22 August 2009
Available online 28 August 2009
Keywords:
Carbon nanotubes
TiO
2
Photocatalysis
Propene
ABSTRACT
In this work, we investigated titanium dioxide (TiO
2
) nanotubes and CNT–TiO
2
hybrid materials for the
photocatalytic oxidation (PCO) of propene at low concentration (100 ppmv) in gaseous phase. The
materials were prepared via sol–gel method using sacrificial multi-walled carbon nanotubes (CNT) as
templates and subsequent heat treatments to obtain the desired crystalline phase (anatase, rutile or a
mixture of both) and eventually to remove the carbon templat e. We also studied rutile nanotubes for the
first time and demonstrate that the activity strongly depends on the crystalline composition, follow ing
rutile < anatase < anatase/rutile mixture. The enhanced activity of the anatase–rutile mixture is
attributed to the decrease in the electron–hole pair recombination due to the multiphasic nature of the
particles. The key result of this work is the exceptional performance of the CNT–TiO
2
hybrid, which
yielded the highest observed photocatalytic activity. The improved performance is attributed to
synergistic effects due to the hybrid nature of the material, resulting in small anatase crystalline sizes
(CNT act as heat sinks) and a reduced electron–hole pair recombination rate (CNTs act as electron traps).
These results demonstrate the great potent ial of hybrid materials and stimulate further research on CNT-
inorganic hybrid materials in photocatalysis and related areas.
ß 2009 Elsevier B.V. All rights reserved.
* Corresponding author. Tel.: +34 965 909350; fax: +34 965 903454.
E-mail address: (M.A. Lillo-Ro
´
denas).
Contents lists available at ScienceDirect
Applied Catalysis B: Environmental
journal homepage: www.elsevier.com/locate/apcatb
0926-3373/$ – see front matter ß 2009 Elsevier B.V. All rights reserved.
doi:10.1016/j.apcatb.2009.08.017
has two main phases, anatase – typically formed upon synthesis –
and rutile, the thermodynamically stable phase. Due to the
synthesis conditions for rutile, which often require heat treatments
at elevated temperatures (e.g. >600 8C), the crystal sizes in rutile
are typically larger than in anatase, resulting in significantly
smaller specific surface areas. The rutile nanotubes used in this
work, however, have surface areas comparable with those of
anatase nanotubes, and thus are ideal candidates for photocata-
lytic testing.
The test reaction in this work is the photocatalytic oxidation of
volatile organic compounds (VOC) at low concentration, a very
important catalytic process, with the aim to reduce their harmful
effects for human health and environment. Among the different
VOCs, this work concentrates on propene, which is one of the major
sources of both outdoor (involved in vehicle emissions and in many
industrial applications, such as in petrochemical plants and
foundry operations) as well as of indoor (one of the principal
components of tobacco smoke) air pollution. So far, very few
studies have been reported on the photocatalytic oxidation (PCO)
of propene in gas phase using TiO
2
[25–28] and to the best of our
knowledge the performance of TiO
2
nanotubes has not been
explored at all for this application or, in general, for gaseous phase
applications.
In this respect, the novelty of this work is a detailed
investigation of various TiO
2
nanotubes, consisting of either pure
anatase or rutile, or of a mixture of anatase and rutile, for the
photocatalytic oxidation (PCO) of propene. Furthermore, this work
compares the best results obtained previously with hybrid TiO
2
catalysts (containing activated carbon [26] or MCM-41 [27]) with
CNT–TiO
2
hybrids, a very promising new class of functional
materials [29], and investigates the beneficial role of CNTs in
photocatalysis.
2. Experimental
2.1. Photocatalysts preparation
The TiO
2
nanotubes used in this work were synthesised via a
sol–gel process using sacrificial CNT as templates. Multi-walled
carbon nanotubes (CNTs) were prepared by a modified chemical
vapor deposition (CVD) process, using ferrocene as the catalyst
precursor and toluene as the feedstock. These reactants were
vaporised into a hydrogen/argon atmosphere at 760 8C. The
average outer diameter of the nanotubes was 70 nm and the
length was between 20 and 30
m
m, but can be controlled by
adjusting various process parameters. Prior to their use as a
template, amorphous carbon as well as residual iron catalyst
particles were removed by annealing the as-grown CNTs in argon
at 2000 8C for 5 h [29]. The synthesis of the CNT–TiO
2
hybrids and
the TiO
2
nanotubes is described in detail elsewhere [14,16].In
summary, it involves (I) the deposition of a layer of TiO
2
synthesised by means of the sol–gel method on CNTs with the
aid of benzyl alcohol as a linking agent, (II) heat treatment in argon
to obtain the desired crystalline phases, e.g. anatase (350 8C),
anatase–rutile mixture (550 8C) or rutile (700 8C), and (III) heat
treatment in air at 520 8C to remove the CNT templates.
2.2. Characterisation techniques
The porosity characterisation of the TiO
2
nanotubes was
performed by nitrogen adsorption at À196 8C, using an ASAP
2020 apparatus from Micromeritics. The specific surface area was
measured by N
2
adsorption according to Brunauer–Emmett–Teller
(BET).
X-ray powder diffraction was performed to characterise the
phase composition and crystal structure of the photocatalysts,
using a SEIFERT 2002 equipment as well as a Bruker D8 Advance
(40 kV/40 mA) with Cu K
a
(1.54 A
˚
) radiation. The scanning
velocity was 28/min, and the 2
u
range scanned ranged from 28
to 808. The percentages of anatase and rutile were determined by
using the intensities of the strongest peaks for anatase and rutile
following the equations [26]:
W
R
ð%Þ¼
A
R
0:8844A
A
þ A
R
 100 (1)
W
R
ð%ÞþW
A
ð%Þ¼100 (2)
where W
A
: composition percentage of anatase; W
R
: composition
percentage of rutile; A
A
: integrated intensity of the maximum
intensity peak of anatase (1 0 1); A
R
: integrated intensity of the
maximum intensity peak of rutile (1 1 0).
The crystalline sizes of the anatase and rutile phases were
determined by the Scherrer formula, using a K factor of 0.93:
B ¼
Kl
b
cos u
(3)
where B: crystalline size, in nm;
l
: wavelength for the radiation
used, which is 1.54056 A
˚
for Cu;
b
: full width at half maximum
intensity (FWHM);
u
: angle for the XRD maximum peak.
The morphology of the samples was characterised by (i)
scanning electron microscopy (SEM), using a JEOL 6340F FEG-SEM,
and (ii) transmission electron microscopy (TEM) using INCA
Energy TEM100 equipment from OXFORD instruments.
2.3. Experimental conditions for propene oxidation at low
concentration
The experimental system used in propene PCO tests was
designed in our laboratory. It consists of a quartz reactor (cut-
off < 200 nm) where the photocatalyst bed is placed on quartz
wool. The reactor is 50 mm height, its diameter is 20 mm and the
quartz wool support height is around 10 mm. An 8 W Philips UV
lamp is placed parallel to the quartz reactor, at around 1 cm. The
UV lamp radiation peak appears at 257.7 nm (UV-C). The
commercial reference of the lamp is TUV 8W FAM. The couple
quartz reactor-lamp is surrounded by a cylinder covered by tinfoil.
A scheme of this system is detailed elsewhere [26].
The weight of photocatalyst used in these experiments was
0.11 g for the TiO
2
nanotubes and, for comparison purposes, 0.16 g
of the CNT–TiO
2
sample were used, maintaining a similar weight of
TiO
2
. The photocatalysts were used for the oxidation of propene at
100 ppm in air at room temperature, 25 8C.
Different flow rates of the propene stream, 7.5, 30 and 60 ml/
min (STP), were tested. These flow rates were controlled by
automated mass flow-controllers (Brook Instruments).
After suitable calibrations, a mass spectrometer (Balzers,
Thermostar GSD 301 01) coupled to the outlet of the reactor
bed follows the evolution of the concentration of propene in the
outlet gas with time. The experiments were repeated at least two
times for checking reproducibility.
Propene conversion was calculated using the following
expression:
Propene conversion ð%Þ¼
C
initial C
3
H
6
À C
stationary C
3
H
6
C
initial C
3
H
6
 100
where C
initial C
3
H
6
is the initial propene concentration, 100 ppmv,
and C
stationary C
3
H
6
is the stationary propene concentration in the
photocatayst bed outlet gas when the UV is switched on.
The standard activity of different samples was determined by
using the following equation:
St: activity ¼
n
m Á t
N. Bouazza et al. /Applied Catalysis B: Environmental 92 (2009) 377–383
378
where St. activity: standard activity (mol/g min); n: moles of the
propene oxidised; m: mass of the TiO
2
-based sample (g); t:
reaction time (min).
The standard activity related to surface area for all samples
studied was determined by the following equation:
SAR
S
BET
¼
St: activity
S
BET
where SAR
S
BET
: standar activity related to surface area (mol/
m
2
min); St. activity: standard activity related (mol/g min); S
BET
:
surface area (m
2
/g).
The amount of CO
2
after the oxidation was quantified by mass
spectrometry, using a calibrated CO
2
-cylinder with a concentration
of 300 ppmv.
3. Results and discussion
3.1. Photocatalysts preparation and characterisation
3.1.1. Nomenclature
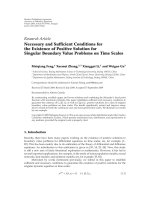
X-ray diffraction (XRD) analysis of the as-prepared samples
revealed that the TiO
2
coating on CNTs in the as-prepared samples
was amorphous and thus required heat treatments (shown in
Table 1) to induce crystallisation and phase transformation [15].
From the pristine material, several samples were prepared. The
first sample (CNT–TiO
2
) was simply obtained heating in argon at
350 8C, at which the amorphous phase crystallised into anatase
without removing the CNTs, as confirmed by XRD in Fig. 1. The
content of TiO
2
and CNTs of this hybrid sample is calculated to be
70% and 30% by weight, respectively.
Sample TiO
2
-NT1 was prepared from the pristine material by a
heat treatment in air at 520 8C to remove the carbon nanotubes.
By heating the sample in argon at higher temperatures, the
anatase was transformed into rutile either partially (at 550 8C) or
completely (at 700 8C). Sample TiO
2
-NT2 was prepared by heat
treatment in Ar at 550 8C followed by a heat treatment in air at
520 8C. Sample TiO
2
-NT3 was prepared by heat treatment in Ar at
700 8C followed by a heat treatment in air at 520 8C.
XRD analysis showed that the heat treatment in air at 520 8C,
required to remove the CNT template, did not affect the phase
composition of the samples (Fig. 1).
The temperatures of heat treatment in Ar used to prepare the
TiO
2
-NT2 and TiO
2
-NT3 samples were selected with the purpose of
studying the effect of the crystalline composition (anatase/rutile)
in the catalytic activity. In addition, the effect of the presence of the
carbon nanotubes in the CNT–TiO
2
hybrid has been analysed.
3.1.2. Crystalline phase characterisation
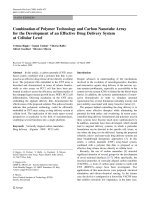
Fig. 1 shows the XRD pattern of the investigated samples and
reveals various crystal structures. The observed diffractions in
sample CNT–TiO
2
are typical for the anatase phase, and their
broadness suggests the presence of very small crystals. The peak at
a2
u
of 26.48 is typical for the 0 0 2 diffraction of graphite [30] and
confirms the presence of CNTs in the sample. Note, there are no
traces of rutile in this sample.
The TiO
2
-nanotube samples were heated in air at 520 8Cin
order to remove the CNT template, as confirmed by the absence of
the d-0 0 2 diffraction in the corresponding XRD pattern. Similar to
CNT–TiO
2
, sample TiO
2
-NT1 only shows the presence of anatase
crystals. Apparently, the heat evolution during the oxidation of
CNTs did not induce significant phase transformation. The peak
widths, however, are much smaller than those in sample CNT–
TiO
2
, indicating a significant grain growth. In contrast, samples
TiO
2
-NT2 and TiO
2
-NT3 were both heat-treated in argon at
elevated temperatures prior to the oxidation of CNTs. The
corresponding pattern shows diffractions typical for rutile. Heat
treatment at 550 8C converted the anatase phase only partially
(TiO
2
-NT2), while the TiO
2
-NT3 sample contained only the rutile
phase. For comparison, the reference sample Degussa-P25 showed
a similar anatase–rutile mixture as TiO
2
-NT2.
The percentages of anatase and rutile and the corresponding
crystal sizes are summarised in Table 2.
As indicated above, the CNT–TiO
2
sample contained only
anatase, while the various heat treatments changed the phase
composition from 100% anatase (TiO
2
-NT1), to 72% anatase and
28% rutile (TiO
2
-NT2) and finally 100% rutile (TiO
2
-NT3).
It appears that the crystal sizes of the anatase phase for most
TiO
2
-nanotubes samples were similar to that in P25, except in the
case of CNT–TiO
2
, which contained anatase crystals with an
average size of 5 nm. The average crystal sizes of rutile in TiO
2
-NT2
and TiO
2
-NT3 are also smaller than in P25. This is in line with our
previous observations, which suggested that CNTs stabilize small
Table 1
Summary of the nomenclature and some characteristics of TiO
2
nanotubes.
Sample Temperature of
treatment (8C) in air
Temperature of
treatment (8C) in Ar
Quantity of
TiO
2
(%)
Quantity of
CNT (%)
Phase composition S
BET
(m
2
/g)
P25 – – 100 – Anatase–rutile 54
CNT–TiO
2
– 350 70 30 Anatase 22
TiO
2
-NT1 520 – 100 – Anatase 12
TiO
2
-NT2 520 550 100 – Anatase–rutile 13
TiO
2
-NT3 520 700 100 – Rutile 27
Fig. 1. XRD patterns of some TiO
2
nanotubes used in this study together with P25,
used as reference. A: anatase; R: rutile.
Table 2
Characterisation of the composition and morphology of the crystalline phases of
TiO
2
, determined by XRD.
Samples W
A
(%) B
A
(nm) W
R
(%) B
R
(nm)
P25 70 20.2 30 30.8
CNT–TiO
2
100 5.3 – –
TiO
2
-NT1 100 23.4 – –
TiO
2
-NT2 72 23.8 28 23.7
TiO
2
-NT3 – – 100 24.0
N. Bouazza et al. /Applied Catalysis B: Environmental 92 (2009) 377–383
379
crystal sizes during crystallisation and phase transformation
treatments [15].
3.1.3. Porous texture
The porous texture characterisation of the samples was
performed by N
2
adsorption at À196 8C. Fig. 2 shows the
adsorption isotherms of nitrogen at À196 8C of the TiO
2
nanotubes,
TiO
2
-NT1, TiO
2
-NT2, and TiO
2
-NT3, as well as that for the CNT–TiO
2
hybrid.
The results confirm that the N
2
adsorption isotherms are of type
II for all samples and that the elimination of the CNTs caused a
decrease in porosity. The specific surface areas of the TiO
2
nanotubes are in the range between 12 and 27 m
2
/g and thus
smaller than the surface area of TiO
2
P25-Degussa (54 m
2
/g).
Interestingly, the surface area of the rutile nanotube is larger that
for both the anatase and anatase–rutile nanotubes. This is
attributed to the presence of benzyl alcohol and CNTs, both of
which prevent grain growth during phase transformation and so
stabilize very small particles [15,17]. By adjusting process
parameters and choice of CNTs, rutile nanotubes with surface
areas as larges as 60–80 m
2
/g could be produced [15,16]. The
surface area for the sample studied in this work (27 m
2
/g) is still
considerably larger than most commercial samples of unsupported
rutile materials [31,32].
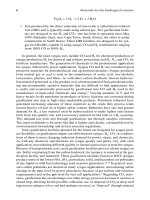
3.1.4. Morphology
The samples were investigates with both, transmission electron
microscopy (TEM) and scanning electron microscopy (SEM).
TEM image in Fig. 3 presents the CNT–TiO
2
and TiO
2
-NT2
samples, from which the size of the TiO
2
particles can be
determined. In Fig. 3a the part of CNT covered by TiO
2
shows a
complete covering of TiO
2
. The nanosized TiO
2
supported on the
CNT is observed to be homogeneously and densely spread on the
surfaces of the CNT. Fig. 3b allows to clearly observe TiO
2
nanotubes resulting from the grown on a carbon nanotube and its
subsequent burning. In this case, the diameter of TiO
2
in TiO
2
-NT2
nanotube is around 100 nm.
The SEM image in Fig. 4a shows a smooth, uniform coating of
CNTs with TiO
2
, indicating small crystal sizes. The outer diameter
ranges from 80 to 150 nm, which corresponds to a wall thickness of
20–40 nm. The occasional presence of fractures is attributed to the
vacuum assisted drying process. Fig. 4b shows the corresponding
SEM images for the TiO
2
nanotubes and reveal that the CNTs have
indeed been removed upon oxidation, as suggested from XRD
analysis, while preserving the tubular morphology. The cylinder
hole, around 50 nm, is clearly observed [15]. The walls consist of
Fig. 4. SEM images of (a) CNT–TiO
2
hybrid and (b) TiO
2
-NT2.
Fig. 2. Nitrogen adsorption isotherms at À196 8C of TiO
2
nanotubes.
Fig. 3. TEM micrographs images of (a) CNT–TiO
2
hybrid and (b) TiO
2
-NT2 (in all images the bar corresponds to 100 nm).
N. Bouazza et al. /Applied Catalysis B: Environmental 92 (2009) 377–383
380
crystals with sizes of about 20 nm, close to the average values
obtained by XRD.
3.2. Activity of the photocatalysts for propene oxidation at low
concentration
The photocatalytic performance of these new materials was
investigated for the oxidation of propene at low concentration,
100 ppmv, using different flow rates, 7.5, 30 and 60 ml/min. After a
certain time in the dark to allow equilibrium adsorption, the
samples were illuminated using a UV lamp with a radiation peak at
257.7 nm. The weight of the samples was 0.11 g for TiO
2
nanotubes, while 0.16 g was chosen for the CNT–TiO
2
sample
(70% TiO
2
and 30% of carbon nanotubes) so that the weight of TiO
2
was constant in all experiments. The fact that the weight ratio
carbon/TiO
2
is 30/70 lets us compare the obtained results with
those of other hybrids previously studied, containing the same
ratio [26,27].
3.2.1. Oxidation of propene using TiO
2
nanotubes
Each experiment was performed by passing the propene stream
through the photocatalyst bed until the propene concentration in
the outlet stream equalled the inlet concentration. Then, the UV-
light was switched on and the decrease in the propene
concentration over time was recorded, as shown in Fig. 5 for
P25, TiO
2
-NT3 and CNT–TiO
2
. The performance of the other TiO
2
nantube samples was similar to TiO
2
-NT3.
The results of Fig. 5a–c, shows as an example of all the samples
studied, indicate that the propene adsorption on the surface of TiO
2
before UV illumination was negligible for both the commercial
sample and the TiO
2
nanotubes. After switching on the UV source,
the propene concentration in the outlet stream of the reactor
decreased rapidly, though significantly at a slower rate for the TiO
2
nanotubes compared with P25. Thus, the reaction rates for the
photocatalytic oxidation are lower for the nanotubes than for P25.
The results for the conversion of propene at 100 ppmv and the
calculated activities are shown in Tables 3 and 4, respectively, for
three different flow rates: 7.5, 30 and 60 ml/min.
At first glance, it appears that all TiO
2
nanotubes are
considerably less active than the P25. This, however, can be
explained by the significantly smaller surface area of the
nanotubes as shown by the activity related to surface area.
Both, conversion and activity depend on the phase composition
of the TiO
2
catalysts. The results shows that the rutile nanotubes,
depite their comparatively higher surface areas, performed less
than the anatase nanotubes. The performance was significantly
improved in the sample which contained a mixture of anatase and
rutile. The highest activity was, however, observed in the CNT–TiO
2
hybrid, thus suggesting a synergistic role of CNTs.
Thus, the main conclusions, according to Table 4 and Fig. 6 are
the following:
Fig. 5. Photocatalytic activity for the oxidation of propene at 7.5 ml/min using UV-
light (peak wavelength 257.7 nm) for photocatalysts: (a) P25, (b) TiO
2
-NT1 and (c)
CNT–TiO
2
.
Table 4
Standard activity per gram of sample (st. activity) or related to surface area (SAR
S
BET
) for all samples studied at three flows, 7.5, 30 and 60ml/min.
Samples 7.5ml/min 30 ml/min 60 ml/min
St. activity
(mol/g min)
SAR
S
BET
(mol/m
2
min)
St. activity
(mol/g min)
SAR
S
BET
(mol/m
2
min)
St. activity
(mol/g min)
SAR
S
BET
(mol/m
2
min)
CNT–TiO
2
1.36 Â 10
À7
6.18 Â 10
À9
3.15 Â 10
À7
14.32 Â10
À9
5.83 Â 10
À7
26.50 Â10
À9
TiO
2
-NT1 1.81Â 10
À7
15.08 Â10
À9
2.34 Â 10
À7
19.50 Â10
À9
3.12 Â 10
À7
26.00 Â10
À9
TiO
2
-NT2 1.92Â 10
À7
14.77 Â 10
À9
2.80 Â10
À7
21.54 Â10
À9
3.57 Â 10
À7
27.46 Â 10
À9
TiO
2
-NT3 1.25Â 10
À7
4.63 Â 10
À9
1.45 Â 10
À7
5.37 Â 10
À9
1.56 Â 10
À7
5.78 Â10
À9
P25 2.80 Â10
À7
5.18 Â 10
À9
8.70 Â10
À7
16.11 Â10
À9
1.17 Â 10
À6
21.67 Â 10
À9
Table 3
Propene conversion by P25 and the TiO
2
-nanotube photocatalysts using different
100 ppmv propene stream flow rates.
Samples Conversion
at 7.5 ml/min
Conversion
at 30 ml/min
Conversion
at 60 ml/min
P25 100 78 50
CNT–TiO
2
71 41 38
TiO
2
-NT1 65 21 14
TiO
2
-NT2 69 25 16
TiO
2
-NT3 45 13 7
N. Bouazza et al. / Applied Catalysis B: Environmental 92 (2009) 377–383
381
(a)
The difference in performance between the anatase and rutile
nanotubes was observed for all three flow rates and was most
dominant at a flow rate of 60 ml/min. As XRD analysis
confirmed, the crystal size for anatase in TiO
2
-NT1 is similar
to that of rutile in TiO
2
-NT3, thus the crystal size is not
responsible for the observed difference. This observation is
even more interesting, if one considers that the BET surface
area of the rutile sample is more than twice that of the anatase
sample. Hence, the considerably lower photocatalytic activity
seems to origin solely in the electronic or structural nature of
the rutile phase. This result is in agreement with some studies,
which indicated that the anatase phase has a larger photo-
catalytic activity than the rutile phase [33,34]. The authors
related the superior activity of the anatase phase to its better
adsorption capacity of organic compounds and, more likely, to
its slower recombination rate of the hole–electron pairs
[33,34]. However, most of these studies used rutile materials
that had significantly smaller surface areas than the anatase
materials. Therefore, an effect of the surface area could not be
entirely excluded, in contrast to our work, which compared a
rutile material with a larger surface area than anatase.
(b)
Interestingly, sample TiO
2
-NT2 exhibited a photocatalytic
activity that was even higher than that of the anatase
nanotubes. From XRD analysis it is known that this sample
contains a mixture of anatase (72%) and rutile (28%). This ratio
is similar to that of P25, one of the most frequently studied TiO
2
materials. The Standard activity related to surface area of this
sample should also be remarked, and its excellent photo-
catalytic performance has been attributed to an enhanced
separation of hole–electron pairs caused by the multiphase
nature containing anatase and rutile [34,35].
(c)
The most intriguing result is the performance of the CNT–TiO
2
hybrid, which showed the highest conversion and activity
values of the investigated samples. This sample consists of 70%
TiO
2
(100% anatase) and 30% CNTs.
There are several possible explanations for the synergistic role
of CNTs, depending on the inorganic material and choice of
application.
(1)
The first explanation is purely physical and can be described in
terms of CNT acting as a dispersing agent which prevents TiO
2
from agglomerating, thus providing a higher active surface area
of the resulting catalyst compared with the single phase TiO
2
.
In our work, the crystal size of anatase in this sample was
significantly smaller (5 nm) when supported on CNTs than
those in the nanotube samples NT1 and NT2 (23 nm). The
beneficial role of CNTs in this scenario would be their high
specific surface area as well as their high thermal conductivity,
which enable the use of CNTs as a support and heat sink during
heat treatments, thus stabilizing small particle sizes [29].
(2)
Another explanation is the synergistic role of CNTs based on
charge transfer processes between CNTs and TiO
2
. CNTs are
excellent electrical conductors and can so either provide (CNTs
as photosensitizers) or accept (CNTs as electron sinks)
electrons, which are transferred through the CNT–TiO
2
inter-
face [29]. For instance, electrons can be photo-induced in CNTs
and easily transferred to the CNT–TiO
2
interface, where they
are injected into the TiO
2
conduction band. These electrons can
trigger the formation of very reactive radicals such as super-
oxide radical ions (O
2
À
) and hydroxyl radicals (HO
), which are
then responsible for the degradation of the organic compound.
A similar electron transfer was observed between various other
carbon materials and the TiO
2
semiconductor [36].
Alternatively, the charge transfer direction can also be reverted,
so that CNTs act as an electron acceptor, promoting interfacial
electron-transfer processes from the attached oxide to the CNT.
This results in a separation of charges, which retards the
recombination of photo-induced electrons and holes and hence
improves the photocatalytic activity of the semiconductor.
To distinguish between these effects, the CNT–TiO
2
hybrid was
compared with hybrid TiO
2
photocatalysts, containing MCM-41
(TiO
2
/M1) [27] or activated carbon (TiO
2
/C1) [26,27]. Both of these
supports have very high surface areas, which can stabilize small
crystal sizes, but do not exhibit electrical properties as good as
CNTs. Fig. 7 shows the catalytic activity of three photocatalysts
CNT–TiO
2
, TiO
2
/M1 and TiO
2
/C1.
In spite of the different morphology of these hybrids (CNT–TiO
2
is in form of powder and TiO
2
/M1 and TiO
2
/C1 are in form of
pellets), it is possible to observe that the CNT–TiO
2
hybrid shows
the highest photocatalytic activity amongst the three.
The amount of CO
2
generated as an oxidation propene has been
quantified and compared with the oxidised propene. Thus, the ratio
mol of CO
2
generated/mol of propene oxidised is around 3 in all the
experiments, which indicated total mineralisation of the oxidised
propene to carbon dioxide and water, according to previously
published results dealing with propene oxidation [25,28].Asan
example, this ratio mol of CO
2
generated/mol of propene oxidised is
2.75 for propene oxidation at 60 ml/min for sample TiO
2
-NT1.
The previously obtained resultsremarkthe importantrole played
by morphology of the nanotubes, and highlight the novelty of this
work on hybrids. This aspect will be studied in depth in the future.
4. Conclusions
The present paper has studied the photocatalytic oxidation of
propene at low concentration (100 ppm) using titanium dioxide
Fig. 6. Oxidation of propene using 60 ml/min flow rate for the all photocatalysts.
Fig. 7. Propene oxidation using 60 ml/min flow rate for the three hybrids.
N. Bouazza et al. /Applied Catalysis B: Environmental 92 (2009) 377–383
382
nanotubes. The results of this study allow obtaining the following
conclusions.
Nitrogen adsorption shows that all these TiO
2
materials are
macroporous, as the commercial TiO
2
photocatalyst (Degussa-
P25). The use of XRD and TEM techniques has shown that the
different TiO
2
-nanotube samples have different crystalline struc-
tures, with different anatase and rutile percentages.
Comparison between the photocatalytic activities of TiO
2
nanotubes allows concluding that the differences in activity are
related to two factors. One of them is the percentage of the two
phases, anatase and rutile, of TiO
2
. Thus, the TiO
2
-NT2 photocatalyst,
which contains 72% of anatase and 28% of rutile, is the best one.
The other is the composition, especially the carbon content.
Thus, the CNT–TiO
2
photocatalyst, which contains in its composi-
tion 70% of TiO
2
and 30% of CNT, shows the highest photocatalytic
activity, higher than that for TiO
2
-NT2.
Total mineralisation of the oxidised propene to carbon dioxide
and water has been obtained in the oxidation experiments for all
photocatalysts studied.
The activity of the CNT–TiO
2
hybrid is larger than that of other
hybrid TiO
2
photocatalysts previously studied, what remarks the
importance of the electric properties of the hybrid and interesting
morphology.
Acknowledgements
The authors thank MCYT (CTQ2005-01358/PPQ) and General-
itat Valenciana (ARVIV 2007/063 and Prometeo/2009/047) for
financial support. M. Ouzzine thanks MAEC-AECID for a pre-
doctoral fellowship.
References
[1] B.D. Yao, Y.F. Chan, X.Y. Zhang, W.F. Zhang, Z.Y. Yang, N. Wang, Appl. Phys. Lett. 82
(2) (2003) 281–283.
[2] G. Zhanqi, Y. Shaogui, T. Na, S. Cheng, J. Hazard. Mater. 145 (2007) 424–430.
[3] M. Qamar, C.R. Yoon, H.J. Oh, N.H. Lee, K. Park, D.H. Kim, K.S. Lee, W.J. Lee, S.J. Kim,
Catal. Today 131 (2008) 3–14.
[4] C C. Tsai, H. Teng, Chem. Mater. 18 (2006) 367–373.
[5] M.A. Khan, H T. Jung, O B. Yang, J. Phys. Chem. B 110 (13) (2006) 6626–6630.
[6] T. Kasuga, Thin Solid Films 496 (2006) 141–145.
[7] K. Byrappa, A.S. Dayananda, C.P. Sajan, B. Basavalingu, M.B. Shayan, K. Soga, M.
Yoshimura, J. Mater. Sci. 43 (2008) 2348–2355.
[8] Y.S. Sohn, Y.R. Smith, M. Misra, V. Subramanian, Appl. Catal. B: Environ. 84 (2008)
372–378.
[9] P. Hoyer, Langmuir 12 (1996) 1411–1413.
[10] D. Gong, C.A. Grimes, O.K. Varghese, J. Mater. Res. 16 (12) (2001) 3331–3334.
[11] H C. Liang, X Z. Li, J. Hazard. Mater. 162 (2009) 1415–1422.
[12] A. Jitianu, T. Cacciaguerra, M.H. Berger, R. Benoit, F. Be
´
guin, S. Bonnamy, J. Non-
Cryst. Solids 345/346 (2004) 596–600.
[13] H. Imai, Y. Takei, K. Shimizu, M. Matsuda, H. Hirashima, J. Mater. Chem. 9 (1999)
2971–2972.
[14] D. Eder, M.S. Motta, I.A. Kinloch, A.H. Windle, Physica E 37 (2007) 245–249.
[15] D. Eder, A.H. Windle, J. Mater. Chem. 18 (2008) 2036–2043.
[16] D. Eder, I.A. Kinloch, A.H. Windle, Chem. Commun. (2006) 1448–1450.
[17] D. Eder, A.H. Windle, Adv. Mater. 20 (2008) 1787–1793.
[18] Y Y. Hsu, T L. Hsiung, H.P. Wang, Y. Fukushina, Y L. Wei, J E. Chang, Mar. Pollut.
Bull. 57 (2008) 873–876.
[19] L R. Hou, C.Z. Yuan, Y. Peng, J. Hazard. Mater. B 139 (2007) 310–315.
[20] J.M. Macak, M. Zlamal, J. Krysa, P. Schmuki, Small 3 (2) (2007) 300–304.
[21] D. Eder, M.S. Motta, A.H. Windle, Nanotechnology 20 (5) (2009) 055602.
[22] M. Inagaki, N. Kondo, R. Nonaka, E. Ito, M. Toyoda, K. Sogabe, T. Tsumura, J. Hazard.
Mater. 161 (2–3) (2009) 1514–1521.
[23] G. Zhanqi, Y. Shaogui, S. Cheng, H. Jun, Sep. Purif. Technol. 58 (2007) 24–31.
[24] T. Kasuga, M. Hiramatsu, A. Hoson, T. Sekino, K. Niihara, Adv. Mater. 11 (15)
(1999) 1307–1311.
[25] C.T. Brigden, S. Poulston, M.V. Twigg, A.P. Walker, A.J.J. Wilkins, Appl. Catal. B:
Environ. 32 (1–2) (2001) 63–71.
[26] M.A. Lillo-Ro
´
denas, N. Bouazza, A. Berenguer-Murcia, J.J. Linares-Salinas, P. Soto,
A. Linares-Solano, Appl. Catal. B: Environ. 71 (3–4) (2007) 298–309.
[27] N. Bouazza, M.A. Lillo-Ro
´
denas, A. Linares-Solano, Appl. Catal. B 77 (2008) 284–
293.
[28] N. Bouazza, M.A. Lillo-Ro
´
denas, A. Linares-Solano, Appl. Catal. B: Environ. 84
(2008) 691–698.
[29] D. Eder, Chem. Rev., accepted for publication.
[30] H.O. Pierson, Handbook of Carbon, Graphite, Diamonds and Fullerenes: Proces-
sing, Properties and Applications, 1st ed., Noyes Publications, Park Ridge, 1993.
[31] D. Eder, R. Kramer, Phys. Chem. Chem. Phys. 5 (6) (2003) 1314–1319.
[32] D. Eder, R. Kramer, J. Phys. Chem. B 108 (39) (2004) 14823–14829.
[33] A C. Lee, R H. Lin, C Y. Yang, M.H. Lin, W Y. Wang, Mater. Chem. Phys. 109
(2008) 275–280.
[34] D.C. Hurum, A. G. Agrios, K.A. Gray, J. Phys. Chem. B 107 (19) (2003) 4545–
4549.
[35] O. Carp, C.L. Huisman, A. Reller, Prog. Solid State Chem. 32 (1–2) (2004) 33–177.
[36] H C. Huang, G L. Huang, H L. Chen, Y D. Lee, Thin Solid Films 511/512 (2006)
203–207.
N. Bouazza et al. / Applied Catalysis B: Environmental 92 (2009) 377–383
383