the induction machine handbook chuong (14)
Bạn đang xem bản rút gọn của tài liệu. Xem và tải ngay bản đầy đủ của tài liệu tại đây (2.35 MB, 28 trang )
Chapter 14
MOTOR SPECIFICATIONS AND DESIGN PRINCIPLES
14.1 INTRODUCTION
Induction motors are used to drive loads in various industries for powers
from less than 100W to 10MW and more per unit. Speeds encountered go up to
tens of thousands of rpm.
There are two distinct ways to supply an induction motor to drive a load.
• Constant voltage and frequency (constant V/f) – power grid connection
• Variable voltage and frequency – PWM static converter connection
The load is represented by its shaft torque–speed curve (envelope).
There are a few basic types of loads. Some require only constant speed
(constant V/f supply) and others request variable speed (variable V/f supply).
In principle, the design specifications of the induction motor for constant
and variable speed, respectively, are different from each other. Also, an existing
motor, that was designed for constant V/f supply may, at some point in time, be
supplied from variable V/f supply for variable speed.
It is thus necessary to lay out the specifications for constant and variable V/f
supply and check if the existing motor is the right choice for variable speed.
Selecting an induction motor for the two cases requires special care.
Design principles are common to both constant and variable speed.
However, for the latter case, because the specifications are different, with
machine design constraints, or geometrical aspects (rotor slot geometry, for
example) lead to different final configurations. That is, induction motors
designed for PWM static converter supplies are different.
It seems that in the near future more and more IMs will be designed and
fabricated for variable speed applications.
14.2 TYPICAL LOAD SHAFT TORQUE/SPEED ENVELOPES
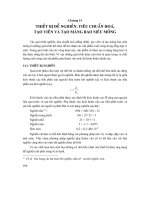
Load shaft torque/speed envelopes may be placed in the first quadrant or in
2, 3, or 4 quadrants (Figure 14.1a, b).
Constant V/f fed induction motors may be used only for single quadrant
load torque/speed curves.
In modern applications (high performance machine tools, robots, elevators),
multiquadrant operation is required. In such cases only variable V/f (PWM
static converter) fed IMs are adequate.
Even in single quadrant applications, variable speed may be required (from
point A to point B in Figure 14.1a) to reduce energy consumption for lower
speeds, by supplying the IM through a PWM static converter at variable V/f
(Figure 14.2).
© 2002 by CRC Press LLC
Author: Ion Boldea, S.A.Nasar………… ………
B
A
x
x
1
T
T
L
Ln
Ω
Ω
r
n
Ω
Ω
rmax
b
Ω
Ω
b
r
1
T
T
e
eb
low duty cycle
rated duty cycle
a.)
b.)
1
Figure 14.1 Single (a) and multiquadrant (b) load speed/torque envelopes
B
A
x
x
1
T
T
L
Ln
Ω
Ω
r
n
1
fan load
V /f
nn
V<V
f<f
V/f
n
n
Figure 14.2 Variable V/f for variable speed in single quadrant operation
The load torque/speed curves may be classified into 3 main categories
• Squared torque: (centrifugal pumps, fans, mixers, etc.)
2
n
r
LnL
TT
Ω
Ω
=
(14.1)
• Constant torque: (conveyors, rollertables, elevators, extruders, cement kilns,
etc.)
constantTT
LnL
==
(14.2)
• Constant power
br
r
b
Lb
brLb
for TT
for TT
Ω>Ω
Ω
Ω
=
Ω≤Ω=
(14.3)
© 2002 by CRC Press LLC
Author: Ion Boldea, S.A.Nasar………… ………
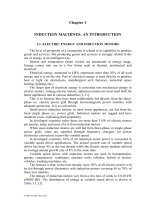
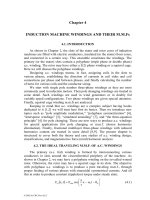
A generic view of the torque/speed envelopes for the three basic loads is
shown in Figure 14.3.
The load torque/speed curves of Figure 14.3 show a marked diversity and,
especially, the power/speed curves indicate that the induction motor capability
to meet them depends on the motor torque/speed envelope and on the
temperature rise for the rated load duty-cycle.
There are two main limitations concerning the torque/speed envelope
deliverable by the induction motor. The first one is the mechanical characteristic
of the induction machine itself and the second is the temperature rise.
For a general purpose design induction motor, when used with variable V/f
supply, the torque/speed envelope for continuous duty cycle is shown in Figure
14.4 for self ventilation (ventilator on shaft) and separate ventilator (constant
speed ventilator) ,respectively.
1
1
power
torque
T
Ω
r
load
fans,
pumps
1
1
power
T
Ω
r
loa
d
coil
winders
3
torque
1
1
power
T
Ω
r
load
electric
transportation
2.5
1
1
power
T
Ω
r
load
spindles,
electric car
propulsion
4
1
1
power
T
Ω
r
load
excavators
torque
1
1
power
T
Ω
r
load
elevators
torque
low
speed
high
speed
torque
torque
0.5
Figure 14.3 Typical load speed/torque curves (first quadrant shown)
© 2002 by CRC Press LLC
Author: Ion Boldea, S.A.Nasar………… ………
f increases
1
separate ventilator
100%
90%
80%
70%
60%
50%
40%
T
T
e
en
Ω
Ω
r
b
1.0 2.0
selfventilator
pump load
voltage
relative speed
Figure 14.4 Standard induction motor torque/speed envelope for variable V/f supply
Sustained operation at large torque levels and low speed is admitted only
with separate (constant speed) ventilator cooling. The decrease of torque with
speed reduction is caused by temperature constraints.
As seen from Figure 14.4, the quadratic torque load (pumps, ventilators
torque/speed curve) falls below the motor torque/speed envelope under rated
speed (torque). For such applications only self ventilated IM design are
required.
Not so for servodrives (machine tools, etc) where sustained operation at low
speed and rated torque is necessary.
A standard motor capable of producing the extended speed/torque of Figure
14.4 has to be fed through a variable V/f source (a PWM static converter) whose
voltage and frequency has to vary with speed as in Figure 14.5.
V
V
n
Ω
Ω
r
b
1.0 2.0
frequency
voltage
torque
1
Figure 14.5 Voltage and frequency versus speed
© 2002 by CRC Press LLC
Author: Ion Boldea, S.A.Nasar………… ………
The voltage ceiling of the inverter is reached at base speed Ω
b
. Above Ω
b
,
constant voltage is applied for increasing frequency. How to manage the IM
flux linkage (rotor flux) to yield the maximum speed/torque envelope is a key
point in designing an IM for variable speed.
14.3 DERATING
Derating is required when an induction motor designed for sinusoidal
voltage and constant frequency is supplied from a power grid that has a notable
voltage harmonic content due to increasing use of PWM static converters for
other motors or due to its supply from similar static power converters. In both
cases the time harmonic content of motor input voltages is the cause of
additional winding and core losses (as shown in Chapter 11). Such additional
losses for rated power (and speed) would mean higher than rated temperature
rise of windings and frame. To maintain the rated design temperature rise, the
motor rating has to be reduced.
The rise of switching frequency in recent years for PWM static power
converters for low and medium power IMs has led to a significant reduction of
voltage time harmonic content at motor terminals. Consequently, the derating
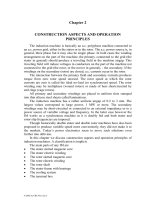
has been reduced. NEMA 30.01.2 suggests derating the induction motor as a
function of harmonic voltage factor (HVF), Figure 14.6.
Reducing the HVF via power filters (active or passive) becomes a priority
as the variable speed drives extension becomes more and more important.
In a similar way, when IMs designed for sinewave power source are fed
from IGBT PWM voltage source inverters, typical for induction motors now up
to 2MW (as of today), a certain derating is required as additional winding and
core losses due to voltage harmonics occur.
derating factor
(HVF)
1.0
0.9
0.8
0.7
0.6
0 0.02 0.04 0.06 0.08 0.1 0.12
Harmonic voltage factor
Figure 14.6 Derating for harmonic content of standard motors operating on sinewave power
with harmonic content
© 2002 by CRC Press LLC
Author: Ion Boldea, S.A.Nasar………… ………
This derating is not yet standardized, but it should be more important when
power increases as the switching frequency decreases. A value of 10% derating
for such a situation is now common practice.
When using an IM fed from a sinewave power source with line voltage V
L
through a PWM converter, the motor terminal voltage is somewhat reduced with
respect to V
L
due to various voltage drops in the rectifier and inverter power
switches, etc.
The reduction factor is 5 to 10% depending on the PWM strategy in the
converter.
14.4 VOLTAGE AND FREQUENCY VARIATION
When matching an induction motor to a load, a certain supply voltage
reduction has to be allowed for which the motor is still capable to produce rated
power for a small temperature rise over rated value. A value of voltage variation
of ±10% of rated value at rated frequency is considered appropriate (NEMA
12.44).
Also, a ±5% frequency variation at rated voltage is considered acceptable.
A combined 10% sum of absolute values, with a frequency variation of less than
5%, has to be also handled successfully. As expected in such conditions, the
motor rated speed efficiency and power factor for rated power will be slightly
different from rated label values.
Figure 14.7 Derating due to voltage imbalance in %
Through the negative sequence voltage imbalanced voltages may produce,
additional winding stator and rotor losses. In general, a 1% imbalance in
voltages would produce a 6 – 10% imbalance in phase currents.
The additional winding losses occurring this way would cause notable
temperature increases unless the IM is derated (NEMA Figure 14.1) Figure
© 2002 by CRC Press LLC
Author: Ion Boldea, S.A.Nasar………… ………
14.7. A limit of 1% in voltage imbalance is recommended for medium and large
power motors.
14.5 INDUCTION MOTOR SPECIFICATIONS FOR CONSTANT V/f
Key information pertaining to motor performance, construction, and
operating conditions is provided for end users’ consideration when specifying
induction motors.
National (NEMA in U.S.A. [1]) and international (IEC in Europe) standards
deal with such issues to provide harmonization between manufacturers and
users worldwide.
Table 14.1. summarizes most important headings and the corresponding
NEMA section.
Table 14.1. NEMA standards for 3 phase IMs (with cage rotors)
Heading NEMA section
Nameplate markings NEMA MG – 1 10.40
Terminal markings NEMA MG – 1 2.60
NEMA size starters
NEMA enclosure types
Frame dimensions NEMA MG – 1 11
Frame assignments NEMA MG – 1 10
Full load current NEC Table 430 – 150
Voltage NEMA MG – 1 12.44, 14.35
Impact of voltage, frequency variation
Code letter NEMA MG – 1 10.37
Starting NEMA MG – 1 12.44, 54
Design letter and torque NEMA MG – 1 12
Winding temperature NEMA MG – 1 12.43
Motor efficiency NEMA MG – 12 – 10
Vibration NEMA MG – 17
Testing NEMA MG – 112, 55, 20, 49 / IEEE-112B
Harmonics NEMA MG – 1 30
Inverter applications NEMA MG – 1, 30, 31
Among these numerous specifications, that show the complexity of IM
design, nameplate markings are of utmost importance.
The following data are given on the nameplate:
a. Designation of manufacturer’s motor type and frame
b. kW (HP) output
c. Time rating
d. Maximum ambient temperature
e. Insulation system
f. RPM at rated load
g. Frequency
h. Number of phases
i. Rated load amperes
j. Line voltage
© 2002 by CRC Press LLC
Author: Ion Boldea, S.A.Nasar………… ………
Table 14.2. 460V, 4 pole, open frame design B and E performance NEMA defined performance
© 2002 by CRC Press LLC
Author: Ion Boldea, S.A.Nasar………… ………
k. Locked-rotor amperes or code letter for locked-rotor kVA per HP for motor
½ HP or more
l. Design letter (A, B, C, D, E)
m. Nominal efficiency
n. Service factor load if other than 1.0
o. Service factor amperes when service factor exceeds 1.15
p. Over-temperature protection followed by a type number, when over-
temperature device is used
q. Information on dual voltage/frequency operation conditions
Rated power factor does not appear on NEMA nameplates, but is does so
according to most European standards.
Efficiency is perhaps the most important specification of an electric motor
as the cost of energy per year even in an 1 kW motor is notably higher than the
initial motor cost. Also, a 1% increase in efficiency saves energy whose costs in
3 to 4 years cover the initial extra motor costs.
Figure 14.8. NEMA designs A, B, C, E (a) and D (b) torque/speed curves
Standard and high efficiency IM classes have been defined and standardized
by now worldwide. As expected, high efficiency (class E) induction motors
have higher efficiency than standard motors but their size, initial cost, and
© 2002 by CRC Press LLC
Author: Ion Boldea, S.A.Nasar………… ………
locked-rotor current are higher. This latter aspect places an additional burden on
the local power grid when feeding the motor upon direct starting. If softstarting
or inverter operation is used, the higher starting current does not have any effect
on the local power grid rating. NEMA defines specific efficiency levels for
design B and E (high efficiency) IMs (Table 14.2).
On the other hand, EU established three classes EFF1, EFF2, EFF3 of
efficiencies, giving the manufacturers an incentive to qualify for the higher
classes.
The torque/speed curves reveal, for constant V/f fed IMs, additional
specifications such as starting, pull-up, and breaking torque for the five classes
(letters: A, B, C, D, E design) of induction motors (Figure 14.8).
The performance characteristics of the A, B, C, D, E designs are
summarized in Table 14.3 from NEMA Table 2.1 with their typical applications.
Table 14.3. Motor designs (after NEMA Table 2.1)
Classification
Locked rotor
torque
(% rated load
torque)
Breakdown
torque
(% rated
load torque)
Locked rotor
current
(% rated load
current)
Slip
%
Typical applications
Rel.
η
Design B
Normal locked
rotor torque
and normal
locked rotor
current
70 – 275* 175 – 300* 600 - 700 0.5 - 5 Fans, blowers,
centrifugal pumps
and compressors,
motor – generator
sets, etc., where
starting torque
requirements are
relatively low
Medium
or high
Design C
High locked
rotor torque
and normal
locked rotor
current
200 – 250* 190 – 225* 600 - 700 1 - 5 Conveyors, crushers,
stirring machines,
agitators,
reciprocating pumps
and compressors,
etc., where starting
under load is
required
Medium
Design D
High locked
rotor torque
and high slip
275 275 600 – 700 High peak loads with
or without fly
wheels, such as
punch presses,
shears, elevators,
extractors, winches,
hoists, oil – well
pumping and wire –
drawing machines
Medium
Design E
IEC 34-12
Design N
locked rotor
torques and
currents
75 – 190* 160 – 200* 800 – 1000 0.5 - 3 Fans, blowers,
centrifugal pumps
and compressors,
motor – generator
sets, etc. where
starting torque
requirements are
relatively low
High
© 2002 by CRC Press LLC
Author: Ion Boldea, S.A.Nasar………… ………
Note – Design A motor performance characteristics are similar to those for Design B except that the
locked rotor starting current is higher than the values shown in the table above
* Higher values are for motors having lower horsepower ratings
14.6 MATCHING IMs TO VARIABLE SPEED/TORQUE LOADS
IMs are, in general, designed for 60(50) Hz; when used for variable speed
with variable V/f supply, they operate at variable frequency. Below the rated
frequency, the machine is capable of full flux linkage, while above that, flux
weakening occurs.
For given load speed and load torque with variable V/f supply, we may use
IMs with 2p
1
= 2, 4, 6. Each of them, however, works at a different (distinct)
frequency.
Figures 14.9 show the case of quadratic torque (pump) load with the speed
range of 0 to 2000 rpm, load of 150 kW at 2000 rpm, 400 V, 50 Hz (network).
Two different motors are used: one of 2 poles and one of 4 poles.
torque
100%
f(Hz)
33.33
66.66
2p =2
1
2p =4
1
Figure 14.9 Torque versus motor frequency (and speed) pump load
At 2000 rpm the 2 pole IM works at 33.33 Hz with full flux, while the 4
pole IM operates at 66.66 Hz in the flux-weakening zone. Which of the two
motors is used is decided by the motor costs. Note however, that the absolute
torque (in Nm) of the motor has to be the same in both cases.
For a constant torque (extruder) load with the speed range of 300 – 1100
rpm, 50kW at 1200 rpm, network: 400 V, 50 Hz, two motors compete. One, of 4
pole, will work at 40 Hz and one, of 6 pole, operating at 60 Hz (Figure 14.10).
Again, both motors can satisfy the specifications for the entire speed range
as the load torque is below the available motor torque. Again the torque in Nm
is the same for both motors and the choice between the two motors is decided by
motor costs and total losses.
While starting torque and current are severe design constraints for IMs
designed for constant V/f supply, they are not for variable V/f supply.
© 2002 by CRC Press LLC
Author: Ion Boldea, S.A.Nasar………… ………
100%
f
(
Hz
)
40
60
4 poles
6 poles
tor
q
ue
Figure 14.10 Torque versus motor frequency (and speed) constant torque load
Skin effect is important for constant V/f supply as it reduces the starting
current and increases the starting torque. In contrast to this, for variable V/f
suply, skin effect is to be reduced, especially for high performance speed control
systems.
Breakdown torque may become a much more important design factor for
variable V/f supply, when a large speed zone for constant power is required. A
spindle drive or an electric car drive may require more than 4-to-1 constant
power range (Figure 14.11).
12 34
1
2
3
4
0.25
T
T
e
n
f
1n
4
1.0
4/9
0.25
load
Ω
r
Figure 14.11 Induction motor torque/speed curves for various values of frequency
and a 4/1 constant power speed range
The peak torque of IM is approximately
2
1
n1
ekf
sc
1
2
1
n1
2
n1
phn
ek
f
f
T
L2
p
f
f
f2
V
3T
n1
=
π
≈
(14.4)
The peak torque for constant (rated) voltage is inversely proportional to
frequency squared. To produce a 4/1 constant power speed range, the peak
torque has to be 4 times the rated torque. Only in this case, the motor may
produce at f
1max
= 4f
1n
, 25% of rated torque.
© 2002 by CRC Press LLC
Author: Ion Boldea, S.A.Nasar………… ………
Consequently, if the load maximum torque is equal to the rated torque, then
at 4f
1n
the rated power is still produced.
In reality, a breakdown torque of 400% is hardly practical. However, efforts
to reduce the short-circuit leakage inductance (L
sc
) have led up to 300%
breakdown torque.
So there are two solutions to provide the required load torque/speed
envelope: increase the motor rating (size) and costs or increase the flux
(voltage) level in the machine by switching from star to delta connection (or by
reducing the number of turns per phase by switching off part of the stator coils).
The above rationale was intended to suggest some basic factors that guide
the IM design.
Relating the specifications to a dedicated machine geometry is the object of
design (or dimensioning). This enterprise might be as well be called sizing the
IM.
Because there are many geometrical parameters and their relationships to
specifications (performance) are in general nonlinear, the design process is so
complicated that it is still a combination of art and science, based solidly on
existing experience (motors) with tested (proven) performance. In the process of
designing an induction motor, we will define a few design factors, features, and
sizing principles.
14.7 DESIGN FACTORS
Factors that influence notably the induction machine design are as follows:
Costs
Costs in most cases, are the overriding consideration in IM design. But
how do we define costs? It maybe the costs of active materials with or
without the fabrication costs. Fabrication costs depend on machine size,
materials available or not in stock, manufacturing technologies, and man
power costs.
The costs of capitalized losses per entire motor active life surpass quite
a few times the initial motor costs. So loss reduction (through higher
efficiency or via variable V/f supply) pays off generously. This explains the
rapid extension of variable speed drives with IMs worldwide.
Finally, maintenance costs are also important but not predominant. We
may now define the global costs of an IM as
costs emaintenanc costs dcapitalize losses
costs selling andn fabricatio costs material costs Global
++
++=
(14.5.)
Global costs are also a fundamental issue when we have to choose
between repairing an old motor or replacing it with a new motor (with
higher efficiency and corresponding initial costs).
© 2002 by CRC Press LLC
Author: Ion Boldea, S.A.Nasar………… ………
Material limitations
The main materials used in IM fabrication are magnetic-steel
laminations, copper and aluminum for windings, and insulation materials
for windings in slots.
Their costs are commensurate with performance. Progress in magnetic
and insulation materials has been continuous. Such new improved materials
drastically affect the IM design (geometry), performance (efficiency), and
costs.
Flux density, B(T), losses (W/kg) in magnetic materials, current density
J (A/mm
2
) in conductors and dielectric rigidity E (V/m) and thermal
conductivity of insulation materials are key factors in IM design.
Standard specifications
IM materials (lamination thickness, conductor diameter), performance
indexes (efficiency, power factor, starting torque, starting current,
breakdown torque), temperature by insulation class, frame sizes, shaft
height, cooling types, service classes, protection classes, etc. are specified in
national (or international) standards (NEMA, IEEE, IEC, EU, etc.) to
facilitate globalization in using induction motors for various applications.
They limit, to some extent, the designer’s options, but provide solutions that
are widely accepted and economically sound.
Special factors
In special applications, special specifications–such as minimum weight
and maximum reliability in aircraft applications–become the main concern.
Transportation applications require ease of maintaining, high reliability, and
good efficiency. Circulating water home pumps require low noise, highly
reliable, induction motors.
Large compressors have large inertia rotors and thus motor heating
during frequent starts is severe. Consequently, maximum starting
torque/current becomes the objective function.
14.8 DESIGN FEATURES
The major issues in designing an IM may be divided into 5 area: electrical,
dielectric, magnetic, thermal and mechanical.
Electrical design
To supply the IM, the supply voltage, frequency, and number of phases
are specified. From this data and the minimum power factor and a target
efficiency, the phase connection (start or delta), winding type, number of
poles, slot numbers and winding factors are calculated. Current densities (or
current sheets) are imposed.
Magnetic design
Based on output coefficients, power, speed, number of poles, type of
cooling, and the rotor diameter is calculated. Then, based on a specific
current loading (in A/m) and airgap flux density, the stack length is
determined.
© 2002 by CRC Press LLC
Author: Ion Boldea, S.A.Nasar………… ………
Fixing the flux densities in various parts of the magnetic circuit with
given current densities and slot mmfs, the slot sizing, core height, and
external stator diameter D
out
are all calculated. Choosing D
out
, which is
standardized, the stack length is modified until the initial current density in
the slot is secured.
It is evident that sizing the stator and rotor core may be done many
ways based on various criteria.
Insulation design
Insulation material and its thickness, be it slot/core insulation,
conductor insulation, end connection insulation, or terminal leads insulation
depends on machine voltage insulation class and the environment in which
the motor operates.
There are low voltage 400V/50Hz, 230V/60Hz, 460V/60Hz
690V/60Hz or less or high voltage machines (2.3kV/60Hz, 4kV/50Hz,
6kV/50Hz). When PWM converter fed IMs are used, care must be
exercised in reducing the voltage stress on the first 20% of phase coils or to
enforce their insulation or to use random wound coils.
Thermal design
Extracting the heat caused by losses from the IM is imperative to keep
the windings, core, and frame temperatures within safe limits. Depending
on application or power level, various types of cooling are used. Air cooling
is predominant but stator water cooling in the stator of high speed IMs
(above 10,000 rpm) is frequently used. Calculating the loss and temperature
distribution and the cooling system represents the thermal design.
Mechanical design
Mechanical design refers to critical rotating speed, noise, and vibration
modes, mechanical stress in the shaft, and its deformation displacement,
bearings design, inertia calculation, and forces on the winding end coils
during most severe current transients.
We mentioned here the output coefficient as an experience, proven
theoretical approach to a tentative internal stator (stator bore) diameter
calculation. The standard output coefficient is D
is
2
⋅L, where D
is
is the stator bore
diameter and L, the stack length.
Besides elaborating on D
is
2
⋅L, we introduce here the rotor tangential stress
σ
tan
(in N/cm
2
), that is, the tangential force at rotor surface at rated and peak
torque.
This specific force criterion may be used also for linear motors. It turns out
that σ
tan
varies from 0.2 to 0.3 N/cm
2
for hundred watt IMs to less than 3 to 4
N/cm
2
for large IMs. Not so for the output coefficient D
is
2
⋅L, which is related to
rotor volume and thus increases steadily with torque (and power).
© 2002 by CRC Press LLC
Author: Ion Boldea, S.A.Nasar………… ………
14.9 THE OUTPUT COEFFICIENT DESIGN CONCEPT
To calculate the relationship between the D
is
2
⋅L and the machine power and
performance, we start by calculating the airgap apparent power S
g
,
n11gap
IE3S =
(14.6)
where E
1
is the airgap emf per phase and I
1n
rated current (RMS values).
Based on the phasor diagram with zero stator resistance (R
s
= 0), Figure
14.12.
n1
ls
1
n1
s
n1
IjXEVRI
−=−
(14.7)
V
1n
jX I
1nls
E
1
I
1
ϕϕ
-
Figure 14.12 Simplified phasor diagram
Or
1ls
n1
1
E
sinx1
V
E
K ϕ⋅−≈=
(14.8)
with
n1
n1ls
ls
V
IX
x =
(14.9)
The p.u. value of stator leakage reactance increases with pole pairs p
1
and
so does sinϕ
1
(power factor decreases when p
1
increases).
1E
p005.098.0K ⋅−≈
(14.10)
Also, the input apparent power S
1n
is
n1n
n
n1n1n1
cos
P
IV3S
ϕη
==
(14.11)
where P
n
is the rated output power and η
n
and cosϕ
1n
are the assigned values of
rated efficiency and power factor based on past experience.
Typical values of efficiency have been given in Table 14.3 for Design B
and E (NEMA). Each manufacturer has its own set of data.
Efficiency increases with power and decreases with the number of poles.
Efficiency of wound rotor IMs is slightly larger than that of cage rotor IMs of
© 2002 by CRC Press LLC
Author: Ion Boldea, S.A.Nasar………… ………
same power and speed because the rotor windings are made of copper and the
total additional load (stray) losses are lower.
As efficiency is defined with stray losses p
stray
of 0.5 to1.0% of rated power
in Europe (still!) and with the latter (p
stray
) measured in direct load tests in the
U.S.A., differences in actual losses (in IMs of same power and nameplate
efficiency) of even more than 20% may be encountered when motors fabricated
in Europe are compared with those made in the U.S.A.
Anyway, the assigned value of efficiency is only a starting point for design
as iterations are performed until the best performance is obtained.
The power factor also increases with power and decreases with the number
of pole pairs with values slightly smaller than corresponding efficiency for
existing motors. More data on initial efficiency and power factor data will be
given in subsequent chapters on design methodologies.
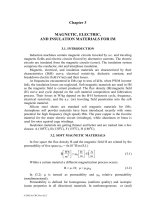
Figure 14.13 Form factor K
f
and flux density shape factor
α
i
versus teeth saturation
The emf E
1
may be written as a function of airgap pole flux φ,
φ=
1w1f11
KWKf4E
(14.12)
where f
1
is frequency, 1.11 > K
f
> 1.02 form factor (dependent on teeth
saturation) (Figure 14.13), W
1
is turns per phase, and K
w1
is winding factor, φ
pole flux.
© 2002 by CRC Press LLC
Author: Ion Boldea, S.A.Nasar………… ………
gi
LBτα=φ
(14.13)
where α
i
is flux density shape factor dependent on the magnetic saturation
coefficient of teeth (Figure 14.13) and B
g
is flux density in the airgap. The pole
pitch τ is
1
1
1
1
is
p
f
n ;
p2
D
=
π
=τ
(14.14)
Finally, S
gap
is
g1
1
2
is
2
1wifgap
BA
60
n
LDKKS πα=
(14.15)
with A
1
the specific stator current load A
1
(A/m),
is
n11
1
D
IW6
A
π
=
(14.16)
We might separate the volume utilization factor C
0
(Esson’s constant) as
1
2
is
gap
g1
2
1wif0
LnD
S60
BAKKC
=πα=
(14.17)
C
0
is not a constant as both the values of A
1
(A/m) and airgap flux density
(B
g
) increase with machine torque and with the number of pole pairs.
The D
is
2
⋅L output coefficient may be calculated from (14.17) with S
gap
from
(14.6) and (14.11).
n1n
nE
10
2
is
cos
PK
n
60
C
1
LD
ϕη
=
(14.18)
Typical values of C
0
as a function S
gap
with pole pairs p
1
as parameter for
low power IMs is given in Figure 14.14.
The D
is
2
⋅L (internal) output constant (proportional to rotor core volume) is,
in fact, almost proportional to machine rated shaft torque. Torque production
apparently requires less volume as the pole pairs number p
1
increases, C
0
increases with p
1
(Figure 14.14).
It is standard to assign a value λ to the stack length to pole pitch ratio
3.00.6 ;
D
Lp2L
is
1
<λ<
π
=
τ
=λ
(14.19)
© 2002 by CRC Press LLC
Author: Ion Boldea, S.A.Nasar………… ………
Figure 14.14 Esson’s “constant” C
0
versus S
gap
(airgap apparent power)
The stator bore diameter may now be calculated from (14.18) with (14.19).
3
n1n
nE
1
1
0
1
is
cos
PK
f
p
C
1p2
D
ϕηπλ
=
(14.20)
This is a standard design formula. However it does not say enough on the
machine total volume (weight). Moreover, in many designs, the stator external
(frame internal) diameters are standardized.
A similar (external) output coefficient D
is
2
⋅L may be derived if we first
adopt a design current density J
con
(A/m
2
) and consider the slot fill factor (with
conductors), K
fill
= 0.4 to 0.6,
given together with the tooth and stator back iron flux densities B
ts
and B
cs
.
With the airgap flux and tooth flux densities B
g
and B
ts
considered known,
the stator slot height h
s
is approximately
fillcon
ts
g
1
is
fillcon
ts
g
n1
s
Kj
B
B
A
D
1
Kj
B
B
IW6
h =
π
=
(14.21)
Now the core radial height h
cs
is
cs
g
1
isi
cs
cs
B
B
p2
D
2LB2
h
πα
=
φ
=
(14.22)
The outer stator diameter D
out
is
© 2002 by CRC Press LLC
Author: Ion Boldea, S.A.Nasar………… ………
()
cssisout
hh2DD ++=
(14.23)
We may replace D
is
from (14.23) in D
is
2
⋅L with h
s
and h
cs
from (14.21) and
(14.22).
(
)
is0
2
out
2
is
DfLDLD
⋅=
(14.24)
()
()
2
is
css
is0
D
hh2
1
1
Df
+
+
=
(14.25)
And, finally,
()
2
cs
g
1
i
isgfillcon
ts1
is0
B
B
p2DBKj
BA2
1
1
Df
πα
++
=
(14.26)
From (14.24),
() ()
n1n
nE
1
1
is00is0
2
is
2
out
cos
PK
f
p
DfC
1
Df
LD
LD
ϕη
==
(14.27)
As
1
is
p2
D
L
π
λ=
(14.28)
()
is0isn1n
nE
10
2
1
out
DfD
1
cos
PK
fC
p2
D
ϕηπλ
=
(14.29)
Although (14.29) through the function
()
[]
1
is0is
DfD
−
suggests that a
minimum D
out
may be obtained for given λ, B
g
/B
co
, B
g
/B
t
, j
con
, and A
1
, it seems
to us more practical to use (14.29) to find the outer stator diameter D
out
after the
stator bore diameter was obtained from (14.20). Now if this value is not a
standard one and a standard frame is a must, the aspect ratio λ is modified until
D
out
matches a standardized value.
The specific current loading A
1
depends on pole pitch τ and number of
poles on D
is
, once a certain cooling system (current density) is adopted.
In general, it increases with D
is
from values of less than 10
3
A/m for D
is
=
4⋅10
-2
m to 45,000 A/m for D
is
= 0.4 m and 2p
1
= 2 poles. Smaller values are
common for larger number of poles and same stator bore diameter.
On the other hand, the design current density j
con
varies in the interval j
con
=
(3.5 – 8.0)⋅10
6
A/m
2
for axial or axial-radial air cooling. Higher values are
designated to high speed IMs (lower pole pair numbers p
1
) or for liquid cooling.
While A
1
varies along such a large span and the slot height h
s
to slot width b
s
© 2002 by CRC Press LLC
Author: Ion Boldea, S.A.Nasar………… ………
ratio is limited to K
aspect
(3 – 6), to limit the slot leakage inductance, using A
1
may be avoided by calculating slot height h
s
as
−
π
=
τ
−
π
==
ts
g
s
is
aspect
slot
t
s
is
aspectsaspects
B
B
1
N
D
K
b
1
N
D
KbKh
(14.30)
Higher values of aspect ratios are typical to larger motors.
This way, D
out
2
L is
2
cs
g
1
i
ts
g
s
aspect
n1n
nE
1
1
0
2
out
B
B
p2B
B
1
N
K2
1
cos
PK
f
P
C
1
LD
πα
+
−
π
+
ϕη
=
(14.31)
Also,
cs
g
1
i
ts
g
s
aspect
is
out
B
B
p2B
B
1
N
K2
1
D
D πα
+
−
π
+≈ (14.32)
To start, we may calculate D
is
/D
out
as a function of only pole pairs p
1
if
B
g
/B
ts
= ct and B
g
/B
cs
= ct, with K
aspect
and N
s
(slots/stator) also assigned
corresponding values (Table 14.4).
Table 14.4 Outer to inner stator diameter ratios
2p
1
2 4 6 8
≥
10
is
out
D
D
1.65 – 1.69 1.46 – 1.49 1.37 – 1.40 1.27 – 1.30 1.24 – 1.26
The stack aspect ratio λ is assigned an initial value in a rather large interval:
0.6 to 3.
In general, longer stacks, allowing for a smaller stator bore diameter (for
given torque) lead to shorter stator winding end connections, lower winding
losses, and lower inertia, but the temperature rise along the stack length may
become important. An optimal value of λ is highly dependent on IM design
specifications and the objective function taken into consideration. There are
applications with space shape constraints that prevent using a long motor.
Example 14.1 Output coefficient
Let us consider a 55 kW, 50 Hz, 400 V, 2p
1
= 4 induction motor whose
assigned (initial) rated efficiency and power factor are η
n
= 0.92, cosϕ
n
= 0.92.
Let us determine the stator internal and external diameters D
out
and D
is
for λ
= L/τ = 1.5.
Solution
The emf coefficient K
E
(14.10) is: K
E
= 0.98 – 0.005⋅2 = 0.97
The airgap apparent power S
gap
(14.3) is
© 2002 by CRC Press LLC
Author: Ion Boldea, S.A.Nasar………… ………
VA1003.63
92.092.0
105597.0
cos
P
KIVK3S
3
3
nn
n
En11Egap
⋅=
⋅
⋅⋅
=
ηϕ
==
Esson’s constant C
0
is obtained from Figure 14.14 for p
1
= 2 and S
gap
=
63.03⋅10
3
VA: C
0
= 222⋅10
3
J/m
3
.
For an airgap flux density B
g
= 0.8T, K
w1
= 0.955, α
i
= 0.74, K
f
= 1.08
(teeth saturation coefficient 1 + K
st
= 1.5, Figure 4.13). The specific current
loading A
1
is (14.17).
m/A10876.36
8.0955.074.008.1
10222
BKK
C
A
3
2
3
g
2
1wif
0
1
⋅=
π⋅⋅⋅
⋅
=
πα
=
with λ = 1.5 from (14.20) stator internal diameter D
is
is obtained.
m2477.01003.63
50
2
10222
1
5.12
22
D
3
3
3
is
=⋅⋅⋅
⋅
⋅
⋅
⋅
=
The stack length L (14.19) is
m2917.0
22
2477.05.1
p2
D
L
1
is
=
⋅
⋅π⋅
=
π
λ=
with j
con
= 6⋅10
6
A/m, K
fill
= 0.5, B
ts
= B
cs
= 1.6 T, the stator slot height h
s
is
(14.21).
m10584.24
5.0106
6.1
8.0
10876.36
h
3
6
3
s
−
⋅=
⋅⋅⋅
⋅
=
The back iron height h
cs
(14.22) is
m1036
6.1
8.0
222
2477.074.0
B
B
p2
D
2
h
3
cs
g
1
isi
cs
−
⋅≈⋅
⋅⋅
⋅π⋅
=
πα
=
The external stator diameter D
out
becomes
() ( )
m3688.0036.0024584.022477.0hh2DD
scsisout
=++=++=
With N
s
= 48 slots/stator and a slot aspect ratio K
aspect
= 3.03, the value of
slot height h
s
(14.30) is
m0246.0
6.1
8.0
1
48
2477.0
03.3
B
B
1
N
D
Kh
ts
g
s
is
aspects
=
−π=
−
π
=
About the same value of h
s
as above has been obtained. It is interesting to
calculate the approximate value of the specific tangential force σ
tan
.
© 2002 by CRC Press LLC
Author: Ion Boldea, S.A.Nasar………… ………
224
2
3
1
1
is
is
n
tan
cm/N246.1m/N10246.1
502
2
2477.02917.0
2
1055
f2
p
L
2
D
D
P
=⋅=
=
π
⋅
⋅⋅
π
⋅
=
π
π
≈σ
This is not a high value and the slot aspect ratio K
aspect
= h
s
/b
s
= 3.03 is a
clear indication of this situation.
Apparently the machine stator internal diameter may be reduced by
increasing A
1
(in fact, C
0
is Esson’s constant). For the same λ, the stack length
will be reduced, while the stator external diameter will also be slightly reduced
(the back iron height h
cs
decreases and the slot height increases).
Given the simplicity of the above analytical approach further speculations
on better (eventually optimized) designs are considered inappropriate here.
14.10 THE ROTOR TANGENTIAL STRESS DESIGN CONCEPT
The rotor tangential stress σ
tan
(N/m
2
) may be calculated from the motor
torque T
e
.
()
()
2
isis
en
tan
m/N
DLD
2T
⋅π
⋅
=σ
(14.33)
The electromagnetic torque T
en
is approximately
()
n1
n
mec
n1
en
S1f2
P
p
1Pp
T
−π
+
≈
(14.34)
P
n
is the rated motor power; S
n
= rated slip.
The rated slip is less than 2 to 3% for most induction motors and the
mechanical losses are around 1% of rated power.
1
1
n
1
n1
en
f
p
P1641.0
98.0f2
01.1Pp
T ⋅=
π
⋅
≈
(14.35)
Choosing σ
tan
in the interval 0.2 to 5 N/cm
2
or 2,000 to 50,000 N/m
2
, we
may use (14.33) directly with
is
1
D
Lp2
π
=λ
to determine the internal stator
diameter.
3
1
1
n
tan
2
1
is
f
p
P1641.0
p4
D
⋅⋅
λσπ
=
(14.36)
No apparent need occurs to adopt at this stage efficiency and power factor
values for rated load.
We may now adopt the no-load value of airgap flux density B
g0
,
© 2002 by CRC Press LLC
Author: Ion Boldea, S.A.Nasar………… ………
()
sc1
01w10
0g
K1gKp
IKW23
B
+π
µ
=
(14.37)
where the no load current I
0
and the number of turns/phase are unknown and the
airgap g, Carter’s coefficient K
c
, and saturation factor K
s
are assigned pertinent
values.
(
)
[]
()
[]
2pfor ;m10P012.01.0g
1pfor ;m10P02.01.0g
1
3
3
n
1
3
3
n
≥⋅+≈
=⋅+≈
−
−
(14.38)
Typical values of airgap are 0.35, 0.4, 0.45, 0.5, 0.55 … mm, etc. Also, K
c
≈ (1.15 – 1.35) for semiclosed slots and K
c
= 1.5 – 1.7 for open stator slots
(large power induction motors). The saturation factor is typically K
s
= 0.3 – 0.5
for p
1
≥ 2 and larger for 2p
1
= 2.
The airgap flux density B
g
is
(
)
()
()
()
82pfor T85.075.0B
62pfor T8.07.0B
42pfor T75.065.0B
22pfor T7.05.0B
1g
1g
1g
1g
=−=
=−=
=−=
=−=
(14.39)
The larger values correspond to larger motors.
The product, W
1
I
0
, is thus obtained from (14.37). The number of turns W
1
may be calculated from the emf E
1
(14.12 and (14.13).
gisi1wf1
11
1wf1
1
1
LBDKKf4
2pE
KKf4
E
W
πα
=
φ
= (14.40)
with W
1
I
0
and W
1
known, the no load (magnetization) current I
0
may be
obtained. The airgap active power P
gap
is
T1E
1
1
engap
IVK3
p
f2
TP =
π
=
(14.41)
where I
T
is the stator current torque component (in phase with E
1
). With I
T
determined from (14.41), we may now calculate the stator rated current I
1n
.
2
T
2
0n1
III +≈
(14.42)
The rotor bar current (for a cage rotor) I
b
is
r
T1w1
b
N
IKmW2
I
≈
(14.43)
N
r
– number of rotor slots, m – number of stator phases.
We may now check the product η
n
cosϕ
1n
.
© 2002 by CRC Press LLC
Author: Ion Boldea, S.A.Nasar………… ………
1
IV3
P
cos
n11
n
nn
<=ϕη
(14.44)
The linear current loading A
1
may be also checked,
is
n11
1
D
ImW2
A
π
=
(14.45)
and eventually compared with data from existing similar motors.
With all these data available, the sizing of stator and rotor slots and their
windings is feasible. Then the machine reactances and resistances and the
steady-state performance may be calculated. Knowing the motor geometry and
the loss breakdown, the thermal aspects (design) may be approached. Finally, if
the temperature rise or other performance are not satisfactory, the design
process is repeated.
Given the complexity of such an enterprise, some coherent methodologies
are in order. They will be developed in subsequent chapters.
Example 14.2 Tangential stress
Let us consider the motor data of Example 14.1, adopt σ
tan
= 1.5⋅10
4
N/m
2
,
and determine the values of D
is
, L, W
1
, I
0
, I
1n
, η
n
cosϕ
n
.
Solution
With p
1
= 2, P
n
= 55 kW, f
1
= 50 Hz, λ = 1.5, from (14.36),
m2352.0
50105.15.1
210551641.024
D
3
42
3
is
=
⋅⋅⋅π
⋅⋅⋅⋅⋅
=
The stack length L is
m277.0
22
2352.0
5.1
p2
D
L
1
is
=
⋅
⋅π
=
π
λ=
with B
g
= 0.8, K
f
= 1.08, α
i
= 0.74, K
w1
= 0.955, K
E
= 0.97, and from (14.40),
the number of turns per phase W
1
is
phase/turns36
8.0277.02352.074.0955.008.1504
22
3
400
.970
W
1
=
⋅⋅⋅π⋅⋅⋅⋅⋅
⋅⋅
⋅
=
The rated electromagnetic torque T
en
(14.35) is
Nm02.361
50
2
10551641.0
f
p
P1641.0T
3
1
1
nen
=⋅⋅⋅=⋅=
Now, from (14.41), the torque current component I
T
is
© 2002 by CRC Press LLC