Bài giảng Tiền tệ, ngân hàng và thị trường tài chính 1 - Chương 2: Lạm phát
Bạn đang xem bản rút gọn của tài liệu. Xem và tải ngay bản đầy đủ của tài liệu tại đây (1.8 MB, 36 trang )
BỘ MƠN TÀI CHÍNH - TIỀN TỆ
CHƯƠNG 2
LẠM PHÁT
FINANCE - MONETARY DEPARTMENT
CHAPTER 2
INFLATION
15
CHUẨN ĐẦU RA
Sau khi hoàn thành chương này, Người học có thể:
1. Giải thích được khái niệm lạm phát
2. Giải thích được nguyên nhân của lạm phát
3. Phân tích, đánh giá ở mức độ cơ bản các vấn đề về lạm phát
LEARNING OUTCOMES
Upon completion of this chapter, learners will be able to:
1. Explain the in ation de nition
2. Explain the causes of in ation
3. Critically analyze and discuss pertinent in ation issues, including
the interpretation of data in the context of the theorical models
16
BÀI TẬP THỰC HÀNH
• Tra cứu CPI của Việt Nam, tính tỷ lệ lạm phát hàng năm (YOY) từ
năm 2001 đến nay.
• Tìm M2 và tính tốc độ tăng trưởng M2 hàng năm (YOY) từ năm
2001 đến nay.
• Phân tích mối liên hệ tồn tại giữa lạm phát và tốc độ tăng cường của
cung tiền bằng cách vẽ đồ thị cho chúng.
•
•
•
•
•
•
•
Tìm CPI của Việt Nam, tính tỷ lệ lạm phát theo từng năm và từng tháng.
Vẽ đồ thị và so sánh các biến này này.
Phân tích xu hướng của Lạm phát.
Khi nào lạm phát ở mức cao nhất?
Khi nào lạm phát ở mức thấp nhất?
Việt Nam có giảm phát khơng? Khi nào?
Việt Nam có siêu lạm phát khơng? Khi nào?
Website:
/> /> /> /> />
WEB EXERCISES
Go to
• Look up the Vietnamese CPI,
calculate the In ation rate year
over year(YOY) from 2001 until
now.
• Find M2 and calculate the M2
growth rate year over year (YOY)
from 2001 until now.
• Analyze the association exists
between in ation and the growth
rate of the money supply by
graphing them.
/>d=217
and nd Vietnamese CPI, calculate
the in ation rate year over year and
month to month with excel.
Graph and compare these data.
▪ Has in ation increased or
decreased since 1996?
▪ When was in ation at its highest?
▪ When was in ation at its lowest?
▪ Have we ever had a period of
de ation? If so, when?
▪ Have we ever had a period of
hyperin ation? If so, when?
Useful website:
/> /> /> /> />
17
BÀI TẬP THỰC HÀNH (WEB EXERCISES)
Bài 1: Tiếp cận số liệu thực tế của Mỹ
•
Biết: Cơng thức tính vịng quay của Tiền là GDP/M1.
•
Truy cập www.research.stlouisfed.org/fred2 và tìm số liệu GDP.
•
Truy cập www.federalreserve.gov/Releases/h6/Current/ và tìm số liệu M1.
•
u cầu tính vòng quay tiền của Mỹ và so sánh theo thời gian.
Bài 2: Tiếp cận số liệu thực tế của một quốc gia
•
Biết: Cơng thức tính vịng quay của Tiền là GDP/M1.
•
Truy cập và tìm số liệu GDP và M1 của một quốc gia.
•
u cầu tính vịng quay tiền của của quốc gia đó và so sánh theo thời gian.
WEB EXERCISES
•
The formula for computing the velocity of money is GDP/M1.
•
Go to www.research.stlouisfed.org/fred2 and look up the GDP.
•
Next go to www.federalreserve.gov/Releases/h6/Current/ and find M1.
•
Compute the most recent year’s velocity of money and compare it to its
level in 2002.
•
Has it risen or fallen? Suggest reasons for its change since that time.
•
The formula for computing the velocity of money is GDP/M1.
•
Go to />
•
Look up the GDP and find M1 for one country.
•
Compute the most recent year’s velocity of money and compare it to its
level in 2002. Has it risen or fallen? Suggest reasons for its change since
that time.
18
LẠM PHÁT
“Lạm phát: Sự tăng liên tục trong mức giá chung”
• Tiền mất giá khi giai đoạn có lạm phát.
• Siêu lạm phát: Tỷ lệ lạm phát vượt quá 50% /tháng.
o Mức giá chung: Mức giá trung bình của hàng hóa và dịch vụ trong một nền kinh tế.
o Tỷ lệ lạm phát: % thay đổi của mức giá chung, thơng thường, đo bằng phần trăm
thay đổi hằng năm.
INFLATION
•
INFLATION: A CONTINUAL INCREASE IN THE PRICE LEVEL
•
Money losses value during inflation
•
Hyperinflation: an extreme inflation in which the inflation rate
exceeds 50% per month.
o Price level (aggregate price level): the average price of goods and
services in an economy.
o Inflation rate The rate of change of the price level, usually measured as
a percentage change per year.
19
LẠM PHÁT
Lạm phát: không phải là hiện tượng giá cao
Lạm phát: không phải là một cú sốc giá.
INFLATION: A CONTINUAL
INCREASE IN THE PRICE LEVEL
In ation is not high prices and in ation is not a jump in prices.
20
LẠM PHÁT VÀ CUNG TIỀN
Đồ thị: Mức giá chung và cung tiền trong
nền kinh tế Mỹ, giai đoạn 1950-2011
Giá cả và cung tiền tăng cùng
nhau, cho thấy sự gia tăng liên tục
của cung tiền có thể là nguyên
nhân quan trọng của việc tăng
liên tục trong mức giá chung.
The price level and the money supply generally rise
together, indicating that a continuing increase in the
money supply might be an important factor in causing
the continuing increase in the price level.
Nguồn: www.stls.frb.org/fred/data/gdp/gdpdef; www.federalreserve.gov/releases/h6/hist/h6hist10.txt.
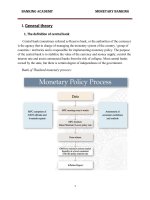
WHAT EXPLAINS INFLATION?
Aggregate Price Level and the
Money Supply in the
United States, 1950–2011
The price level and the money
supply generally rise together,
indicating that a continuing
increase in the money supply
might be an important factor in
causing the continuing increase in
the price level.
Sources: Based on www.stls.frb.org/fred/data/gdp/gdpdef;
www.federalreserve.gov/releases/h6/hist/h6hist10.txt.
21
LẠM PHÁT VÀ CUNG TIỀN
Milton Friedman, nhà kinh tế đạt giải Nobel đã khẳng định:
“Lạm phát luôn luôn và ở đâu cũng là hiện tượng tiền tệ”
“In ation is always and everywhere a monetary phenomenon.”
Đồ thị cho thấy sự tồn tại của
mối quan hệ thuận giữa lạm
phát và tỷ lệ tăng cung tiền. Các
quốc gia có tỷ lệ lạm phát cao
nhất cũng là những quốc gia có
tốc dộ tang trưởng tiền cao nhất.
Nguồn: International Financial Statistics. www.imfstatistics.org/imf.
WHAT EXPLAINS INFLATION?
Milton Friedman, a Nobel laureate in economics:
“Inflation is always and everywhere a monetary phenomenon.”
A positive association exists
between in ation
and the
growth rate of the money
supply: The countries with the
highest in ation rates are also
the ones with the highest
money growth rates.
Source: Based on International Financial Statistics. www.imfstatistics.org/imf.
22
HỌC THUYẾT SỐ LƯỢNG TIỀN TỆ
CỦA FISHER.
M* V=P*Y
Phương trình trao đổi
Số lượng tiền nhân với số vòng quay của tiền bằng thu nhập danh nghĩa (GDP)
•
•
•
•
•
P là mức giá chung
Y là tổng sản lượng
P*Y là tổng thu nhập danh nghĩa (GDP)
M là số lượng tiền
V là vòng quay của tiền, là trung bình của số lần tiền quay vịng trong nền
kinh tế. Nói cách khác, V là số lần trung bình mà một đồng tiền được sử
dụng để mua tổng số lượng hàng hóa và dịch vụ cuối cùng
FROM THE EQUATION OF
EXCHANGE TO THE FISHER’S
QUANTITY THEORY OF MONEY
The Equation of Exchange
M* V=P*Y
The quantity of money multiplied by the number of times that this
money is spent in a given year must equal nominal income.
•
•
•
•
•
P is the price level
Y is the aggregate output (income)
P*Y: the total amount of spending on nal goods and services produced
in the economy (GDP)
M: the total quantity of money M (the money supply)
V: velocity of money, the average number of times per year (turnover)
that a dollar is spent in buying the total amount of goods and services
produced in the economy.
23
HỌC THUYẾT SỐ LƯỢNG TIỀN TỆ
CỦA FISHER.
• Tốc độ quay vịng của tiền là hằng số trong ngắn hạn:
• Tổng sản lượng tự nhiên là hằng số:
Vì thế:
• Số lượng tiền thay đổi chỉ ảnh hưởng đến mức giá.
• Sự thay đổi của mức giá chỉ có nguyên nhân duy nhất từ thay đổi của số lượng
tiền.
Trường phái kinh tế cổ điển dựa trên lý thuyết số lượng tiền tệ để giải thích sự
vận động của mức giá chung. Trong quan điểm của trường phái này: Sự thay
đổi của số lượng tiền dẫn đến sự thay đổi tương ứng của mức giá.
FROM THE EQUATION OF EXCHANGE
TO THE FISHER’S QUANTITY THEORY
OF MONEY AND PRICE LEVEL
•
Velocity fairly constant in short run:
•
Aggregate output at full-employment level:
Then:
•
Changes in money supply a ect only the price level
•
Movement in the price level results solely from change in the quantity
of money
Classical economists relied on the quantity theory of money to explain
movements in the price level. In their view, changes in the quantity of money
lead to proportional changes in the price level .
24
HỌC THUYẾT SỐ LƯỢNG TIỀN TỆ
CỦA FISHER
• Ví dụ:
Nếu tổng sản lượng là $10 nghìn tỷ, vịng quay tiền là 5, cung tiền là $2 nghìn tỷ,
Thì
ì
=
ì
ỷ∗
ỷ
=1
Mức giá chung bằng 1.0.
Khi cung tiền tăng gấp đơi, lên đến $4 nghìn tỷ, thì mức giá chung cũng tăng hai
lần, chạm mức 2.0,
ì
=
Vì:
ì
ỷ∗
ỷ
=2
FROM THE EQUATION OF EXCHANGE
TO THE FISHER’S QUANTITY THEORY
OF MONEY AND PRICE LEVEL
• For example:
If aggregate output is $10 trillion, velocity is 5, and the money supply is $2
trillion,
Then
=
∗
=1
the price level equals 1.0.
When the money supply doubles to $4 trillion, the price level must also
double to 2.0,
Because
=
∗
=2
25
LÝ THUYẾT SỐ LƯỢNG TIỀN VÀ LẠM PHÁT
Lý thuyết số lượng tiền cũng chính là lý thuyết lạm phát.
Trong đó, tỷ lệ lạm phát bằng với tỷ lệ tăng trưởng cung
tiền trừ đi tỷ lệ tăng trưởng của sản lượng sản xuất.
• Viết lại phương trình trao đổi như sau:
•
Suy ra:
• Vì vịng quay tiền được giả định là hằng số, tỷ lệ tăng của nó bằng 0.
• Suy ra:
The quantity theory of in ation indicates that the in ation rate equals the growth rate of the money supply
minus the growth rate of aggregate output
QUANTITY THEORY
AND INFLATION
The quantity theory of in ation indicates that the in ation rate equals the
growth rate of the money supply minus the growth rate of aggregate output.
The equation of exchange
• Rewrite the equation of exchange as follows:
• Subtracting from both sides of the preceding equation, and recognizing
that the in ation rate, is the growth rate of the price level,
• Since velocity is assumed constant, its growth rate is zero, so the quantity
theory of money is also a theory of inflation:
26
LÝ THUYẾT SỐ LƯỢNG TIỀN
VÀ LẠM PHÁT
Ví dụ:
Nếu tổng sản lượng tăng 3% / năm; Tỷ lệ tăng trưởng cung tiền là 5%/năm
• Thì tỷ lệ lạm phát là 2% (= 5% - 3%).
Nếu Ngân hàng Trung ương tăng cung tiền lên 10%/năm
• Thì tỷ lệ lạm phát sẽ tăng lên 7%(= 10% - 3%)
Lý thuyết số lượng tiền giải thích rõ lạm phát trong dài hạn nhưng
khơng phù hợp trong ngắn hạn
QUANTITY THEORY
AND INFLATION
For example
• If the aggregate output is growing at 3% per year.
• The growth rate of money is 5%.
• Then,
• In ation is 2% (= 5% - 3%).
• If the Federal Reserve increases the money growth rate to 10%.
• Then,
• the quantity theory of in ation indicates that the in ation rate will rise to
7%(= 10% - 3%).
Remark:
The quantity theory of money is a good theory of inflation in the long run, but not in the short run.
27
MỐI QUAN HỆ GIỮA
LẠM PHÁT VÀ TĂNG TRƯỞNG CUNG TIỀN
Nguồn: Bảng (a), Milton Friedman and Anna Schwartz, Monetary trends in the United States and the United
Kingdom: Their Relation to Income, Prices, and Interest Rates, 1867–1975, Federal Reserve Economic Database
(FRED), Federal Reserve Bank of St. Louis, and Bureau of Labor
Statistics at Bảng (b), International Financial Statistics. International
Monetary Fund, www.imfstatistics.org/imf/.
RELATIONSHIP BETWEEN
INFLATION AND MONEY GROWTH
Sources: For panel (a), Milton Friedman and Anna Schwartz, Monetary trends in the United States and
the United Kingdom: Their Relation to Income, Prices, and Interest Rates, 1867–1975, Federal Reserve
Economic Database (FRED), Federal Reserve Bank of St. Louis,
and Bureau of Labor Statistics at
For panel (b), International Financial Statistics.
International Monetary Fund, www.imfstatistics.org/imf/.
28
LẠM PHÁT VÀ TĂNG TRƯỞNG CUNG TIỀN
HÀNG NĂM TẠI M GIAI ĐOẠN 1965–2010
Sources: FRED, Federal
Reserve Economic Data,
Federal Reserve Bank of
St. Louis; Bureau of
Labor Statistics,
ouisfe
d.org/fred2/categories/
25; accessed September
30, 2010.
ANNUAL U.S. INFLATION AND
MONEY GROWTH RATES, 1965–2010
Sources: FRED, Federal
Reserve Economic Data,
Federal Reserve Bank of
St. Louis; Bureau of
Labor Statistics,
ouisfe
d.org/fred2/categories/
25; accessed September
30, 2010.
29
MỐI QUAN HỆ GIỮA
LẠM PHÁT VÀ THÂM HỤT NGÂN SÁCH
• Thâm hụt ngân sách là một nguyên nhân của lạm phát.
• Các phương thức tài trợ chi tiêu Chính phủ gồm:
▪ Tăng thu thuế
▪ Phát hành trái phiếu Chính phủ
▪ In tiền (lưu ý: Ở nhiều quốc gia, chính phủ khơng có quyền phát hành
tiền để đảm bảo các khoản chi của Chính Phủ)
• Tài trợ thâm hụt ngân sách bằng cách phát hành trái phiếu bán cho công chúng,
sẽ khơng có tác động lên lượng tiền cơ sở và vì thế khơng làm tăng cung tiền,
và ngược lại.
• Tài trợ thâm hụt ngân sách bằng cách phát hành tiền sẽ dẫn đến lạm phát kéo
dài.
•
Thâm hụt ngân sách là tình trạng số thu thấp hơn số chi và ngược lại đối với thặng dư ngân sách.
BUDGET DEFICITS AND INFLATION
• Budget de cits can be an important source of in ationary monetary policy.
• Methods of nancing government spending (the government budget
constraint) are:
▪ raise revenue by levying taxes
▪ go into debt by issuing government bonds
▪ create money however, and in many other countries, the government
does not have the right to issue currency to pay for its bills.
➢ If the government deficit is financed by an increase in bond holdings by the
public, there is no effect on the monetary base and hence on the money supply.
➢ But if the deficit is not financed by increased bond holdings by the public, the
monetary base and the money supply increase.
➢ Financing a persistent deficit by money creation will lead to a sustained inflation
•
A budget de cit or surplus
re ects an imbalance between
expenditures and revenues.
•
30
A budget deficit is the excess of government
outlays over receipts taken in from taxes, fees,
and charges levied by government authorities.
LẠM PHÁT CHI PHÍ ĐẨY
Một cú sốc tăng chi phí làm dịch
chuyển đường tổng cung ngắn hạn
lên và sang trái sang AS2, và nền
kinh tế chuyển sang điểm 2’. Để giữ
tổng sản lượng tại YP và giảm tỷ lệ
thất nghiệp, các nhà hoạch định
chính sách tăng tổng cầu, làm dịch
chuyển đường tổng cầu sang AD2 để
nền kinh tế sẽ nhanh chóng quay trở
lại sản lượng tiềm năng tại điểm 2 và
tỷ lệ lạm phát tăng lên 2. Sự dịch
chuyển lên và xuống trái của đường
tổng cung ngắn hạn đến AS3 và do
đó khiến các nhà hoạch định chính
sách tiếp tục tăng tổng cầu, dẫn đến
lạm phát tiếp tục gia tăng và tiếp tục
đẩy chi phí
COST-PUSH INFLATION
A cost-push shock (which acts
like a temporary negative supply
shock) shifts the short-run
aggregate supply curve up and to
the left to AS2, and the economy
moves to point 2´. To keep
aggregate output at YP and lower
the
unemployment
rate,
policymakers shift the aggregate
demand curve to AD2 so that the
economy will return quickly to
potential output at point 2 and an
in ation rate of p2. Further
upward and leftward shifts of the
short-run aggregate supply curve
to AS3 and so on cause the
policymakers
to
keep
on
increasing aggregate demand,
leading to a continuing increase
in
in ation—a
cost-push
in ation.
31
LẠM PHÁT CẦU KÉO
Theo đuổi mục tiêu thất
nghiệp quá thấp (tương
ứng, mục tiêu sản lượng
Yt quá cao so với mức
tiềm năng) khiến tổng cầu
bị đẩy cao, đường AD1
dịch chuyển sang AD2
sang AD3, v.v. Bởi vì tỷ lệ
thất nghiệp thấp hơn mức
lãi suất tự nhiên, tiền
lương sẽ tăng và đường
tổng cung ngắn hạn sẽ
dịch chuyển lên và sang
trái từ AS1 đến AS2 đến
AS3, v.v. Kết quả là lạm
phát tiếp tục gia tăng.
DEMAND-PULL INFLATION
Too low an unemployment
target (too high an output
target of YT) causes the
government
to
increase
aggregate demand, shifting
the AD curve rightward from
AD1 to AD2 to AD3 and so on.
Because the unemployment
rate is below the natural rate
level, wages will rise and the
short-run aggregate supply
curve will shift up and
leftward from AS1 to AS2 to
AS3 and so on. The result is a
continuing rise in inflation
known as a demand-pull
inflation.
32
CHÍNH SÁCH TIỀN TỆ _ KIỂM SỐT
LẠM PHÁT
Đối với sốc cầu
Có hai cách:
• Khơng cần can thiệp vào nền kinh tế.
• Áp dụng các chính sách ổn định các hoạt động kinh tế
và lạm phát trong ngắn hạn.
Lưu ý: Trong trường hợp sốc cầu, khơng có sự đánh đổi
giữa mục tiêu theo đuổi sự ổn định giá cả với sự ổn định
nền kinh tế.
Đối với sốc cung
dài hạn
Có hai cách
• Khơng cần can thiệp vào nền kinh tế.
• Áp dụng các chính sách ổn định lạm phát.
MONETARY POLICY THEORY
Response to an
Aggregate
Demand Shock
Policy makers can respond to this shock in two possible
ways:
• No policy response
• Policy stabilizes economic activity and in ation in the
short run.
• In the case of aggregate demand shocks, there is no
tradeo between the pursuit of price stability and
economic activity stability
Response to a
Permanent
Supply Shock
There are two possible policy responses to a
permanent supply shock:
- No policy response (Figure: Permanent Supply
Shock: No Policy Response)
- Policy stabilizes inflation
No tradeoff
33
CHÍNH SÁCH TIỀN TỆ _ KIỂM SỐT
LẠM PHÁT
Đối với sốc cung
tạm thời
• Khi nền kinh tế gặp sốc cung ngắn, Nhà điều hành cần tính
đến sự đánh đổi trong ngắn hạn giữa hai mục tiêu: ổn định
lạm phát với ổn định hoạt động kinh tế.
• Có ba cách:
• Khơng cần can thiệp vào nền kinh tế.
• Áp dụng chính sách ổn định giá cả, lạm phát trong
ngắn hạn.
• Áp dụng các chính sách ổn định hoạt động trong nền
kinh tế trong ngắn hạn.
MONETARY POLICY THEORY
Response to a
Temporary
Supply Shock
• When a supply shock is temporary,
policymakers face a short-run tradeoff
between stabilizing inflation and
economic activity
• Policymakers can respond to the
temporary supply shock in three
possible ways:
oNo policy response
oPolicy stabilizes inflation in the short
run
oPolicy stabilizes economic activity in
the short run
34
SỐC CẦU: KHÔNG CẦN CAN THIỆP
Một cú sốc tổng cầu làm dịch
chuyển đường tổng cầu sang
trái từ AD1 sang AD2 và
chuyển nền kinh tế từ điểm 1
sang điểm 2, trong đó tổng
sản lượng giảm xuống Y2
trong khi lạm phát giảm
xuống π2. Với sản lượng dưới
mức tiềm năng, đường tổng
cung ngắn hạn chuyển xuống
AS3 và nền kinh tế chuyển
sang điểm 3, nơi sản lượng
quay trở lại tại YP, nhưng lạm
phát đã giảm xuống π3.
AGGREGATE DEMAND SHOCK: NO POLICY
RESPONSE
An aggregate demand shock
shifts
the
aggregate
demand curve leftward from
AD1 to AD2 and moves the
economy from point 1 to
point 2, where aggregate
output falls to Y2 while
in ation falls to p2. With
output below potential, the
short-run aggregate supply
curve shifts down to AS3,
and the economy moves to
point 3, where output is
back at YP, but in ation has
fallen to p3.
35
SỐC CẦU: CHÍNH SÁCH ỔN ĐỊNH HOẠT ĐỘNG
KINH TẾ VÀ LẠM PHÁT TRONG NGẮN HẠN
Các nhà hoạch định chính sách
có thể theo đuổi các chính sách để
tăng tổng cầu về mức ban đầu và
đưa nền kinh tế trở lại trạng thái
trước cú sốc. Ngân hàng trung
ương thực hiện điều này bằng
cách nới lỏng chính sách tiền tệ
bằng cách cắt giảm lãi suất thực
ở bất kỳ tỷ lệ lạm phát nào. Hành
động này kích thích chi tiêu đầu
tư và tăng tổng sản lượng được
yêu cầu ở bất kỳ tỷ lệ lạm phát
nhất định nào, do đó làm dịch
chuyển đường AD sang phải.
AGGREGATE DEMAND SHOCK: POLICY
STABILIZES OUTPUT AND INFLATION IN
THE SHORT RUN
Policymakers can eliminate both the
output gap and the inflation gap in the
short run by pursuing policies to
increase aggregate demand to its
initial level and return the economy to
its preshock state. The central bank
does this by autonomously easing
monetary policy by cutting the real
interest rate at any given inflation
rate. This action stimulates investment
spending and increases the quantity of
aggregate output demanded at any
given inflation rate, thereby shifting the
AD curve to the right.
36
SỐC CẦU: CHÍNH SÁCH ỔN ĐỊNH SẢN
LƯỢNG VÀ LẠM PHÁT TRONG NGẮN HẠN
Trong trường hợp sốc tổng cầu, khơng có sự đánh đổi giữa việc theo đuổi ổn
định giá cả và ổn định hoạt động kinh tế. Tập trung vào việc ổn định lạm phát
dẫn đến phản ứng chính sách tiền tệ chính xác để ổn định hoạt động kinh tế.
Khơng có xung đột tồn tại giữa các mục tiêu kép là ổn định lạm phát và hoạt
động kinh tế.
Sốc cầu làm dịch chuyển đường tổng cầu dịch chuyển sang trái từ AD1 sang AD2 và cân bằng kinh
tế dịch chuyển từ điểm 1 sang điểm 2, tại đó sản lượng sản xuất giảm xuống mức Y2 trong khi lạm
phát giảm đến P2. Chính sách tiền tệ mở rộng làm giảm lãi suất thực ở mọi tỷ lệ lạm phát và dịch
chuyển đường cầu quay trở lại AH1, tổng cung quay trở về mức tiềm năng và lạm phát quay về với
mức lạm phát mục tiêu đã định, ở điểm 1.
AGGREGATE DEMAND SHOCK: POLICY
STABILIZES OUTPUT AND INFLATION IN
THE SHORT RUN
In the case of aggregate demand shocks, there is no tradeo
between the
pursuit of price stability and economic activity stability. A focus on
stabilizing in ation leads to exactly the right monetary policy response to
stabilize economic activity. No con ict exists between the dual objectives of
stabilizing in ation and economic activity, which is referred to as the divine
coincidence.
An aggregate demand shock shifts the aggregate demand curve leftward from AD1 to
AD2 and moves the economy from point 1 to point 2, where aggregate output falls to Y2
while inflation falls to p2. An autonomous easing of monetary policy lowers the real
interest rate at any given inflation rate and shifts the AD curve back to AD1. Aggregate
output returns to potential at point 1 and inflation returns to its target level.
37
SỐC CUNG DÀI HẠN: KHÔNG CAN THIỆP
Một cú sốc cung dài hạn làm giảm sản lượng
tiềm năng từ YP1 đến YP3 và đường tổng cung
dài hạn dịch chuyển sang trái từ LRAS1 đến
LRAS3, trong khi đường tổng cung ngắn hạn
chuyển lên từ AS1 đến AS2. Nền kinh tế chuyển
sang điểm 2, với lạm phát tăng lên 2 và sản
lượng giảm xuống Y2. Do tổng sản lượng vẫn
cao hơn tiềm năng, đường tổng cung ngắn hạn
sẽ tiếp tục dịch chuyển cho đến khi khoảng
cách đầu ra bằng 0 khi đạt AS3. Nền kinh tế
chuyển đến điểm 3, trong đó lạm phát tăng lên
p3 trong khi sản lượng giảm xuống YP3.
PERMANENT SUPPLY SHOCK:
NO POLICY RESPONSE
A permanent negative supply
shock decreases potential output
from YP1 to YP3 , and the longrun aggregate supply curve shifts
to the left from LRAS1 to LRAS3,
while the short-run aggregate
supply curve shifts upward from
AS1 to AS2. The economy moves
to point 2, with inflation rising to
p2 and output falling to Y2.
Because aggregate output is still
above potential, the short-run
aggregate supply curve would
keep on shifting until the output
gap is zero when it reached AS3.
The economy moves to point 3,
where inflation rises to p3 while
output falls to YP3.
38
SỐC CUNG DÀI HẠN: CHÍNH SÁCH ỔN ĐỊNH LẠM PHÁT
Khơng có sự đánh đổi giữa hai mục tiêu:
ổn định lạm phát và ổn định kinh tế
Để tổng cầu dịch chuyển sang AD3,
NHTW áp dụng chính sách thắt chặt tiền
tệ bằng cách tăng lãi suất thực ở mọi tỷ lệ
lạm phát, làm cho chi đầu tư giảm và làm
giảm tổng cầu ở bất kỳ tỷ lệ lạm phát nào.
Một cú sốc cung tiêu cực vĩnh viễn làm
giảm sản lượng tiềm năng từ YP1 đến YP3
và đường cung tổng hợp dài hạn dịch
chuyển sang trái từ LRAS1 đến LRAS3,
trong khi đường tổng cung ngắn hạn
chuyển lên từ AS1 đến AS2. Việc thắt chặt
chính sách tiền tệ tự động làm dịch chuyển
đường tổng cầu sang trái sang AD3, do đó
giữ tỷ lệ lạm phát ở
ở điểm 3.
PERMANENT SUPPLY SHOCK:
POLICY STABILIZES INFLATION
The divine coincidence still remains true when a permanent supply shock
occurs: There is no tradeo between the dual objectives of stabilizing
in ation and economic activity.
To shift the aggregate demand to AD3, the
monetary authorities would autonomously
tighten monetary policy by increasing the
real interest rate at any given inflation rate,
thus causing investment spending to fall and
lowering aggregate demand at any given
inflation rate.
A permanent negative supply shock
decreases potential output from YP1 to YP3
, and the long-run aggregate supply curve
shifts to the left from LRAS1 to LRAS3, while
the short-run aggregate supply curve shifts
upward from AS1 to AS2. An autonomous
tightening of monetary policy shifts the
aggregate demand curve to the left to AD3,
thereby keeping the inflation rate at pT at
point 3.
39