Thermal enhancement of the intensity of fluorescent nuclear tracks in lithium fluoride crystals
Bạn đang xem bản rút gọn của tài liệu. Xem và tải ngay bản đầy đủ của tài liệu tại đây (3.59 MB, 7 trang )
Radiation Measurements 157 (2022) 106845
Contents lists available at ScienceDirect
Radiation Measurements
journal homepage: www.elsevier.com/locate/radmeas
Thermal enhancement of the intensity of fluorescent nuclear tracks in
lithium fluoride crystals
M. Sankowska *, P. Bilski, B. Marczewska
Institute of Nuclear Physics Polish Academy of Sciences, Krak´
ow, Poland
A R T I C L E I N F O
A B S T R A C T
Keywords:
FNTD
Photoluminescence
LiF
Track detectors
Lithium fluoride fluorescent nuclear track detectors (FNTD) irradiated with alpha-particles were subjected to
annealing at temperatures ranging up to 400 ◦ C. It was found that for the annealing temperatures between 200 ◦ C
and 300 ◦ C the intensity of fluorescent tracks increases. The maximum enhancement factor of 2.5 is reached for a
temperature of 290 ◦ C. For temperatures exceeding 300 ◦ C the intensity decreases and above 340 ◦ C the tracks
are not visible. The effect of track enhancement is permanent - no differences were observed for several weeks
after the thermal treatment. An interesting phenomenon is the influence of the particle fluence: with increasing
fluence the enhancement factor decreases and for the fluence around 2.9*107 cm− 2, the intensity of light
registered after heat treatment is lower than the initial one. It is still unclear what is the reason behind the
observed effect. It however seems probable that the mechanism involves transforming part of F centers into F2
centers. Nevertheless, the effect is promising, as it may lead to signal-to-noise ratio improvement and improved
measuring capabilities of LiF FNTDs.
1. Introduction
Photoluminescence of color centers in lithium fluoride (LiF) has been
studied for decades (Baldacchini, 2002), but the recent years brought a
new interest to this topic. The reasons are in new emerging applications
of LiF crystals for imaging radiation dose distributions at the micro
scopic level. One direction of these applications are measurements of
various parameters of proton beams (Marczewska et al., 2017; Mon
tereali et al., 2019; Nichelatti et al., 2020; Piccinini et al., 2017, 2020;
Vincenti et al., 2021). Another newly developed technique is fluorescent
imaging of single nuclear particle tracks (Bilski et al., 2018a, 2018b,
2019a, 2019b, 2020). This method was originally developed for Al2O3
crystals (Akselrod et al., 2006; Akselrod and Sykora, 2011; Greilich
et al., 2013), but recently successfully worked out also for LiF. Fluo
rescent nuclear track detectors (FNTD) based on LiF crystals were shown
to be capable of imaging tracks of energetic ions, alpha particles, pro
tons, and through secondary particles, even photons and neutrons.
The idea of this technique is based on the creation of color centers by
ionizing particles when passing through a crystal. Lattice defects pro
duced by radiation in LiF consist mainly of F centers (electrons trapped
by an anion vacancy) and their aggregates: F2 and F+
3 . While F centers do
not produce any photoluminescence, the excitation of F2/F+
3 centers
(which possess a common absorption band around 445 nm) with the
blue light leads to strong photoluminescent emission within two bands:
green (weaker, peaked near 525 nm, corresponding to F+
3 ) and red
(stronger, peaked near 670 nm, corresponding to F2) (Baldacchini,
2002). The red photoluminescence of LiF was exploited for obtaining
images of nuclear particle tracks (Bilski et al., 2018a).
LiF FNTDs are basically reusable. The heating of crystals at suffi
ciently high temperatures removes color centers and resets the intensity
of photoluminescence to the background level. Within the series of ex
periments aimed at optimizing conditions of such thermal treatment, we
found that the heating of previously irradiated crystals sometimes does
not remove the color centers, but quite oppositely increases the intensity
of the fluorescence, making the nuclear tracks much more clear and
better separated from the background. This unexpected finding, which
may lead to a substantial improvement of LiF FNTD measuring capa
bilities, motivated a more systematic investigation of this phenomenon,
and the present paper reports the obtained results.
2. Materials and methods
Lithium fluoride single crystals were grown with the Czochralski
method at IFJ PAN in Krak´
ow (Bilski et al., 2018a). As a starting material
* Corresponding author. Institute of Nuclear Physics PAN, ul. Radzikowskiego 152, 31-342, Krak´
ow, Poland.
E-mail address: (M. Sankowska).
/>Received 22 June 2022; Received in revised form 27 July 2022; Accepted 16 August 2022
Available online 20 August 2022
1350-4487/© 2022 The Authors. Published by Elsevier Ltd. This is an open access article under the CC BY license ( />
M. Sankowska et al.
Radiation Measurements 157 (2022) 106845
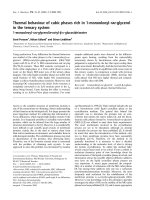
Fig. 1. Microscopic fluorescent images registered with the same LiF crystal (acquisition time 2 s) after annealing at gradually increasing temperatures. Samples
irradiated with Am-241 source (particle fluence around 1.60*104 cm− 2).
an undoped, pure LiF powder was used. The grown bulk crystals were
then cut with diamond saws into square plate samples of a standard size
of 4 × 4 × 1 mm. Samples were later polished with abrasive straps and
rinsed in acetone in an ultrasonic washer for 5 min. After that, samples
were pre-heated for 10 min at a temperature close to the melting point of
LiF (820–830 ◦ C) in argon atmosphere before the first use. This pro
cedure improves the surface quality of samples by removing small
scratches created during polishing and at the moment is routinely
applied in our laboratory to all LiF crystal samples.
The main experiments were carried out with the crystal samples
irradiated with alpha particles from two Am-241 sources (Eck
ert&Ziegler: AMRB5718 with activity 10.7 MBq and AMR14 with ac
tivity 40 kBq). Irradiations were carried out using special metal
collimators to ensure the same conditions for each sample and provide a
high number of tracks perpendicular to the sample’s surface. The used
collimators had, respectively, a thickness of 6 mm and a round hole with
a diameter of 2 mm for a source with an activity of 10.7 MBq and a
thickness of 2.5 mm and a round hole with a diameter of 1 mm for a
source with an activity of 40 kBq. The time of irradiation depended on
the desired fluence and the source used and varied from a few seconds to
several hours. Some additional exposures were performed with gamma
radiation from a Cs-137 source in the calibration laboratory of the IFJ
PAN.
After irradiation, microscopic images were taken using Nikon Eclipse
Ni–U fluorescent wide-field microscope with a CCD camera DS Qi-2. As
the excitation light source, a pE-100 illumination system with 440 nm
LEDs (CoolLED) was used together with band-pass filter ET445/30
(Chroma). For emission, a long-pass filter ET570lp (Chroma) was
applied. Most images were taken using a 100x TU Plan ELWD (NA 0.80)
objective lens. The field of view was limited by a diaphragm and had a
quasi-circular shape with a diameter of about 90 μm. Images of samples
irradiated with alpha particles were taken at depth of 3 μm beneath the
sample’s surface. For samples irradiated with gamma radiation, images
were taken at 5 μm beneath the sample’s surface. Computer analysis of
the obtained microscopic images was performed using ImageJ software
(with Fiji interface) (Schindelin et al., 2012). For observed tracks the
background signal was subtracted from the maximum intensity in a
track. The background signal was calculated as a modal value of in
tensity in the circle of a radius of 50 pixels (c.a. 3.5 μm) around a track.
As the final result a mean value of intensity of tracks after background
subtraction was used. To calculate the change in intensity, the results
after heat treatment were divided by the results obtained before
applying any post-irradiation annealing. This ratio will be later called
the enhancement factor. The particles’ angle of incidence has an impact
on tracks intensity. For that reason from all the observed tracks we used
only the ones with a circular shape as they originate from particles
almost perpendicular to the sample’s surface.
The photoluminescence emission spectra were measured using
Ocean Optics QE pro 00689 spectrometer mounted into a setup of a
Nikon Eclipse Ni–U fluorescent wide-field microscope instead of the
CCD camera. The spectral measurements were performed using a 5x TU
Plan Epi objective lens and a long-pass 510lp filter.
After the irradiations we waited at least 24 h before applying heat
treatment. The reason for this delay is the observed small increase in
tracks intensity during the first few hours after irradiation (even without
annealing). Post-irradiation heating of the samples was carried out using
the Linkam THMS600 heating stage. The heating of the crystals was
performed, depending on the experiment, in one of two ways:
Method 1: multi-step heating - a sample was submitted to a series of
subsequent heat treatments at increasing temperatures ranging from
room temperature up to 400 ◦ C with the step of 20 ◦ C.
Method 2: one-step heating to the set temperature. For each tem
perature another crystal sample was used. The temperature was varied
with the step of 10 ◦ C.
Fig. 2. Light intensity increase vs. temperature of annealing (heating the same
sample at increasing temperatures). Samples were irradiated with Am-241
source (particle fluence around 1.60*104 cm− 2). Error bars represent one
standard deviation.
2
M. Sankowska et al.
Radiation Measurements 157 (2022) 106845
Fig. 3. Tracks intensity increase - comparison between one-step heating and
successive heating. Samples irradiated with Am-241 source (particle fluence
around 1.60*104 cm− 2).
Fig. 4. Tracks intensity increase - heating time optimization. Samples irradi
ated with Am-241 source (particle fluence around 1.60*104 cm− 2).
enhancement for a given temperature, combined with the standard de
viation of the enhancement for all crystal samples after heat treatment at
290 ◦ C (measured separately to account for possible differences between
various samples). Results, presented in Fig. 3, are very similar to those
observed for Method 1. The biggest enhancement factor was observed
for 290 ◦ C, and this temperature was used as the standard in the further
measurements.
Another step that was undertaken to optimize the post-irradiation
heat treatment was testing the influence of the time of annealing on
the change in tracks intensity. We used a standard one-step heating
procedure to 290 ◦ C (Method 2) with annealing time varying between
10 s and 10 min.
Fig. 4 shows the relationship between the duration of the heat
treatment and the observed increase in tracks intensity. Values of in
tensity increase and uncertainties were determined analogously to the
heat treatment temperature optimization measurements. The effect gets
stronger with increasing time up to about 60 s. Above that time we
noticed only small changes, which did not show any strong trend and
were within the limits of uncertainty. As the measurements were con
ducted for different samples, it is safe to say that extending the time of
heat treatment above 120 s does not significantly change the strength of
the observed increase. For these reasons, we decided to continue using 3
min as our standard annealing time and be consistent with our previous
results. We also checked the effect of performing additional heating on a
sample which already underwent such treatment and found that the
increase of the track intensity remains unaffected.
What is important, the applied temperature treatment does not cause
any deterioration of track images due to migration of defects. Fig. 5
presents enlarged images of tracks acquired before and after 290 ◦ C
annealing. There is no blurring nor broadening of the track image.
Fig. 5c compares profiles measured along the lines perpendicular to the
tracks. The width of both tracks is similar. Even when crystals were
heated at higher temperatures and the tracks began to fade out, their
shape remained unchanged. This indicates low mobility of F2 centers,
even at elevated temperatures.
The results presented in the previous figures were obtained for
microscopic images that were taken directly after heating and cooling of
the samples. In everyday usage, however, we may need to perform
multiple measurements on the same sample and take pictures even after
a long time. FNTD is basically a non-destructive technique, except for
slight bleaching during readout. We checked that samples that were
submitted to the heat treatment also do not show any changes in the
In both methods crystal plates were placed on the heating stage at
room temperature and then heated to the set temperature with a heating
rate of 150 ◦ C/min. After reaching the desired temperature samples
were annealed for 3 min. After that time, the heating was turned-off and
samples were cooled, remaining on the heating stage for another 3 min.
Then they were removed from the heating stage and placed on the
aluminum plate to cool down quickly to room temperature. All spectral
and microscopic measurements were performed at room temperature.
3. Results and discussion
To determine the influence of the temperature treatment on the in
tensity of single-particle tracks, in the first step we subjected a LiF crystal
sample previously irradiated with alpha-particles (the fluence around
1.60*104 cm− 2) to the heat treatment according to the Method 1.
Microscopic images illustrating changes occurring after heat treatment
are presented in Fig. 1. The increase of the brightness of both, tracks and
the whole image is evident. A shortcoming of the heat treatment is the
enhancement of the background signal. It was observed for every tested
sample and depended strongly on the quality of the sample’s surface.
Fig. 2 presents the dependence of the observed increase of tracks
intensity on the temperature of the applied heat treatment. For each
temperature point, approximately 45 tracks from three different parts of
a crystal sample were measured. It can be seen that up to around 200 ◦ C
the intensity of the tracks remains the same. Above that temperature, we
noticed a significant increase in track intensity, as well as in background
light, with the maximum increase observed for temperatures around
280–300 ◦ C. For these temperatures, the intensity measured after
annealing was almost 2.5 times higher than the initial value. The in
crease in tracks intensity after heat treatment starts to diminish quickly
when we apply temperatures higher than 300 ◦ C. After annealing at
temperatures above 340 ◦ C, the tracks are no longer visible.
The same effect of the increase in tracks intensity was observed also
when samples were submitted to one-step heating (Method 2), instead of
a series of heatings to subsequent temperatures (Method 1). To choose
the most optimal temperature of the applied treatment, we performed
tests in a narrowed temperature range from 240 to 320 ◦ C, with a step of
10 ◦ C. For each temperature value, five images were taken at different
parts of a sample and the mean value of the track intensity was calcu
lated for approximately 60–80 tracks. The uncertainties were calculated
as standard deviations of the mean value of the track intensity
3
M. Sankowska et al.
Radiation Measurements 157 (2022) 106845
Fig. 5. Exemplary comparison of the fluorescent tracks before and after heating at 290 ◦ C. Panel c) presents profiles of the tracks (normalized intensity) measured
along the yellow lines perpendicular to the tracks’ axes, marked on panels a) and b).
different fluences of alpha radiation ranging from 1.6*104 cm− 2 to
5.8*107 cm− 2 and subjected them to the standard thermal treatment.
The results are presented in Fig. 7 and Fig. 8. For each fluence value, five
images were taken at different parts of a sample for three different
crystal samples. The mean value of the track intensity was calculated for
fluences up to 4.8*105 cm− 2. For higher fluences, when single tracks
were no longer recognizable, the light intensity increase was determined
as the ratio of the average brightness in the field of view of a diameter of
90 μm measured after and before heating to 290 ◦ C. Acquisition time
varied from 2 s for lowest fluences to 200 ms for highest value of fluence.
It was, however, always the same for each compared pair of images
(before and after the heat treatment). It appears that the enhancement in
the intensity of tracks reaches its highest value of about 2.5 only for very
low fluences. When the density of tracks grows, the increase is less
prominent and finally, for the value of fluence around 2.9*107 cm− 2, the
intensity of light registered after a heat treatment is lower than the
initial one. The results confirmed that the fluence indeed was the cause
of the discrepancy between the microscopic and the spectral data. It
seems that signal enhancement is high only if an area of a highconcentration of color-centers (i.e. a track) is surrounded by an area
with a low number of centers. This unexpected finding makes in
vestigations aimed at understanding the nature of the observed
photoluminescence signal over time. After 8 months of storage the track
intensity enhancement stayed within 5% from the initial enhancement
observed right after heat treatment. This proves that the increase in
tracks intensity is a permanent effect.
To better understand the mechanism of photoluminescence signal
increase after post-irradiation heat treatment we performed emission
spectra measurements for the sample irradiated with alpha particles
from Am-241 source with a fluence of 5.5*1012 cm− 2. The irradiated
sample was gradually heated from room temperature up to 400 ◦ C with a
standard multi-step heating procedure. Fig. 6 presents the comparison
between emission spectra obtained for a sample that was not subjected
to any heating and for the same sample after multi-step heating to
290 ◦ C. It is clear that we do not observe the effect of signal enhance
ment, described above, but oppositely, a big decrease of the intensity of
the 670 nm emission band related to the F2 color centers is present. We
also observe a complete disappearance of a peak related to F+
3 color
centers (located near 525 nm).
The main difference between the conditions of the spectral mea
surements and microscopic observations of tracks was in the used alphaparticle fluence (~1012 cm− 2 and ~104 cm− 2, respectively). In order to
verify whether the higher fluence might be the reason for the lack of the
luminescence intensity increase, we irradiated LiF samples with
4
M. Sankowska et al.
Radiation Measurements 157 (2022) 106845
Also, the background is much brighter. This might be caused not only by
surface imperfections (as in the case of alpha irradiations), but maybe
even more by the enhancement of the fluorescent signal originating from
the color centers which do not form visible tracks. Such centers are
certainly present, as the gamma-ray dose is deposited pretty uniformly
in the whole volume of a crystal, but due to the limited sensitivity, we
can only see as tracks the spots of locally higher ionization density, i.e.
higher density of color-centers.
The number of visible tracks is also increased after the annealing.
The smaller increase of the light intensity than in the case of alphaparticles (1.5 instead of 2.5) may be interpreted as consistent with the
observed dependence of the enhancement factor on the density of tracks.
Looking for a possible reason for the observed enhancement of the
fluorescent tracks after thermal treatment, two kinds of processes might
be considered: the creation of additional F2 color centers in LiF crystals
or mitigation of some processes competitive to the F2-related photo
luminescence. Concerning the latter, the existence of such competitive
processes in LiF has never been reported, so the formation of new F2
centers seems more probable. Interactions between defects and trans
formation of one type into another obviously occur in LiF (Schwartz
et al., 2010; Voitovich et al., 2011, 2013). These processes may follow
various paths and the presently available data do not allow us to draw
any firm conclusions. However, taking into account that F2 centers are
the most abundant ones in LiF besides F centers, it seems to be rather
unlikely that the transformation of any other defects may increase the
population of F2 to a degree sufficient to explain a 2.5-times increase in
the fluorescent intensity. On the other hand, as the number of F centers
in LiF many times exceeds that of F2 centers, even a small fraction of F
centers turned into F2 may account for such enhancement of the track
intensity, therefore the involvement of F centers in the process seems
probable.
Fig. 6. Photoluminescence emission spectra for a sample irradiated with alpha
particles from Am-241 source (fluence 5.5*1012 cm− 2) for excitation at 440 nm.
The spectrum is clipped from the low wavelength side by the applied filter.
4. Conclusions
Fig. 7. Change in tracks intensity after 290
particle fluence.
◦
The performed investigations fully confirmed that thermal treatment
may increase the intensity of fluorescent tracks in LiF crystals. This in
crease occurs for heating a crystal at temperatures ranging between
200 ◦ C and 300 ◦ C, with a maximum increase of 2.5 at 290 ◦ C.
Enhancement of tracks intensity is a permanent effect that does not
change in time.
An interesting phenomenon that we discovered during our research
is a strong dependence of the photoluminescent signal enhancement on
particle fluence. The enhancement becomes less and less prominent with
increasing fluence and completely disappears for fluences over 2.9*107
cm− 2. Above this value, the photoluminescence signal after postirradiation annealing at 290 ◦ C is lower than the initial one.
It is unclear what is the reason behind the observed effect of pho
toluminescence increase. As different color centers disintegrate or
interact with each other and create new species, their concentrations
change while LiF crystal is subjected to heat treatment. Unfortunately,
as the effect of photoluminescence enhancement only occurs for very
low fluences of ionizing particles, emission and absorption spectra
measurements are not helpful in solving that problem.
The effect of tracks intensity increase is very desirable for LiF-based
FNTDs. Although more research is still needed on this topic, it may lead
to signal-to-noise ratio improvement and improved measuring capabil
ities. As the proposed heat treatment is fast and very easy, it could be
routinely used in measurements.
C annealing vs. alpha-
enhancement of the tracks intensity, more difficult. It seems that the
measurement of luminescence spectra, and all the more, the measure
ments of the absorption spectra, which require even higher doses, will
not be able to provide data useful for this purpose.
In our study, we focused mostly on the crystals irradiated with alpha
particles, as their tracks are easy to observe with the FNTD method, and
the irradiations are quick and uncomplicated. The effect of enhancement
is however not limited only to these particles. Fig. 9 presents the images
acquired from the crystal irradiated with 50 mGy of Cs-137 gamma
radiation. The tracks produced by photons do not have a shape resem
bling the real path of secondary electrons, but have just a form of small
dots, a little brighter than the background, and of the size equal to the
spatial resolution of the applied microscope system (c.a. 400 nm). They
may be interpreted as a result of locally enhanced energy deposition e.g.
at the end of an electron track or due to the overlapping of several
electron tracks. The effect of annealing on the photon-induced image is
clearly visible also in this case. The enhancement factor is about 1.5.
Declaration of competing interest
The authors declare that they have no known competing financial
interests or personal relationships that could have appeared to influence
the work reported in this paper.
5
M. Sankowska et al.
Radiation Measurements 157 (2022) 106845
Fig. 8. Illustration of track intensity changes due to 290 ◦ C heating for various alpha-particle fluence.
Fig. 9. Effect of 290 ◦ C annealing on gamma-rays irradiated crystal (Cs-137, 50 mGy). Acquisition time 20 s.
Data availability
Acknowledgments
Data will be made available on request.
This work was supported by the National Science Centre, Poland
(Contract No. UMO-2020/37/N/ST5/01975).
6
M. Sankowska et al.
Radiation Measurements 157 (2022) 106845
References
Nichelatti, E., Piccinini, M., Ronsivalle, C., Picardi, L., Vincenti, M.A., Montereali, R.M.,
2020. Evaluation of saturation dose in spatial distributions of color centers generated
by 18 mev proton beams in lithium fluoride. Nucl. Instrum. Methods B 464,
100–105.
Piccinini, M., Nichelatti, E., Ampollini, A., Bazzano, G., De Angelis, C., Della Monaca, S.,
Nenzi, P., Picardi, L., Ronsivalle, C., Surrenti, V., Trinca, E., Vadrucci, M.,
Vincenti, M.A., Montereali, R.M., 2020. Dose response and bragg curve
reconstruction by radiophotoluminescence of color centers in lithium fluoride
crystals irradiated with 35 mev proton beams from 0.5 to 50 gy. Radiat. Meas. 133,
106275.
Piccinini, M., Nichelatti, E., Ampollini, A., Picardi, L., Ronsivalle, C., Bonfigli, F.,
Libera, S., Vincenti, M.A., Montereali, R.M., 2017. Proton beam dose-mapping via
color centers in lif thin-film detectors by fluorescence microscopy. EPL 117, 37004.
Schindelin, J., Arganda-Carreras, I., Frise, E., Kaynig, V., Longair, M., Pietzsch, T.,
Preibisch, S., Rueden, C., Saalfeld, S., Schmid, B., Tinevez, J.-Y., White, D.J.,
Hartenstein, V., Eliceiri, K., Tomancak, P., Cardona, A., 2012. Fiji: an open-source
platform for biological-image analysis. Nat. Methods 9, 676.
Schwartz, K., Volkov, A.E., Sorokin, M.V., Neumann, R., Trautmann, C., 2010. Effect of
irradiation parameters on defect aggregation during thermal annealing of lif
irradiated with swift ions and electrons. Phys. Rev. B 82, 144116.
Vincenti, M.A., Leoncini, M., Libera, S., Ampollini, A., Mancini, A., Nichelatti, E.,
Nigro, V., Picardi, L., Piccinini, M., Ronsivalle, C., Rufoloni, A., Montereali, R.M.,
2021. Enhanced photoluminescence of f2 and f+
3 colour centres in lithium fluoride
film-based detectors for proton beams. Opt. Mater. 119, 111376.
Voitovich, A.P., Kalinov, V.S., Runets, L.P., Stupak, A.P., Martynovich, E.F.,
Montereali, R.M., Baldacchini, G., 2013. Color centers aggregation kinetics in
lithium fluoride after gamma irradiation. J. Lumin. 143, 207–214.
Voitovich, A.P., Voitikova, M.V., Kalinov, V.S., Martynovich, E.F., Novikov, A.N.,
Runets, L.P., Stupak, A.P., Montereali, R.M., Baldacchini, G., 2011. Aggregate color
center formation processes in lithium fluoride crystals after irradiation. J. Appl.
Spectrosc. 77, 857–868.
Akselrod, G.M., Akselrod, M.S., Benton, E.R., Yasuda, N., 2006. A novel al2o3 fluorescent
nuclear track detector for heavy charged particles and neutrons. Nucl. Instrum.
Methods B 247, 295–306.
Akselrod, M.S., Sykora, G.J., 2011. Fluorescent nuclear track detector technology - a new
way to do passive solid state dosimetry. Radiat. Meas. 46, 1671–1679.
Baldacchini, G., 2002. Colored lif: an optical material for all seasons. J. Lumin. 100,
333–343.
Bilski, P., Marczewska, B., Gieszczyk, W., Kłosowski, M., Naruszewicz, M.,
Sankowska, M., Kodaira, S., 2019a. Fluorescent imaging of heavy charged particle
tracks with lif single crystals. J. Lumin. 213, 82–87.
Bilski, P., Marczewska, B., Gieszczyk, W., Kłosowski, M., Naruszewicz, M.,
Zhydachevskyy, Y., Kodaira, S., 2019b. Luminescent properties of lif crystals for
fluorescent imaging of nuclear particles tracks. Opt. Mater. 90, 1–6.
Bilski, P., Marczewska, B., Gieszczyk, W., Kłosowski, M., Nowak, T., Naruszewicz, M.,
2018a. Lithium fluoride crystals as fluorescent nuclear track detectors. Radiat.
Protect. Dosim. 178, 337–340.
Bilski, P., Marczewska, B., Kłosowski, M., Gieszczyk, W., Naruszewicz, M., 2018b.
Detection of neutrons with lif fluorescent nuclear track detectors. Radiat. Meas. 116,
35–39.
Bilski, P., Marczewska, B., Sankowska, M., Gieszczyk, W., Mietelski, J.W., 2020. Rangebased method of alpha-particle spectrometry using lif fluorescent nuclear track
detectors. Measurement 160, 107837.
Greilich, S., Osinga, J.M., Niklas, M., Lauer, F.M., Klimpki, G., Bestvater, F., Bartz, J.A.,
Akselrod, M.S., Jakel, O., 2013. Fluorescent nuclear track detectors as a tool for ionbeam therapy research. Radiat. Meas. 56, 267–272.
Marczewska, B., Bilski, P., Nowak, T., Gieszczyk, W., Kłosowski, M., 2017. Imaging of
proton bragg peaks in lif. Radiat. Protect. Dosim. 178, 333–336.
Montereali, R.M., Piccinini, M., Ampollini, A., Picardi, L., Ronsivalle, C., Bonfigli, F.,
Nichelatti, E., Vincenti, M.A., 2019. Visible photoluminescence of color centers in
lithium fluoride detectors for low-energy proton beam bragg curve imaging and dose
mapping. Opt. Mater. 95, 109242.
7