Unveiling unique structural features of the YNU-5 aluminosilicate family
Bạn đang xem bản rút gọn của tài liệu. Xem và tải ngay bản đầy đủ của tài liệu tại đây (8.01 MB, 8 trang )
Microporous and Mesoporous Materials 317 (2021) 110980
Contents lists available at ScienceDirect
Microporous and Mesoporous Materials
journal homepage: />
Unveiling unique structural features of the YNU-5 aluminosilicate family
Yaping Zhang a, Yi Zhou a, Tu Sun a, Pengyu Chen b, Chengmin Li a, Yoshihiro Kubota c,
Satoshi Inagaki c, Catherine Dejoie d, Alvaro Mayoral a, e, f, *, Osamu Terasaki a
a
Center for High-Resolution Electron Microscopy (CћEM), School of Physical Science and Technology, ShanghaiTech University, 393 Middle Huaxia Road, Pudong
Shanghai, 201210, China
b
Zhiyuan College & School of Chemistry and Chemical Engineering, Shanghai Jiao Tong University, 800 Dongchuan Road Shanghai, 200240, China
c
Division of Materials Science and Chemical Engineering, Yokohama National University, 79-5 Tokiwadai, Hodogaya-ku, Yokohama 240-8501, Japan
d
ESRF − European Synchrotron Radiation Facility, CS40220, Grenoble, 38043, France
e
Instituto de Nanociencia y Materiales de Aragon (INMA), Spanish National Research Council (CSIC), University of Zaragoza, 12, Calle de Pedro Cerbuna, Zaragoza
50009, Spain
f
Laboratorio de Microsocopias Avanzadas (LMA), University of Zaragoza, Mariano Esquillor, S/N, Zaragoza 50018, Spain
A R T I C L E I N F O
A B S T R A C T
Keywords:
Zeolites
Electron diffraction tomography (EDT)
Structure analysis
Rietveld refinement
Spherical aberration-corrected STEM
YNU-5 (YFI type) is the first zeolite reported with interconnected 12-, 12-, and 8-ring pores showing a
remarkable catalytic potential towards the dimethyl ether (DME)-to-olefin reaction. In this work, the structures
of the as-synthesized, calcined and dealuminated YNU-5 zeolites, were investigated by various techniques with
special emphasis on advanced electron microscopy methods. The frameworks of the three materials were solely
determined by three-dimension electron diffraction tomography, and the space group for the three of them was
determined to be Cmmm, which is of higher symmetry than the previous reported result. Rietveld refinement was
performed against synchrotron Powder X-ray diffraction data in order to obtain precise information of the
framework and to locate the organic species, cations and water. Additionally, spherical aberration-corrected
scanning transmission electron microscopy was employed to study the local fine structure and to indicate sur
face reconstruction associated to the displacement of the vacancies through the dealumination process. Finally, a
minor phase, whose structure was solved by electron microscopy was found to be MSE framework type, appeared
in all the three YNU-5 materials.
Overall, the electron microscopy analyses reported in the present work provide additional information
regarding the YNU-5 structure in terms of space group determination, additional surface terminations and the
identification of a minor phase.
1. 1Introduction
Due to the versatile pore size distribution, adjustable particle size
and morphology, thermal stability and large specific surface areas,
zeolite field is vital and prosperous in both industry and academia. To
date, 253 uniqueframework type have been approved by the Interna
tional Zeolite Association (IZA). YNU-5 (YFI type) is the first zeolite with
an interconnected 12–, 12–, 8–ring pore system which has a large and
continuous space favorable for mass transfer [1]. The structure of YNU-5
was firstly solved based on powder X-ray diffraction (PXRD) assuming
the C2/m (monoclinic, No.12) space group [1].
YNU-5 has been synthesized using FAU-type zeolite as part of the
starting silica source [1,2] and dimethyldipropylammonium
(Me2Pr2N+) as organic structure-directing agent (OSDA). Under these
conditions, YNU-5 with very high purity can be obtained in a very
narrow synthesis window with MSE, MFI and *BEA as its competing
phases.
Among the different structural properties of zeolites, the Si/Al ratio
is crucial due to its direct relationship on chemical properties such as
ion-exchange, hydrophilicity, stability and acidity. Zeolites obtained by
direct synthesis usually have high aluminum content. However, the
inherent thermal/hydrothermal stability is a common problem for high
Al concentration frameworks; in general, high Si/Al ratio (low Al con
tent) frameworks tend to be used as catalysts, while low Si/Al
* Corresponding author. Center for High-Resolution Electron Microscopy (CћEM), School of Physical Science and Technology, ShanghaiTech University, 393
Middle Huaxia Road, Pudong, Shanghai, 201210, China.
E-mail address: (A. Mayoral).
/>Received 3 January 2021; Received in revised form 5 February 2021; Accepted 12 February 2021
Available online 18 February 2021
1387-1811/© 2022 The Authors.
Published by Elsevier Inc.
This is an open
( />
access
article
under
the
CC
BY-NC-ND
license
Y. Zhang et al.
Microporous and Mesoporous Materials 317 (2021) 110980
frameworks are mainly used as ion-exchangers. To modify the
aluminum content, various post-synthetic dealumination procedures
have been developed that increase the Si/Al ratio such as (i) mineral
acid treatment [3,4], (ii) steaming method [5–8] or (iii) reaction with
the dealumination agent and supplement Si, such as ammonium hexa
fluorosilicate ((NH4)2[SiF6]) [9,10]. For the particular case of YNU-5,
the Si/Al ratio of the framework can be increased from 9 to 350 by a
simple treatment with nitric acid with different concentrations under
reflux while preserving the crystallinity and thermal stability [2].
Because of the unique structural parameters, excellent thermal stability
and tunable Si/Al ratio, YNU-5 displays outstanding performance for the
conversion of dimethyl ether to propylene, butylene or other light ole
fins [1]. In fact, YNU-5 is a suitable material for solid acid catalysis due
to its controllable Si/Al ratio, which was found to strongly influence the
conversion of dimethyl ether obtaining high values at a short time of
stream (TOS), 5 min, that rapidly decreased as the TOS was increased.
However, this aspect could be improved by modifying the Si/Al ratio
and by introducing a small amount of an impurity phase [1,11].
In order to further developing the catalytic properties of zeolites, a
deep structural understanding down to the atomic level is required. In
this sense, electron microscopy shows special advantages in structural
characterization at the nanoscale such as: (i) diffraction and image in
formation can be obtained simultaneously; (ii) coulomb interaction is
much stronger with matter than X-ray’s scattering. Therefore, to achieve
the same intensity, X-Ray needs around 108 times more sample amount
in volume in comparison with electron microscopy [12]; (iii) electrons
are matter waves with much shorter wave length, therefore high spatial
resolution can be achieved.
Furthermore, with the implementation of continuous automated
rotating sample holders, it is possible to achieve three-dimensional
electron diffraction tomography from small crystals that can be
assumed as single crystal particles. Subsequently, combining these data
with direct methods, several zeolite frameworks [13–20] have been
solved without the necessity of obtaining large single crystals. In addi
tion, imaging in high-resolution mode can provide unique local infor
mation of the framework, structural defects or of surface terminations
[21–26].
In the present work, we have investigated YNU-5 by advanced
electron microscopy methods solving the structure of the three materials
(as-synthesized, calcined and dealuminated) by three-dimension elec
tron diffraction tomography (3D-EDT) to evaluate the possible differ
ences among them and to compare with the previous reported data.
Rietveld refinement against powder X-ray diffraction data allowed
further analysis of the OSDA location, the extra-framework cations and
the water content. The local structure was studied by Cs-corrected STEM
at atomic level, which allow the identification of substantial differences
on the crystal surfaces before and after the dealumination process.
Finally, an additional minor phase was detected both on scanning
electron microscopy (SEM) and on transmission electron microscopy
(TEM). Its structure was solved by 3D-EDT as MSE framework type.
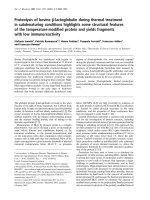
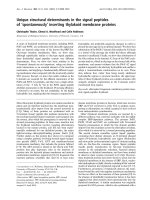
Fig. 1. Electron diffraction patterns of as-synthesized YNU-5. Projected
diffraction patterns obtained from 3D-EDT along a) [010]; b) [100] and c)
[001] directions. d) Selected area electron diffraction (SAED) pattern along
[001] direction. The dashed lines are mirror planes and the circles in figure d)
with the same colors mark the strong spots that should have the same intensity
according to the Laue class for orthorhombic system. (For interpretation of the
references to color in this figure legend, the reader is referred to the Web
version of this article.)
treatment with a 13.4 mol L−
24 h.
1
HNO3 solution at 403 K in an oil bath for
2.2. Electron microscopy observations
Electron microscopy. For electron microscopy analyses, the sam
ples were firstly crushed for 15 min using agate mortar and pestle, with
the intention of obtaining very thin crystals, dispersed in HPLC ethanol
by ultrasonic treatment and then few drops of the suspension were
placed onto a carbon-coated copper grid. SAED patterns, high-resolution
transmission electron Microscopy (HRTEM) images and 3D-EDT data
were collected in JEM-2100 Plus in TEM mode at 200 kV with a TVIPS
F416 camera using the JEOL.Shell software by Analitex.
For the 3D-EDT experiments, the data sets were collected using a
high-angle titlt holder. A nanocrystal was tilted along one axis at a
constant speed from − 60◦ to 60◦ within 8 min for each set of data. The
reciprocal spaces were reconstructed and the unit cell parameters and
diffraction intensities were extracted afterwards.
The SEM images were collected on JSM 7800F Prime with a work
distance of 7 mm and landing voltage of 1.00 kV.
Cs-corrected STEM high-angle annular dark field (HAADF) images
were taken in a JEOL JEM-ARM300F operated at 300 kV equipped with
a cold field emission gun (FEG), and double Cs correctors for TEM and
STEM measurements.
2. Experimental section
2.1. Sample preparation
YNU-5 materials were prepared according to the reported procedures
[1,2]. YNU-5 zeolite was synthesized using FAU type zeolite as Si and Al
sources, Me2Pr2N+OH− as the OSDA and aqueous solutions of NaOH and
KOH as alkaline additives. Colloidal silica was also added to adjust the
input Si/Al ratio. The resulting mixture was placed in a Teflon-lined
autoclave and heated statically in a convection oven for 165 h at 433
K. The resulting material was collected by filtration, extensively washed
with deionized water and dried overnight. The calcined YNU-5 was
obtained by heating the as-synthesized YNU-5 in a muffle furnace at 823
K for 6 h after raising the temperature from room temperature to 823 K
with a ramp rate of 1.5 K min− 1. The De-Al YNU-5 was obtained by
2.3. Sample characterization
Si, Al, K analysis. The chemical composition corresponding to Si, Al,
K was measured by inductively coupled plasma atomic emission spec
trometry (ICP-AES; Thermo Fisher iCAP 7400). 5.040 mg/5.035 mg/
5.043 mg of as-synthesized YNU-5/calcined YNU-5/De-Al YNU-5 were
dissolved in 2 mL HCl (conc.) and 0.5 mL HF (40%) aqueous solution,
respectively. Then, the samples were diluted in water in three 50 mL
volumetric flasks. Three different characteristic spectrum peaks were
2
Y. Zhang et al.
Microporous and Mesoporous Materials 317 (2021) 110980
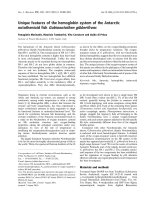
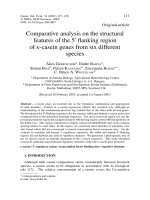
Fig. 2. a) Complete framework solved from assynthesized YNU-5 3D-EDT data set. Color scale:
red, oxygen; yellow, “T” (Si/Al). The green surface
covered outside the atom is the electrostatic po
tential map reconstructed from 3D-EDT data. b)
Structure model of the area within blue circle in a).
c) Cs-corrected STEM-ADF image of YNU-5 assynthesized; d) Averaged high-resolution image
with p1 symmetry of the yellow region in c). The
plane group c2mm is marked with yellow color.
(For interpretation of the references to color in this
figure legend, the reader is referred to the Web
version of this article.)
the single straight 8-ring channel. Six 5-rings (56Rs) and two 6-rings
(62Rs), colored in pink in Fig. 2b surround the straight 8ring channel,
in light transparent blue color. Calcined YNU-5 and De-Al YNU-5
frameworks were also successfully solved assuming the same space
group Cmmm (see Table S1).
Spherical aberration corrected scanning transmission electron mi
croscopy (Cs-corrected STEM) coupled with an annular dark field de
tector (ADF) was employed to analyze the crystal framework of the assynthesized YNU-5. Fig. 2c depicts the atomic observation along the
[001] orientation, from which the c2mm can be directly inferred,
Fig. 2d, confirming that the Cmmm space group should be adopted,
where the ellipse represents the 2-fold rotation axis normal to the paper
and the solid lines represent mirror plane and the dashed lines represent
the axial glide lines (1/2 along line parallel to projection plane) for the
c2mm symbol. The schematic model obtained from the diffraction data
has been overlaid corroborating a perfect matching between the data
obtained from diffraction with the atomic-resolution image.
A layer of amorphous carbon can be observed in Fig. 2c; it is
attributed to a contamination effect that took place over some zeolite
crystallites. Despite that the sample preparation conditions were kept as
clean as possible, some carbon compounds from the environment could
fall over the TEM grids, especially if the samples were not directly
transferred to the electron microscopy column after preparation. To be
sure that the layer observed in some of the crystallites was present
before irradiation and it corresponded to impurities and not due to beam
damage, some crystals were imaged directly before exposing them to
any electron beam interaction observing that the layer was already
present.
chosen for each element for element type determination.
C, H, N analysis. C, H, N composition was analyzed using a Perki
nElmer 2400 (Clarus 580) operated at 975◦ C. Each sample was tested at
least twice in parallel to ensure repeatability.
PXRD collection. High-resolution powder diffraction data of YNU-5
samples were collected at the ID22 beamline at the European Synchro
tron Radiation Facility (ESRF) using a wavelength of 0.40003952 ˚
A.
Rietveld structure refinement and Pawley refinement were carried out
using the Topas6 software [27].
FT-IR collection. Fourier Transform Infrared Spectroscopy was used
to study the structure YNU-5 materials in order to identify different
molecules. These measurements were performed using a PerkinElmer
Frontier spectrometer in the range of 400–4000 cm− 1 with a step width
of 1 cm− 1 and 16 scanning times for each step and each sample.
3. Results and discussion
3.1. Framework determination
3D-EDT enables to collect single crystal diffraction analysis from a
nanocrystal. Therefore, a Bravais lattice witht he unit cell parameters
and Laue-class can be obtained not only from the distribution of the
diffraction spots, but also from the distribution of their intensity.
For the as-synthesized YNU-5, Fig. 1a–c corresponds to the electron
diffraction (ED) patterns extracted from the 3D-EDT along the [010],
[100] and [001] projections respectively, where mirror planes are
marked by dashed lines. Even though from diffraction distribution, the
lattice type may be trigonal, hexagonal or orthorhombic, in the recon
structed reciprocal space processed by 3D-EDT data, the symmetry of the
intensity distribution along [001] indicates a C-centered orthorhombic
Bravais lattice with unit cell parameters; a = 18.67 Å, b = 32.37 Å, c =
12.80 Å, and V = 7736 Å3 that after refinement against PXRD turned to
be a = 18.12514 (4) Å, b = 31.75158(7) Å, c = 12.62636(3) Å, and V =
7266.49(3) Å3 (Table S1) and mmm Laue class, where the mirror planes
are marked by dashed lines (Fig. 1c and d).
Among the possible space groups, Cmmm, Cm2 m, Cmm2, C222, the
highest symmetry, Cmmm, was selected using standard direct method in
Sir2014 software [28]. Fig. 2a displays the model, along the main
crystallographic zone axes c, b and a, based on the obtained structural
solution, with oxygen atoms in red and “T” atoms in yellow wrapped in
green electrostatic potential map. The characteristic 8-ring channel can
be observed along the c axis (indicated by a blue dashed circle in Fig. 2a
and by a yellow arrow in Fig. 2b). The model in Fig. 2b corresponds to
3.2. Extraframework species
ICP-AES and organic element analyzer were used to obtain the
chemical composition, Table S2. The chemical compositions obtained
were: (i) As-synthesized YNU-5: Si109Al11K5.7C45H141N6O222; (ii)
Calcined YNU-5: Si108Al12K5.9 C5.1H109O275; (iii) De-Al YNU-5:
Si108Al0.48C16.4H76O239. As-synthesized YNU-5 contains 6 OSDA and
around 6 K+ per unit cell. After calcination, the OSDA was removed and
the calcined YNU-5 contains around 50 water molecules per unit cell.
After obtaining the framework structure by 3D-EDT, more detailed
information of guest molecules or cations was obtained by Rietveld
refinement against synchrotron PXRD data using TOPAS6 [27] with the
framework solved from 3D-EDT as the initial model. The presence of
extraframework species mainly influences the diffraction intensities of
3
Y. Zhang et al.
Microporous and Mesoporous Materials 317 (2021) 110980
Fig. 3. Rietveld refinement for as-synthesized YNU-5 (red, oxygen atoms; yellow, silicon atoms; pink, potassium atoms). a) Fourier difference map obtained from the
PXRD with data range 6–30◦ ; b), c) Fourier difference map obtained from the PXRD with data range 2–30◦ ; d) Final structure model from Rietveld refinement with
range 2–30◦ . (For interpretation of the references to color in this figure legend, the reader is referred to the Web version of this article.)
low angle reflections. During the refinement process, a 2θ range between
6◦ and 30◦ was firstly used to refine the framework atomic positions and
the scale parameter. Then, the entire structure, including the extra
framework species (OSDA, water molecules, and K atoms), was refined
using the complete 2◦ –30◦ 2θ range.
literature [2]. According to the Rietveld refinement, the water molecules
filled the empty space left by the OSDA molecules. The amount of water
(53H2O molecules per unit cell) and K+ (5.77 K+ compared with 5.9 K+
from chemical element analysis) matched well with the chemical
element analysis data.
3.2.1. As-synthesized YNU-5
Assuming that all “T” sites (T = Si, Al) can be either occupied by Si or
Al with equal probability, the negative cloud (blue color) and the pos
itive one (orange) observed in the Fourier difference maps, Fig. 3a–c,
may correspond to a possible vacancy or Al site for the negative signal
and to the presence of the OSDA or K+ for the positive one.
Thus, the positive cloud can belong either to the K+ or to the OSDA.
In Fig. 3b and Fig. 3c three 8-rings are marked as 1, 2, 3 red, blue and
green rectangles in Fig. 3b and with translucent colored (same color
code) octagons in Fig. 3c. The 8Rs marked 2 and 3 are symmetry related
by a mirror plane, while 2′ and 3’ are equivalent to 2 and 3.
In Fig. 3b, for the 8Rs marked as 2 and 3, the cloud signals are
continuously curving; meanwhile in 1, the cloud signal is straight and
not continuous. Therefore, it is reasonable to assume that K+ is located
in the channels 1, and, it was introduced in the model. The OSDA was
then placed in the other channels (2 and 3). The simulated annealing
method was used to obtain the location and conformation of the OSDA
molecules, and the structure was then refined. 96.3% of the K+ (5.49 K+
compared with 5.7 K+ from chemical element analysis) were located in
channel 1. A good match for the OSDA was also retrieved (6 and 6.0
molecules per unit cell obtained from PXRD and chemical analysis,
respectively). The final structure is displayed in Fig. 3d, with the K+
represented as pink spheres and the OSDA in white for H, yellow for C
and purple for N.
3.2.3. De-Al YNU-5
For De-Al YNU-5, most of Al atoms were removed (Si/Al ratio = 305)
and no K+ was detected. A Pawley refinement (Fig. S4) was performed to
determine the unit cell parameters, Table S1. For each Al removed from
the framework, there will be a silanol nest left around that vacancy if
there are no other atoms to supplement that position.
FT-IR analyses of the three samples are presented in Fig. S2. By
checking the range between 1350 and 4000 cm− 1, significant differences
were evidenced. For as-synthesized YNU-5 (Fig. S2a), a strong and sharp
band appears at 1500 cm− 1 corresponding to the positively coordinated
N that belong to the OSDA. This band almost completely disappeared
after calcination, Fig. S2c. However, another band appeared at the same
wavenumber for the De-Al YNU-5 (Fig. S2e) associated to some NO−3
molecules that remained after the dealumination process with nitric
acid.
At higher energies, the vibrations corresponding to the [SiO–H] and
[SiO–H⋯OH] groups appeared around or above 3650 cm− 1 [29]. For
as-synthesized YNU-5, a very weak band was observed at around 3650
cm− 1 which significantly increased and widened for calcined YNU-5
(Fig- S2c) due to the aggregation of [O–H] through hydrogen bonding
([SiO–H⋯OH] groups). Finally, very sharp bands appeared in the De-Al
YNU-5 spectrum (Fig. S2e) associated to the formation of [SiO–H]
groups.
On the other hand, in the region between 400 and 1350 cm− 1, the
most significant difference was observed around 950 cm− 1 which is
associated to the existence of Si–OH vibrations [30]. No band was
detected for the as-synthesized YNU-5 and calcined YNU-5 (Figs. S2b-d),
suggesting the absence or very low content of silanol groups. However,
because of the dealumination process [Si–OH] were generated in De-Al
YNU-5, and correspond to the signal at around 950 cm− 1 (Fig. S2f).
[Si–OH] and [SiO–H] bands due to the dealumination procedure are
marked with red character in Figs. S2e and S2f [31,32].
3.2.2. Calcined YNU-5
For the calcined YNU-5, as there was no OSDA, the positive signal
obtained was directly attributed to the K+ cations that were located
inside the straight 8Rs denoted as number 1 in Fig. 3b and Fig. 3c. The
final Rietveld refinement structure is presented in Fig. S1. For this ma
terial, the water content significantly increased up to 11–12 wt% as a
consequence of OSDA removal and subsequent hydration from the at
mosphere, which was not found in the 8R channel (Fig. 2b yellow arrow)
in agreement with the results from NMR analysis reported in the
4
Y. Zhang et al.
Microporous and Mesoporous Materials 317 (2021) 110980
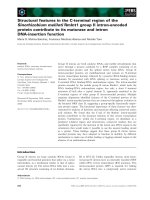
Fig. 5. Cs-corrected STEM-ADF data of as synthesized YNU-5 along the [001]
zone axis. a) Low magnification image with the Fourier diffractogram (FD)
inset. b) Edge of the crystal showing the (100), (110) and (130) facets. c)
Zoomed in view of the (100) facet. d) Analysis of the crystal surface at atomic
level, with different types of termination marked by colored arrows. The model
with similar structure is also presented using the same color coded arrows to
point out different terminations. (For interpretation of the references to color in
this figure legend, the reader is referred to the Web version of this article.)
compared the results among themselves and with the previous reported
data completing the series of YNU-5.
3.3.1. As-synthesized YNU-5 surface analysis
Fig. 4b displays the Cs-corrected STEM-ADF (along [001] zone axis)
image of the (110), (310) facets, where the existence of surface steps
from different layers denoted as I, II and III are evidenced. These steps
correspond to what it can be deduced as a building unit for YNU-5,
which would correspond the object 1, in agreement with the data re
ported by Nakazawa et al. However, in here, such unit was observed at
different growing steps (resulting in different termination sites) pointed
by numbered arrows, Fig. 4b. For the outermost layer named as I, the
arrow numbered as 1 shows the first non-complete object 1, where two of
the top 5Rs were not formed; in this case, the surface termination cor
responded to a 6R and a 5R with the 8Rs opened. The next unit denoted
here with number 2, exhibits a very similar termination with opened 8Rs
and where the 5Rs which were fully formed are now also incomplete
leading into a more opened termination. The next unit, number 3, is the
same as number 2 with the 8Rs and the 5Rs not completed. Finally,
number 4 corresponds to the last unit observed in this step; in this case,
it can be appreciated a barely formed object 1, with only 53Rs fully
formed. This observation was slightly different than the one reported by
Nakazawa, where they only visualized complete object 1 units for the
same {110} facets.
The following step denoted here as II is also composed by both
complete and not fully formed objects 1 units. In this layer, number 1 has
been marked as a fully formed object 1 unit. Number 2 corresponds to a
termination where the 8R is fully formed but not the units which
compose it; thus, the two 5Rs on top are not complete. The last unit of
this step displays an open 8R with three of the 5Rs missing and one of the
6R opened due to its incompleteness.
Finally, the last step, III, is fully formed by complete objects 1 in a
similar termination as that one described by Nakazawa [1].
Fig. 4. Termination structure of as-synthesized YNU-5 crystal. a) Schematic
drawing of the as-synthesized YNU-5 framework along [001], with two pro
posed building units (objects 1 and 2) marked in different colors, green and
yellow, respectively. b) Cs-corrected STEM-ADF image of the termination of a
YNU-5 crystallite. Crystal termination models of different layers (layer I, II, III)
is displayed below the STEM-ADF image. (For interpretation of the references to
color in this figure legend, the reader is referred to the Web version of
this article.)
3.3. Surface fine structures
Besides the excellent spatial resolution that (Scanning) Transmission
electron microscopy provides [22,25], this methodology also allows the
characterization of the surface termination of the crystals, unraveling
unique details (for the shake of clarity; hereafter, the all “T” atoms in the
models will be colored in blue instead of yellow as it was done in the
structure analysis part). For YNU-5, Nakazawa and co-workers [1]
proposed certain surface terminations of the calcined YNU-5, the surface
was perfectly flat formed by complete units denoted in that work as
object 1, colored in green (composed of 8Rs surrounded by 5 and 6Rs
when observed along the [001] projection) see Fig. 4a, green unit.
Additionally, they also proposed that the outermost surface could also
terminates with these fully formed objects 1 and in between incomplete
units of the so-called object 2 (Fig. 4a, orange color). In here, we have
analyzed the different surface terminations along the distinct facets for
the as-synthesized and for De-Al YNU-5 along the [001] projection and
5
Y. Zhang et al.
Microporous and Mesoporous Materials 317 (2021) 110980
Fig. 6. Cs-corrected STEM-ADF observation of
dealuminated YNU-5. a) Low magnification image
with the areas analyzed marked by colored rect
angles. b) Closer observation of the (010) facet
with a magnified image and the schematic model
shown inset. c) and d) High-magnification images
of the (130) termination. The yellow arrows point
at the different termination units. The schematic
surface termination is shown inset in d). e) and f)
Close-up observation of the (100) surface. g)
Magnified region of the top part of the crystal with
different facets identified (100), (110) and (130).
The blue arrows indicate the different termination
units in the experimental data and in the different
models for each surface. (For interpretation of the
references to color in this figure legend, the reader
is referred to the Web version of this article.)
Fig. 5 depicts an entire YNU-5 particle of around 140 nm sitting on its
[001] zone axis, the different surface facets are marked with (100),
(110), (130) and (130), Fig. 5a and Fig. 5b correspond to a closer
observation of these facets, for the (110), a surface step similar to the
observation presented in Fig. 4 can be visualized. In addition, a
magnified observation of the (100) facets is depicted in Fig. 5c,
observing a nearly flat surface. In order to have such an almost flat
surface, the space between the object 1 units should be filled by objects 2
as described by Nakazawa [1]. In our work; however, the objects 2,
which are intercalated between objects 1 are fully formed, as denoted by
red arrows in Fig. 5d. Furthermore, partially formed objects 1 can be also
identified, confirming that the surface termination on the {100} and on
the {130} facets are formed by fully formed objects 2, partially formed
objects 1 (yellow arrows) and fully formed objects 1 (green arrows). For a
better understanding a schematic representation of the structure is
presented with the termination units also indicated by dashed circles.
This observation suggests that the growth formation of YNU-5 takes
place through a two dimensional assembly, where layers of complete
objects 2 and objects 1 form a nearly flat surface, on which the next layer
would start to grow (as partially formed units) on a new plane of the
layered structure.
arrangement was present which was not detected for the as-synthesized
material. The building units responsible for this formation are marked
by a yellow dashed oval and by yellow arrows, Fig. 6d. In this case, the
most significant difference with the parental YNU-5 is that the building
units that would be in between two objects 1 that would correspond to an
object 2 were missing. This is also evidenced in Fig. 6e and f which
correspond to the (100) facets. Fig. 6e exhibits the region indexed as
(100) facet, where the two types of terminations can be observed
marked with dashed rectangles numbered 1 and 2.
The amplified micrograph is depicted in Fig. 6f where the different
ending units together with its schematic model are pointed by green
arrows. The region marked as 1 corresponds to the termination already
observed in Fig. 5 along the {100} and {110} surfaces and in the data
reported by Nakazawa [1], where a fully formed object 2 was formed in
between two objects 1. On the other hand, a zig-zag surface was also
identified for this facet that would correspond to the missing object 2.
This effect was also observed for additional (100) and (130) surfaces
observed at the top of the crystal, Fig. 6g. In this region, the morphology
was a truncated triangle with a flat (110) termination observed between
the (100) and the (130) facets where in both cases the missing objects 2
were evidenced. The schematic representation of each of the three facets
is also displayed pointing, blue arrows, at the object 1 units.
3.3.2. De-Al YNU-5 surface analysis
It has been reported the excellent crystallinity and thermal stability
of the De-Al YNU-5, which can be achieved after acidic treatment (nitric
acid) at temperatures higher than 100 ◦ C, as a consequence of Simigration, which would terminate with the Si atoms from the surface
of the crystals. However, no evidence of surface reconstruction has been
proved yet. In here, we have studied the atomic configuration of the
surface for the De-Al YNU-5 in the same way as we did it for the assynthesized material. Fig. 6a exhibits the low-magnification image of
an entire particle sitting on the [001] zone axis with dimensions of
around 340 nm × 240 nm. The different facets of the crystal have been
denoted by colored rectangles with the correspondent indexing. Flat
surfaces are observed for the (010) termination, Fig. 6b, in a similar
manner as it was observed for the {110} termination of the assynthesized YNU-5 (Fig. 4b, surface denoted as III), formed by com
plete objects 1, marked by red arrows, which were subsequently linked
by object 2 units that were not fully formed, pink arrow. For a clearer
visualization of the surface termination, a magnified region together
with the model indicating the same units as experimentally observed are
shown inset. More interestingly, it is the surface termination observed
3.3.3. Surface change after dealumination
As already mentioned, during the dealumination process it would be
expected that vacancies would be generated within the framework
decreasing the thermal stability. This effect was observed for sample
processed at low temperatures (80 ◦ C) [2]. However, for higher tem
peratures the thermal stability and in consequence the crystallinity was
maintained and even improved. From the electron microscopy
perspective, the dealuminated material was very similar to the
as-synthesized sample displaying very good crystallinity and similar
electron beam stability. Such a good thermal stability was explained in
terms of Si-migration; for this to occur, Si atoms would be hydrolyzed
creating monosilicic species (Si(OH)4) that would enter in the frame
work in the site defects (aluminum vacancies) via condensation. The
new vacancy created would be then filled by another Si that would
hydrolyze and condensate in the same manner. After repeating this
process several times, the defects would “move” towards the surface,
where they could be visualized.
From the observations carried out on the De-Al YNU-5, the defects
generated on the surface are primarily associated to the object 2 units
that, based on the experimental evidence, would be more subjected to be
hydrolyzed than the objects 1. In fact, after performing the Rietveld
for the (130) facets, Fig. 6c and Fig. 6d; in this case, a zig-zag
6
Y. Zhang et al.
Microporous and Mesoporous Materials 317 (2021) 110980
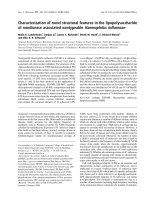
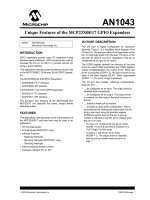
Fig. 7. EM data on minor phase. a) SEM image of
as-synthesized YNU-5 sample, in which a small
crystal shows tetragonal morphology. b) 4-fold
symmetric SAED pattern of minor phase along
[001] direction. The extinction condition cannot
be easily judged from the pattern due to the serious
dynamic scattering effect. Slice view of 3D-EDT
data of the tetragonal minor phase c) along [001]
and d) along [100]. e) Structure model of minor
phase solved from the 3D-EDT. f) p4g plane group
averaged HRTEM image of minor phase along
[001] direction.
refinement of the calcined YNU-5 (containing a high amount of water) it
was found that the straight 8-rings were more hydrophobic and less
subjected to accommodate water molecules. This observation is also in
agreement with the 27Al DE MAS NMR spectra analyses carried out for
different dealumination conditions, where they suggested that the atoms
inside the isolated 8-rings channels (the inner part of the object 1) were
less subjected to be hydrolyzed because the diffusion of water along
these channels may be restricted. Although there are still quite a number
of vacancies left due to the dealumination process according to the FT-IR
spectrum, this mechanism does improve the stability of the De-Al YNU5.
used to solve the framework of the as-synthesized, calcined and De-Al
YNU-5 zeolites assuming Cmmm as the space group. High-resolution
Cs-STEM analyses supported the solution obtained from 3D-EDT.
Rietveld refinement of the as-synthesized and of the calcined YNU-5
were used to obtain a more precise structure solution including the ac
curate location of the OSDA, extra-framework cations and water mole
cules using the Cmmm space group. In the absence of specific or definite
guest species in De-Al YNU-5, only Pawley refinement was used to
obtain precise unit cell parameters.
Based on atomic-resolution image analyses, different surface termi
nations were identified for the as-synthesized material and for the
dealuminated one. The structural defects observed for the dealuminated
material could explain the formation and migration of the vacancies
created during the dealumination process.
Additionally, a tetragonal minor phase was identified by SEM and
TEM observations. This unknown structure, which was present in less
than 0.2 wt% according to the PXRD, was solely solved by 3D-EDT to be
MSE framework type.
3.4. Minor phase in YNU-5 samples
Although the H2O/Si ratio was controlled very carefully during the
synthesis process, there was several small peaks in the PXRD pattern that
could not be indexed with the refined cell parameters in all the three
samples, suggesting the existence of another phase (Fig. S4). Several
crystals with tetragonal morphology that differed from the common
morphology of YNU-5 were found in the SEM data (Fig. 7a). However,
the content of this phase determined by PXRD was less than 0.2 wt%
(Fig. S4); therefore, the diffraction intensity could not be used to solve it.
For this analysis, TEM is very advantageous over PXRD as it allows the
analysis of single crystallites. The SAED pattern along a certain direction
exhibited a clear 4-fold symmetry which did not belong to the YNU-5
structure, Fig. 7b. Through 3D-EDT data, the unit cell parameters
were determined to be a = b = 18.2 Å, c = 20.7 Å, α = β = γ = 90◦ ,
confirming the tetragonal symmetry, (Fig. 7c and d). The reflection
conditions could be summarized as: 0 kl: k + l = 2n, 00l: l = 2n, h00: h =
2n, with only three possible space groups that could satisfy these con
ditions: P42nm (No.102), P-4n2 (No.118) and P42/mnm (No.136). Since
the three of them belong to the same Laue class but different point
group, P42/mnm with the highest symmetry was adopted for structure
solution from the 3D-EDT data. These results were in agreement with the
MSE topology (Fig. 7e). Furthermore, HRTEM data taken along [001]
direction (Fig. 7f), exhibited the characteristic arrangement of large
pores (12R) and small pores (6R). For direct comparison the schematic
model obtained from the 3D-EDT data has been overlaid.
CRediT authorship contribution statement
Yaping Zhang: Investigation, Writing, Formal Analysis. Yi Zhou:
Investigation, Writing, Formal Analysis. Tu Sun: Investigation, Writing,
Formal Analysis. Pengyu Chen: Investigation. Chengmin Li: Investi
gation. Yoshihiro Kubota: Investigation, Formal Analysis. Satoshi
Inagaki: Investigation. Catherine Dejoie: Investigation, Formal Anal
ysis. Alvaro Mayoral: Conceptualization, Investigation, WritingReviewing and Editing, Supervision, Resources. Osamu Terasaki:
Term, Conceptualization, Resources, Writing-Reviewing and Editing,
Supervision.
Declaration of competing interest
The authors declare that they have no known competing financial
interests or personal relationships that could have appeared to influence
the work reported in this paper.
Acknowledgements
The authors would like to thank to The Centre for High-resolution
Electron Microscopy (CħEM), supported by SPST of ShanghaiTech Uni
versity under contract No. EM02161943; to the National Natural Science
4. Conclusions
In this work, 3D-EDT technique combined with direct methods were
7
Y. Zhang et al.
Microporous and Mesoporous Materials 317 (2021) 110980
Foundation of China (NFSC-21850410448, NSFC- 21835002). AM also
acknowledges the Spanish Ministry of Science under the Ramon y Cajal
Program (RYC2018-024561-I) and to the regional government of Ara
gon (DGA E13_20R). The Element component analysis is supported by
Lili Du and Na Yu in ShanghaiTech testing analysis platform. YK is
grateful to the Japan Science and Technology Agency (JST) for the
CONCERT-Japan (grant number: JPMJSC18C4) program, and to the
Japan Society for the Promotion of Science (JSPS) for the Grant-in-Aid
for Scientific Research (B), grant number 19H02513. We would like to
acknowledge Ms Yuka Yoshida of Yokohama National University for the
sample preparation and discussion. We would like to thank Peter
Oleynikov in AnaliteX company to give the support about the data col
lecting software and data processing software and also the instruction
for us about the 3D-EDT theory.
[12] O. Terasaki, T. Ohsuna, Z. Liu, Y. Sakamoto, A.E. Garcia-Bennett, Structural study
of meso-porous materials by electron microscopy, Stud. Surf. Sci. Catal. 148 (2004)
261–288.
[13] W. Hua, H. Chen, Z.B. Yu, X. Zou, J. Lin, J. Sun, A germanosilicate structure with
11x11x12-ring channels solved by electron crystallography, Angew Chem. Int. Ed.
Engl. 53 (2014) 5868–5871.
[14] T. Sun, L. Wei, Y.C. Chen, Y.H. Ma, Y.B. Zhang, Atomic-level characterization of
dynamics of a 3D covalent organic framework by cryo-electron diffraction
tomography, J. Am. Chem. Soc. 141 (2019) 10962–10966.
[15] J. Li, J.L. Sun, Application of X-ray diffraction and electron crystallography for
solving complex structure problems, Accounts Chem. Res. 50 (2017) 2737–2745.
[16] A. Mayence, J.R.G. Navarro, Y.H. Ma, O. Terasaki, L. Bergstrom, P. Oleynikov,
Phase identification and structure solution by three-dimensional electron
diffraction tomography: Gd-phosphate nanorods, Inorg. Chem. 53 (2014)
5067–5072.
[17] Y.F. Yun, X.D. Zou, S. Hovmoller, W. Wan, Three-dimensional electron diffraction
as a complementary technique to powder X-ray diffraction for phase identification
and structure solution of powders, Iucrj 2 (2015) 267–282.
[18] K. J, H. Hauptman, The phases and magnitudes of the structure factors, Acta
Crystallogr. 3 (1950) 181–187.
[19] M. Gemmi, P. Oleynikov, Scanning reciprocal space for solving unknown
structures: energy filtered diffraction tomography and rotation diffraction
tomography methods, Z. für Kristallogr. - Cryst. Mater. 228 (2013) 51–58.
[20] M. Gemmi, M.G.I. La Placa, A.S. Galanis, E.F. Rauch, S. Nicolopoulos, Fast electron
diffraction tomography, J. Appl. Crystallogr. 48 (2015) 718–727.
[21] Q. Zhang, A. Mayoral, J. Li, J. Ruan, V. Alfredsson, Y. Ma, J. Yu, O. Terasaki,
Electron microscopy studies of local structural modulations in zeolite crystals,
Angew. Chem. Int. Ed. (2020) 19403–19413.
[22] A. Mayoral, Q. Zhang, Y. Zhou, P. Chen, Y. Ma, T. Monji, P. Losch, W. Schmidt,
F. Schüth, H. Hirao, J. Yu, O. Terasaki, Direct atomic-level imaging of zeolites:
oxygen, sodium in Na-LTA and iron in Fe-MFI, Angew. Chem. Int. Ed. 59 (2020)
19361–19721.
[23] A. Mayoral, P.d. Angel, M. Ramos, Electron microscopy techniques to study
structure/function relationships in catalytic materials, in: J. Domínguez-Esquivel,
M.R. M (Eds.), Advanced Catalytic Materials: Current Status and Future Progress,
2019, pp. 97–128. Springer, Cham.
[24] J.Y. Li, C.Q. Zhang, J.X. Jiang, J.H. Yu, O. Terasaki, A. Mayoral, Structure solution
and defect analysis of an extra-large pore zeolite with UTL topology by electron
microscopy, J. Phys. Chem. Lett. 11 (2020) 3350–3356.
[25] C.M. Li, Q. Zhang, A. Mayoral, Ten years of aberration corrected electron
microscopy for ordered nanoporous materials, ChemCatChem 12 (2020)
1248–1269.
[26] Q.M. Sun, N. Wang, T.J. Zhang, R. Bai, A. Mayoral, P. Zhang, Q.H. Zhang,
O. Terasaki, J.H. Yu, Zeolite-encaged single-atom rhodium catalysts: highlyefficient hydrogen generation and shape-selective tandem hydrogenation of
nitroarenes, Angew. Chem. Int. Ed. 58 (2019) 18570–18576.
[27] A.A. Coelho, Indexing of powder diffraction patterns by iterative use of singular
value decomposition, J. Appl. Crystallogr. 36 (2003) 86–95.
[28] M.C. Burla, R. Caliandro, B. Carrozzini, G.L. Cascarano, C. Cuocci, C. Giacovazzo,
M. Mallamo, A. Mazzone, G. Polidori, Crystal structure determination and
refinement via SIR2014, J. Appl. Crystallogr. 48 (2015) 306–309.
[29] M. Maache, A. Janin, J.C. Lavalley, J.F. Joly, E. Benazzi, Acidity of zeolites-beta
dealuminated by acid leaching - an ftir study using different probe molecules
(pyridine, carbon-monoxide), Zeolites 13 (1993) 419–426.
[30] Y. Lei, X. Chen, H. Song, Z. Hu, B. Cao, Improvement of thermal insulation
performance of silica aerogels by Al2O3 powders doping, Ceram. Int. 43 (2017)
10799–10804.
[31] E.M. Flanigen, H. Khatami, H.A. Szymanski, Infrared Structural Studies of Zeolite
Frameworks, Molecular Sieve Zeolites-, 1974, pp. 201–229.
[32] O. Cairon, S. Khabtou, E. Balanzat, A. Janin, M. Marzin, A. Chambellan, J.
C. Lavalley, T. Chevreau, Determination by Ir spectroscopy of the N(Al-fram) and
crystallinity level for amorphous phase containing hy zeolites, Zeolites Related
Microporous Mater. State Art 84 (1994) 997–1004.
Appendix A. Supplementary data
Supplementary data related to this article can be found at https://doi
.org/10.1016/j.micromeso.2021.110980.
References
[1] N. Nakazawa, T. Ikeda, N. Hiyoshi, Y. Yoshida, Q. Han, S. Inagaki, Y. Kubota,
A microporous aluminosilicate with 12-, 12-, and 8-ring pores and isolated 8-ring
channels, J. Am. Chem. Soc. 139 (2017) 7989–7997.
[2] N. Nakazawa, Y. Yoshida, S. Inagaki, Y. Kubota, Synthesis of novel aluminosilicate
YNU-5 and enhancement of the framework thermal stability by post-synthesis
treatment, Microporous Mesoporous Mater. 280 (2019) 66–74.
[3] H.K. Beyer, Dealumination Techniques for Zeolites, Post-Synthesis Modification,
2002, pp. 203–255.
[4] E. Bourgeat-Lami, F. Fajula, D. Anglerot, T.D. Courieres, Single-step dealumination
of zeolite-beta precursors for the preparation of hydrophobic adsorbents,
Microporous Mater. 1 (1993) 237–245.
[5] J. Scherzer, The preparation and characterization of aluminum-deficient zeolites,
Catalytic Materials: Relationship between Structure and Reactivity1984, pp. 157200.
[6] T. Masuda, Y. Fujikata, S.R. Mukai, K. Hashimoto, Changes in catalytic activity of
MFI-type zeolites caused by dealumination in a steam atmosphere, Appl. Catal.
Gen. 172 (1998) 73–83.
[7] G.J. Hutchings, A. Burrows, C. Rhodes, C.J. Kiely, R. McClung, Dealumination of
mordenite catalysts using a low concentration of steam, J. Chem. Soc. Faraday.
Trans. 93 (1997) 3593–3598.
[8] X.X. Zhang, D.G. Cheng, F.Q. Chen, X.L. Zhan, Dealumination kinetics of composite
ZSM-5/mordenite zeolite during steam treatment: an in-situ DRIFTS study, Chin. J.
Chem. Eng. 26 (2018) 545–550.
[9] D. Suttipat, T. Yutthalekha, W. Wannapakdee, P. Dugkhuntod, P. Wetchasat,
P. Kidkhunthod, C. Wattanakit, Tunable acid-base bifunction of hierarchical
aluminum-rich zeolites for the one-pot tandem deacetalization-henry reaction,
ChemPlusChem 84 (2019) 1503–1507.
[10] L.D. Borges, J.L. de Macedo, Solid-state dealumination of zeolite Y: structural
characterization and acidity analysis by calorimetric measurements, Microporous
Mesoporous Mater. 236 (2016) 85–93.
[11] Q. Liu, Y. Yoshida, N. Nakazawa, S. Inagaki, Y. Kubota, The synthesis of YNU-5
zeolite and its application to the catalysis in the dimethyl ether-to-olefin reaction,
Materials 13 (2020) 2030.
8