CANDU-6 fuel optimization for advanced cycles
Bạn đang xem bản rút gọn của tài liệu. Xem và tải ngay bản đầy đủ của tài liệu tại đây (3.13 MB, 14 trang )
Nuclear Engineering and Design 293 (2015) 371–384
Contents lists available at ScienceDirect
Nuclear Engineering and Design
journal homepage: www.elsevier.com/locate/nucengdes
CANDU-6 fuel optimization for advanced cycles
Emmanuel St-Aubin ∗ , Guy Marleau
Institut de Génie Nucléaire, École Polytechnique de Montréal, P.O. Box 6079, Station Centre-Ville, Montréal, Québec, Canada H3C 3A7
h i g h l i g h t s
•
•
•
•
New fuel selection process proposed for advanced CANDU cycles.
Full core time-average CANDU modeling with independent refueling and burnup zones.
New time-average fuel optimization method used for discrete on-power refueling.
Performance metrics evaluated for thorium-uranium and thorium-DUPIC cycles.
a r t i c l e
i n f o
Article history:
Received 8 February 2015
Received in revised form 28 May 2015
Accepted 2 June 2015
a b s t r a c t
We implement a selection process based on DRAGON and DONJON simulations to identify interesting
thorium fuel cycles driven by low-enriched uranium or DUPIC dioxide fuels for CANDU-6 reactors. We also
develop a fuel management optimization method based on the physics of discrete on-power refueling
and the time-average approach to maximize the economical advantages of the candidates that have been
pre-selected using a corrected infinite lattice model. Credible instantaneous states are also defined using
a channel age model and simulated to quantify the hot spots amplitude and the departure from criticality
with fixed reactivity devices.
For the most promising fuels identified using coarse models, optimized 2D cell and 3D reactivity device
supercell DRAGON models are then used to generate accurate reactor databases at low computational
cost. The application of the selection process to different cycles demonstrates the efficiency of our procedure in identifying the most interesting fuel compositions and refueling options for a CANDU reactor.
The results show that using our optimization method one can obtain fuels that achieve a high average
exit burnup while respecting the reference cycle safety limits.
© 2015 The Authors. Published by Elsevier B.V. This is an open access article under the CC BY-NC-ND
license ( />
1. Introduction
With the uranium mined in the last decades and a current
nuclear power exceeding 376 GWe worldwide (IAEA, 2015), easily
accessible resources are becoming scarce. Even if large scale technologies are available for the enrichment, the fabrication and the
recycling of uranium-based fuels, the decreasing accessibility and
the consequent fluctuations in the price of the yellow cake provide
an incentive to study more resource-efficient and alternative fuel
options, such as recycling and natural thorium conversion. The
renewed interest for thorium fuel cycles mainly comes from their
low long-life radiotoxicity (Guillemin, 2009), although the abundance of this resource has always been attractive to the nuclear
industry because of the capability to convert 232 Th into fissile 233 U.
∗ Corresponding author. Tel.: +1 4383940769; fax: +1 5143404192.
E-mail addresses: (E. St-Aubin),
(G. Marleau).
This nucleus has the best reproduction factor among all fissile isotopes in the thermal energy range (Á233 U ≈ 2.3 at 0.025 eV). Net
breeding is only possible in a reactor if the leakages and the nonproductive absorptions can be maintained below ∼0.3 neutron per
fission. This is very difficult to achieve in existing nuclear systems
(Nuttin et al., 2012), but was proven in the Shippingport LWBR
fueled with 232 Th/233 U seeds surrounded by fertile blanket assemblies (Olson et al., 2002). However, since 233 U is not present in
nature, it must be produced first in a nuclear reactor.
A prerequisite for the deployment of thorium breeding and
self-sufficient cycles (Critoph et al., 1976) is the generation of a
very large 233 U stock. It is also necessary to industrialize the natural thorium supply chain and to economically justify such major
investments. In the short-term, a preliminary step is to breed 233 U
from other sources. Another option is to burn it in situ to generate a rapid return on investment. Ideally, this would be achieved
in Generation IV reactors, like for instance MSR. However, the R&D
financial risks and the lack of adequate materials to build these
reactors with the promised efficiency may delay their take-off. In
/>0029-5493/© 2015 The Authors. Published by Elsevier B.V. This is an open access article under the CC BY-NC-ND license ( />0/).
372
E. St-Aubin, G. Marleau / Nuclear Engineering and Design 293 (2015) 371–384
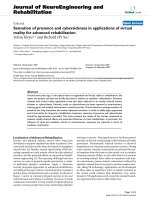
Fig. 1. 8-Bundle shift channel refueling procedure.
this context, the accumulated experience with Generation II and III
systems could convince the utilities to invest in the development
of existing reactors toward the use of thorium-based fuel cycles.
Recent studies on PWR (Bi et al., 2012), BWR (Martinez Francès
et al., 2012) and CANDU (Nuttin et al., 2012) abound this way.
In these systems, 232 Th conversion in 233 U is produced by neutrons provided by a fissile driver fuel, which must be as cheap as
possible in an economical optimization context. For this purpose,
many driver fuel candidates are considered. Here, we select LEU and
DUPIC (Direct Use of PWR spent fuel In CANDU) (Choi et al., 2001a,b)
drivers. Even if the DUPIC isotopic contents strongly depend on
the PWR operation history (Shen and Rozon, 1999), we consider a
unique composition for this fuel (see Table 1). This composition is
obtained by burning to 35 GWd/The a 17 × 17 PWR assembly initially fueled with 3.5 wt.% enriched UO2 in similar conditions that
exist at Yonggwang 1 (950 MWe) generating station (Choi et al.,
1997).
In addition to minimizing fuel cost, the costs for the reactor
enhancement must also be minimized by choosing an original
system as flexible as possible and able to spare neutrons for
thorium conversion. CANDU-6 (CANDU from now on) reactors
(Rouben, 1984) have a recognized potential for advanced fuel cycles
(Hatcher, 1976; IAEA, 2005; Jeong et al., 2008; Ovanes et al., 2012).
The pressure tubes design provides insulation between the high
pressure hot coolant and the low temperature moderator, both
composed of heavy water. These features offer a high moderating
ratio that allows the utilization of natural uranium as a fuel, but also
great fuel management flexibility since the core composition can
be changed at any given time. Reactivity management is achieved
during both normal and accidental conditions by numerous devices
designed for specific tasks. Therefore, CANDU reactors represent a
privileged environment to initiate the use of thorium-based fuels,
as long as the criticality can be maintained using appropriate
reactivity devices. To achieve these ambitious objectives, we propose here a fuel selection process based on the standard CANDU
deterministic calculation scheme. We first start with coarse low
computational cost models to identify the most promising fuels.
Accurate reactor databases are then generated for these options
using the cell and supercell optimization approach presented in StAubin and Marleau (2015). Then, we present in details a novel fuel
management optimization technique and analyze the results we
obtained for selected fuels. Future papers will assess the reactivity
devices adequacy with the selected cycles and propose innovative
techniques to adjust devices capability to manage such cycles.
Section 2 of this paper describes the modeling methodology
and the fuel preliminary selection criteria coherent with standard
CANDU operation. In Section 3, we develop an innovative optimization technique based on the physics of on-power refueling.
Advanced selection criteria for both optimal equilibrium and credible instantaneous states are then presented in Section 4. Finally,
perspectives for reactivity devices optimization are discussed in
Section 5.
2. CANDU reactors modeling for alternative fuels
This study is based on the 675 MWe CANDU reactor operated
at the Gentilly-2 power station in Canada from 1983 to 2013. The
cylindrical reactor vessel contains 380 horizontal (Z-axis) fuel channels placed on a square lattice pitch of 28.575 cm. The coolant flows
through two adjacent channels in opposite directions in a checkerboard pattern. During normal operation, refueling is carried out
by 2 fueling machines that are attached to both ends of a channel
that contains 12 identical fuel bundles 49.53 cm long. The front-end
(coolant inlet) machine pushes fresh fuel bundles in the channel
while the other recovers irradiated bundles (coolant outlet). The
usual 8-bundle shift refueling procedure is depicted in Fig. 1.
Each cell of the lattice is composed of a Cartesian region filled
with cold D2 O moderator that surrounds the calandria tube. A gas
gap provides insulation for the calandria tube and the moderator
from the hot D2 O coolant flowing in the pressure tube. The standard
37-element bundle is illustrated in Fig. 2, but an alternative 43element CANFLEX bundle, which has 1, 7, 14 and 21 fuel pins per
ring (instead of 1, 6, 12 and 18), is also considered here. In the
CANFLEX bundle, the 8 inner most pins are larger than the others to take advantage of the softer spectrum in the center of the
Table 1
Isotopic contents of average DUPIC.
Isotopes
234
U
U
U
238
U
237
Np
239
Pu
235
236
Contents (wt.%)
Isotopes
Contents (wt.%)
1.135E−4
9.242E−1
4.589E−1
9.759E+1
3.966E−2
5.541E−1
240
2.303E−1
8.391E−2
5.299E−2
5.356E−2
5.673E−5
1.095E−2
Pu
Pu
Pu
241
Am
242m
Am
243
Am
241
242
Fig. 2. Standard 37-element bundle cell structures and optimized discretization for
natural uranium fuel.
E. St-Aubin, G. Marleau / Nuclear Engineering and Design 293 (2015) 371–384
373
2.1. Fuels selection based on lattice calculations
2.1.1. Fuel composition and performance metrics
Several options have been considered to select fuels that achieve
high average exit burnups, such as mixing the ThO2 with the driver
fuel and concentrating it in the inner fuel pins. This last option maximizes the irradiation of 232 Th by a thermal flux provided by fission
in the outer fuel rings that contain UO2 or DUPIC-O2 . In such heterogeneous configurations, the thermal-to-fast flux ratio increases
as the radial distance to the center of the bundle decreases. We
assume that the densities of UO2 , ThO2 and DUPIC-O2 are respectively dU = 10.44 g/cm3 , dT = 10.0 g/cm3 and dD = 10.4 g/cm3 (Choi
et al., 1997).
To compare fissile contents of different fuels placed in different
configurations, it is useful to define some normalized metrics. The
normalized equivalent enrichment
Fig. 3. Reactivity device surrounded by fuel channels.
bundle, allowing for a decrease of the coolant void reactivity using
burnable poisons, or to increase fertile conversion. The coolant temperature is set at the channel-averaged temperature and the fuel
temperature is assumed to be constant over all fuel pins.
There are 6 types of reactivity devices in a CANDU: 21 stainless
steel adjuster rods (ADJ) normally inserted in the core to provide a
positive reactivity bank and to flatten the flux distribution; 14 liquid zone controllers (LZC) to manage power tilts caused by device
movements or on-power refueling; 4 mechanical control absorbers
(MCA) normally placed outside the core and inserted for bulk power
control; 28 shutoff rods (SOR) suspended above the core and used
for reactor shut down; boron poisoning nozzles (BPN) to insert a
boric acid solution in the moderator to control early core excess
reactivity; gadolinium poisoning nozzles (GPN) similar to BPN but
acting as a redundant shutdown system with the SOR. Since all
the reactivity devices are perpendicular to the fuel channels (vertical along the bottom-to-top Y-axis for ADJ, LZC, MCA and SOR; and
horizontal along the right-to-left X-axis for BPN and GPN), accurate
devices modeling must pass through 3D transport calculations, also
called supercell calculations. Devices are located at lattice interstitial sites, as depicted in Fig. 3 for a Y-oriented device. Here, BPN and
GPN are not simulated explicitly since for normal operation, they
are filled with heavy water and are made of structure materials
almost transparent to neutrons.
CANDU core modeling passes through 3 steps. First, transport
calculations are performed using a nuclear data library on a 2D
cell model to generate 2-group condensed and cell homogenized
burnup-dependent (B) diffusion coefficients DG (B) and macroscopic cross sections G
x (B) for each reaction of type x. Another
multigroup library is generated for use in the supercell models. 3D transport calculations are then performed for various
devices to generate 2-group condensed and homogenized increG and diffusion coefficients
mental macroscopic cross sections
x
DG libraries coherent with the 2D fuel properties (St-Aubin and
Marleau, 2015). The full core diffusion model is then set up using the
libraries thus generated. The neutron transport code DRAGON 3.06
(Marleau et al., 2013) deals with the 2D and 3D transport calculations (Marleau, 2006), whereas the neutron diffusion code DONJON
3.01 (Varin et al., 2005) solves the 2-group diffusion equation for the
finite core. This code has various algorithms to deal with on-power
fuel management (Chambon et al., 2007). Therefore, these opensource codes are well-suited for a numerical study of advanced fuel
cycles in CANDU. The cross section library we use with DRAGON is
the WLUP 69-group IAEA nuclear library (WLUP, 2005).
In this section, we first present our procedure for selecting
thorium-based fuels using simplified lattice calculations and generate the associated reactor databases. Then, we present the core
model used for the fuel management optimization.
NEE =
1
enat U
eU dU vU + eD dD vD
dU vU + dD vD + dT vT
(1)
gives information about the fissile weight at the beginning-of-cycle
(BOC) of a fuel containing vT , vD and vU volume fractions of ThO2 ,
DUPIC-O2 and UO2 respectively, compared with the UO2 reference
fuel. eU is the uranium enrichment in UO2 and enat U = 0.7114 wt.%.
For DUPIC, eD ≈ 1.60 wt.% is the weight ratio of fissile to total heavy
isotopes in the fuel at BOC (see Table 1). Note that NEE is not the
exact normalized fissile weight ratio since it is defined with dioxide densities instead of isotopic densities. The normalized uranium
contents
eU vU
NUC =
(2)
enat U vnat U
is the 235 U weight in a particular fuel normalized to the CANDU
reference 235 U weight (vnat U = 100 v.%). Finally, the fissile inventory
ratio
FIR =
mEOC
fissile
(3)
mBOC
fissile
is simply the end-of-cycle (EOC) to the BOC total fissile weight ratio.
The preliminary fuel selection step relies on 3 criteria based on
the k∞ evolution with burnup evaluated using a simplified infinite
lattice model with white reflexion boundary conditions applied on
the Wigner–Seitz cell (annular boundary that preserves the moderator volume in the cell). Since the infinite lattice model does
not take into account neutron leakage, reactivity device effects
and the presence of a neutronic poison in the moderator, we
define the effective criticality correction terms ık to approximate
these realities. Guillemin (2009) showed that ıkleaks = −3000 pcm,
while ıkdev = −2000 pcm for fully inserted ADJ and half-filled LZC
(Rouben, 1984), both terms being almost independent of burnup.
Poison concentration in the moderator (ıkpoisons (t)) is reduced as
the fuel burns and the initial transport eigenvalue k∞ (0) can be used
to estimate the maximal concentration needed for a particular fuel.
Since poisons are mainly used during the no-refueling early core
period, the static time tS is defined as the burnup time when poison concentration vanishes (ıkpoisons (tS ) = 0). This also corresponds
to the moment when refueling becomes necessary to maintain criticality:
k∞ (tS ) = 1 − ıkleaks − ıkdev = 1.050.
(4)
The cycle time tC is evaluated by computing the time period for
which the eigenvalue averaged over time becomes equal to the
effective criticality without poison:
k∞ (tC ) =
1
tC
tC
0
k∞ (t)dt = 1 − ıkleaks − ıkdev .
(5)
374
E. St-Aubin, G. Marleau / Nuclear Engineering and Design 293 (2015) 371–384
Table 2
Composition and fissile contents metrics for NU, TU and TD fuels.
fuel, maximal poisoning needs, tS and tC are respectively about 3.1,
3.6 and 4.3 times the values obtained for the NU fuel.
Fuels
vT (v.%)
vD (v.%)
vU (v.%)
eU (wt.%)
NEE
NUC
NU
TU
TD
0
60
18.92
0
0
81.08
100
40
0
0.7114
5.00
–
1
2.88
1.83
1
2.81
0
2.1.2. Reactor databases generation
The 2-group burnup-dependent fuel reactor databases are generated using the optimized cell models (St-Aubin and Marleau,
2015) combined with a homogeneous B1 leakage method (Petrovic
and Benoist, 1996) in order to obtain diffusion coefficients that
are representative of core leakage. A reactor database containing
the reflector properties at the most probable core burnup BS =
Pcell tS /mhe is also created, where mhe is the total initial heavy element mass in the bundle. The multigroup library used for the 3D
reactivity device modeling is also generated at BS . Supercell calculations are then performed to generate the incremental cross sections
G (and diffusion coefficients
DG ) that reflect the impact of a
x
G are evaluated
device on the cell averaged cross sections. The
x
using 3 successive transport calculations corresponding to different supercell states. For the “IN” state, the device is totally inserted
in the supercell, or the LZC is totally filled with light water. For the
“OUT” state, the device is totally extracted, or the LZC is filled with
4 He gas. For the “NO” state, the device is replaced with moderator.
The impact of a device (dev), its guide tube (tube) or both together
(total) on cell cross sections can be computed as:
G
x,dev
Fig. 4. Variation of k∞ with burnup time and evaluation of static (tS ) and cycle (tC )
times for NU, TU and TD fuels.
=
G
x,IN
G
x,OUT ,
−
G
x,tube
=
G
x,OUT
G
x,total
=
G
x,IN
−
−
G
x,NO ,
G
x,NO .
(7)
(8)
(9)
Fuels with a high potential must yield static and cycle times better
or equal to the reference cycle, respectively tSref and tCref , in addition
to relatively low poisoning needs:
We used the accelerated pseudo-exact approach described in
St-Aubin and Marleau (2015) to generate the reactivity devices
databases for all fuels and devices types.
k∞ (0) ≤ 1.4, tS ≥ tSref and tC ≥ tCref .
2.2. Full core model
(6)
To illustrate the selection process, we will follow 2 thoriumbased fuels in addition to the reference natural uranium fuel (noted
NU from now on). ThO2 , DUPIC-O2 and UO2 volume fractions,
uranium enrichment and fissile contents metrics for both thoriumbased fuels are presented in Table 2. Note that the homogeneous TU
(thorium–uranium) fuel is placed in a CANFLEX 43-element bundle, while NU and TD (thorium-DUPIC) are placed in a 37-element
bundle. For the TD fuel, ThO2 fills the central pin and the inner most
fuel ring (7 pins) while the 2 outer rings are filled with DUPIC dioxide. For this fuel, NUC = 0 since all the uranium it contains comes
from recycling.
For fuels that respect the criteria of Eq. (6) when evaluated
with coarse Wigner–Seitz cell model, we repeat the analysis using
the optimized cell model presented in St-Aubin and Marleau
(2015). The mesh discretization for NU fuel is depicted in Fig. 2.
Burnup calculations are then performed using the optimized
cell models. Fig. 4 illustrates k∞ burnup curves at constant
power (Pcell = 615 kWth, typical of the CANDU reactor producing
Ptotal = 2064 MWth) as function of time t. The initial eigenvalue
k∞ (0), the static time tS and the cycle time tC for NU, TU and TD
fuels are also illustrated in this figure. All the curves are governed
by 3 physical processes: the 135 Xe dynamic with a rapid decrease
of the reactivity during the first few days, the built-up of fission
products and the decreasing fissile contents, both resulting in a
slow reduction of the reactivity with burnup. Unlike the NU case,
the plutonium peak is not present for TD and TU fuels, since their
fissile contents (NEE) are much higher than for NU. The slope of the
TD curve at the beginning of irradiation is lower than for the other
cases, because it already contains a large amount of irradiated fuel.
Globally, one needs a larger initial poison concentration (factor of
3.3) for TD than for NU fuel. The static and cycle times for this fuel
are 2.2 and 2.6 times larger than that of the reference. For the TU
Once the fuel (burnup-dependent), reactivity devices and reflector 2-group cross section libraries are available, the full core model
can be set up. Typically, a Cartesian mesh is used to represent the
fuel bundles, the reactivity devices, the radial reflector and the
nonuniform cylindrical reactor vessel. There is no axial reflector
in CANDU to let fueling machines move freely. Along the Z-axis,
12 planes all 49.53 cm thick are defined in order to associate one
region with every fuel bundle k in channel j. All the planes have
the same 2D Cartesian mesh that fits exactly the fuel channels configuration. The radial reflector volume is simulated by regions of
variable height and width. To save on reflector, there is a 2-plane
thick notch in the reactor vessel at both ends. Some dummy regions
are added to complete a rectangular prism. Here, we also replace
the physical no incoming flux by zero flux boundary conditions.
The 380 fuel channels are grouped into radial zones used for
various simulation purposes. Here, we will distinguish 2 types
of zones: refueling zones (Nr = 95) with four channels having a
quarter-core rotation symmetry and burnup zones (Nz = 3) grouping several refueling zones together (Nj,z channels each). For our
model, burnup zone 1 has 36 channels and groups refueling zones
1–9; burnup zone 2 has 140 channels and groups refueling zones
10–44; and burnup zone 3 has 204 channels and groups refueling
zones 45–95. Fig. 5 presents the channels and refueling zones numbering, the burnup zone limits (coarse lines), the reflector regions
present all along the reactor axis (R) and those present only in the
8 middle planes (R).
Reactivity devices are then superimposed on the nuclear lattice.
3D Cartesian boxes (49.53 cm long, 28.575 cm wide, variable height
in Y) centered between 2 fuel channels represent the volume that
is directly affected by the presence of fully inserted devices
(filled LZC). Since a particular device can be defined with different
E. St-Aubin, G. Marleau / Nuclear Engineering and Design 293 (2015) 371–384
375
with G
x (Bjk ) directly interpolated for cell jk in DONJON from the
burnup-dependent fuel database. If a portion p of device d in
p,d
position Yd crosses a core region jk (volume Vjk (Yd )), the fuel
G,p
macroscopic cross sections are incremented by
weighted
x,dev
by the volume fraction the device occupies. Fixed guide tubes
(denoted t) are taken into account in the same way. As a result,
we have:
p,d
G
(Y )
x,jk d
Vjk (Yd )
=
d
p∈d
Vjk
G,p
x,dev
t
Vjk
+
t
Vjk
G,t
,
x,tube
(11)
t represents the volume occupied by a guide tube in the
where Vjk
cell jk and Vjk is the volume of the cell.
3. Fuel management optimization
Fig. 5. CANDU quarter core with channels and refueling zones identification, burnup
zones limits and reflector regions.
Having discarded noninteresting fuels based on the infinite lattice calculations and set up an accurate core model, the next step
is to maximize the potential of the remaining fuels by applying an
appropriate on-power refueling strategy. To reach this goal, the
core analysis passes through 2 simulation steps: (1) an asymptotic time-average state and (2) several instantaneous states likely
to occur during the operation of the reactor and used to quantify
departures from equilibrium of the main core characteristics. In
this section, we first present the on-power refueling process and
describe the time-average model used to achieve the equilibrium
state. Then, we discuss the optimization procedure we propose for
the refueling strategy that maximizes the core average exit burnup
while respecting the fundamental constraints required to ensure
core integrity. Finally, a simple way to generate instantaneous
states is presented.
3.1. On-power refueling and time-average model
Fig. 6. Configuration of reactivity devices in the XZ-plane.
configurations (or compositions for LZC) along its height, in general
these boxes are divided into several parts of variable heights along
the Y-axis. To simulate the motion of a device, the associated box
and all its parts are moved in tandem. The position Yd of device d
(in % of full insertion) is defined relative to the declared box in the
core. For LZC filling, the boundary between the filled and emptied
parts is modified, but the box position remains unchanged. Note
that a fixed box is also declared for every guide tubes, denoted t.
Fig. 6 illustrates reactivity devices configuration in the XZ-plane.
The diffusion system can then be set up. For known fuel bundle
burnup Bjk and reactivity device positions Yd , the lattice properties
are given by
G
(B , Yd )
x,jk jk
=
G
x (Bjk ) +
G
(Y ),
x,jk d
(10)
To characterize the CANDU on-power refueling process, we will
use a strategy that is divided in 2 components. The axial strategy
that represents the number ns of fresh fuel bundles loaded in a
channel at once (see Fig. 1) controls the flux shape along the core
axis. Here, we consider a constant axial strategy for every channels. The radial strategy is related to the channels refueling rate
and is expressed in terms of the time-average channel exit burnup.
Both strategies are mainly selected to flatten the flux distribution in
the core and avoid thermal-hydraulic limits while maximizing the
energy extracted from the fuel under particular power constraints.
Using a fixed refueling strategy leads to an equilibrium state
that is reached after several months of normal operation. As the
core is refueled (starting at t ≈ tS ), the average burnup of bundles
discharged increases, as well as the average in-core fuel burnup.
As a result, the insertion of reactivity due to refueling increases.
Consequently, the refueling period Tj , defined as the time period
elapsed between two successive refuelings of the channel j, gradually increases and tends to a maximal value Tj . Then, the refueling
rate and the average device positions become almost constants, as
long as the refueling strategy and the physical parameters of the
core remain unchanged. This asymptotic static state is maintained
by operators during most of a CANDU lifetime.
Modeling such a state requires adequately averaged macroscopic cross sections and diffusion coefficients, in such a way that
the refueling strategy is implicitly taken into account. Considering
a burnup distribution Binitial
before the last refueling, a constant
jk
bundle power distribution Pjk between refuelings and a burnup
376
E. St-Aubin, G. Marleau / Nuclear Engineering and Design 293 (2015) 371–384
increment ıBjk for bundle k in the channel j for a period Tj , the final
burnup distribution is
Pjk Tj
Bfinal
= ıBjk + Binitial
=
jk
jk
mhe
k ≤ ns
0,
+
Bfinal
,
j(k−n )
s
k > ns
,
(12)
e
G
Hjk
G
Hjk
G
jk
the energies recovered by fission in group G times the fission
G .
f,jk
Rozon et al. (1981) defined the time-average
e
channel exit burnup Bj as
1
ns
e
Bj =
12
ıBjk =
k=1
1
ns
12
Pjk Tj
mhe
k=1
Pj Tj
=
mhe ns
,
(14)
where Pj =
P is the channel power and the bar notation indik jk
cates asymptotic values at equilibrium, i.e. when Tj → Tj . Note that
the time-average bundle burnup increment can also be expressed
e
as ıBjk = ns Bj jk , where jk = Pjk /Pj is the time-average axial
power shape. The time-average lattice properties are then computed using
G
x,jk
=
G initial
final
, Bjk ) +
x (Bjk
G
(Y )
x,jk d
(15)
where
final
G initial
final
, Bjk )
x (Bjk
Bjk
1
=
e
ns Bj
jk
initial
Bjk
G
x (Bjk )dBjk
(16)
G (Y ) is defined in Eq. (11) with the devices in their nomx,jk d
and
inal position: YADJ = 100%, YLZC = 50% and YMCA = YSOR = 0%.
To represent accurately the axial symmetry in the core provided
by bi-directional refueling and coolant flow, the axial power shape
is averaged over each refueling zone r, such that
rk
j∈r
=
Pjk
j∈r
k
Pjk
=
j ∈ r.
jk ,
(17)
The refueling zones are also used to compute the symmetrical 2group axial flux shape
G
jk
j∈r
G
ϕrk =
j∈r
G
G
jk
k
= ϕjk ,
j ∈ r,
which is strongly related to
jk .
(18)
Here,
G
G
jk
is the 2-group diffusion
solution obtained with x,jk defined in Eq. (15). To simplify the
radial description of the time-average core, the time-average channel exit burnups are assumed to be constants over each burnup
e
e
zone: Bz = Bj for j ∈ z.
With this model, the time-average exit burnup averaged over
e
the core B and the time-average core refueling rate F are respectively
e
B
=
1
380
380
e
Bj =
1
380
F=
380
Fj =
j=1
j=1
3
e
Nj,z Bz ,
(19)
z=1
j=1
380
e
e
(21)
(13)
the 2-group diffusion flux in the region jk of the core and
cross sections
e T
3.2. Refueling strategy optimization
G
,
jk
G
with
e
B = [B1 B2 B3 ] = B1 [1 R2 R3 ]T = B1 R.
where Pjk is given by
Pjk =
where Pz =
P is the time-average zone power. The 3-burnup
j∈z j
zone radial refueling strategy can be defined as the relative timeaverage zone exit burnup. For simplicity, a vector notation will be
used for the burnup vector B and the radial refueling strategy R:
1
Tj
=
1
mhe ns
380
Pj
e
j=1
Bj
=
1
mhe ns
3
Pz
e,
z=1
Bz
CANDU fuel management optimization at equilibrium has
been widely investigated in the past. Rozon et al. (1981) have
implemented an optimization method based on the first-order generalized perturbation theory (GPT) applied to 2-group diffusion
equation in the first version of the OPTEX (OPTimization EXplicit)
code. The code capabilities were then extended by Alaoui (1985),
Nguyen (1987), Beaudet (1991), Tajmouati (1993) and Chambon
(2006). The objective has always been to minimize, under constraints, the fuel cost per unit burnup represented by the objective
function
FC =
Cj
1
Ptotal
e Pj ,
j
where Cj is the cost of a bundle loaded in the channel j and Ptotal
is the thermal power of the reactor. A decision vector D collecting
the main core characteristics (eigenvalue, zone exit burnups, etc.) is
used to represent the core behavior. The evaluation of the gradient
∇ D FC around a feasible point Dn allows to aim step-by-step toward
D corresponding to the optimal fuel management for a given fuel.
Chambon et al. (2007), Chambon and Varin (2008) have examined alternative gradient and metaheuristic methods, such as the
multi-step (MS), the augmented Lagrangian (AL) and the Tabusearch (TS) methods to minimize FC . Basically, the MS method
consists in solving sequentially several optimization problems to
meet all constraints one after the others. For the AL method, the
constraints are directly introduced into the objective function as
additional penalty terms. Unlike gradient methods, TS allows to get
out of a local extremum by letting the AL-like objective function
gets worse during an exploratory phase. Then, an intensification
phase is carried out in the vicinity of the best estimate to refine the
optimum D .
These developments have inspired the method proposed in this
e
paper that consists in maximizing B defined in Eq. (19) subject
to time-average convergence of the macroscopic cross sections and
diffusion coefficients (see Eq. (16)), criticality, bundle and channel
power constraints. We selected a MS-like method implemented
with 3 embedded iteration levels. First, the axial iteration level is
used to converge the time-average lattice properties for an imposed
burnup vector B. For the critical iteration, convergence is on keff = 1
for a fixed radial refueling strategy R. Finally, the radial iteration
determines the optimal radial refueling strategy R by maximizing
an AL-like objective function.
3.2.1. Axial iteration
The axial iteration has the difficult task to solve the non-linear
problem of discrete refueling in CANDU reactor using the timeaverage approach. Since the time-average fuel properties (see Eq.
(16)) depend (indirectly) on the axial flux shape, it is crucial to
G
determine precisely ϕjk , in such a way that it is coherent with the
refueling strategy (ns , R). Thus, the axial iteration goal is to make
G,n
G
the sequence ϕrk axial converge to ϕrk with a maximal error εaxial ≤
εmax
.
The
axial
convergence
parameter
axial
G,naxial
(20)
(22)
Bj
axial
εnaxial
= max
r,k,G
ϕrk
G,naxial −1
− ϕrk
G,naxial
ϕrk
(23)
E. St-Aubin, G. Marleau / Nuclear Engineering and Design 293 (2015) 371–384
377
is computed at each iteration naxial . An axial iteration consists in
refueling the core with a fixed B, and then performing a timeaverage diffusion calculation. This calculation sequence is repeated
axial < εmax ) or
until the stopping criterion of the axial iteration (εnaxial
axial
max
the maximal number of iterations (naxial = naxial ) is reached.
G,0
Before the first iteration is performed, ϕrk is initialized using
a cosine shape over the 95 refueling zones, whereas the burnup
e
zone average exit burnups Bz are initialized according to Eq. (21)
e,0
using B1 = 8 GWd/The and the imposed R. This sets the initial burnup distribution B0jk = Binitial
= Bfinal
and the fuel macroscopic cross
jk
jk
sections (by direct interpolation in the database) over the core.
All channels are then refueled with ns fresh bundles which modifies the distribution Bfinal
according to Eq. (12). This is where the
jk
distinction between the refueling and the burnup zones is important. Since each refueling zone has channels with axial and radial
symmetries placed in a similar neutronic environment, the zone
refueling causes symmetrical and low amplitude perturbations of
G,n
G,n
−1
ϕrk axial when compared with ϕrk axial . This makes the convergence easier especially for a refueling strategy poorly adapted to a
particular fuel. If a model using Nr = 380 refueling zones counting
only Nj,r = 1 channel per zone is used instead, divergent oscillations
G,n
of ϕrk axial are observed since the axial symmetry is not taken into
e
account. Physically, as soon as Bz is too high, a flux distorsion is
induced toward the channel front-end and the equilibrium cannot
be reached since this effect is amplified at each iteration. On the
other hand, if Nr = Nz (one refueling zone per burnup zone) is small,
G,naxial
the quality of the diffusion solutions jk
greatly decreases since
the axial power shape is evaluated over zones that are too large and
fine refueling effects are lost during the averaging process. In other
G
words, x is ill-defined even at equilibrium. Finally, if Nr = Nz is
large, the optimized refueling strategy would be difficult to reproduce in reality, since it would be defined over regions that are too
small. Therefore, our model combines the advantages of having
small refueling zones to take into account the fine axial refueling
effects and large burnup zones to define a realistic radial refueling
strategy.
Once the diffusion system is initialized, DONJON solves it to
determine the multiplication factor keff and the 2-group flux over
the whole core. The axial flux shape and the axial convergence
parameter are then evaluated using Eqs. (18) and (23). Note that
according to Eq. (23), it is necessary to perform at least 2 axial
axial to be meaningful. Finally, the
iterations before considering εnaxial
diffusion solution is normalized to the core total thermal power
Ptotal = 2064 MWth.
Fig. 7. Algorithm for the equilibrium search.
e,−
e,+
Choosing an adequate interval [B1 , B1 ] is not a simple task.
e,±
Even if information on B1 can be deduced from the cycle time
e
tC ( B ≈ Pcell tC /mhe ), a preliminary search must be carried out to
initialize the Brent’s algorithm adequately. To do so, we have implemented a trial-and-error bounds search algorithm that has the role
of finding 2 axially converged time-average core states with depare,±
±
±
max .
= ıkeff (B1 ) such that |ıkeff
| < ıkeff
tures from equilibrium ıkeff
In order to converge to a critical equilibrium, it is necessary to
verify the effect of the guessed B on the axial convergence after
each axial iteration performed during the bounds search and the
e
axial depends indirectly on B . A logic to
critical iteration since εnaxial
1
control input parameters has been set up based on the physics of
on-power refueling. Its objective is to accelerate the convergence
when possible by choosing more appropriate input parameters and
to eliminate problematic cases using comparable quantitative criteria. Fig. 7 depicts the equilibrium search algorithm, whereas Fig. 8
presents the input parameters control logic used during the bounds
search.
Once the axial convergence has been achieved, the departure
from criticality is assessed in order to determine if a bound has
naxial | ≥ ıkmax , the algorithm takes path C (see
been found. If |ıkeff
eff
e
Figs. 7 and 8): adjusts the guessed B1 , resets the burnup distribution Bjk accordingly (as described in Section 3.2.1) and increments
e,±
3.2.2. Critical iteration
The equilibrium state is reached in a critical reactor once the
axial refueling iteration has converged and the components of B
become maximal. The critical iteration objective is finding the root
Bcritical of the equation for the time-average departure from criticality:
ıkeff (B) = 105 pcm × [keff (B) − 1] = 0.
naxial . Otherwise, a bound B1 has been found and the algorithm
e
takes path A: adjusts B1 , resets Bjk accordingly and naxial to 0 before
(24)
Since the refueling strategy is imposed at this level, the departure
e
from criticality is a function of only the variable B1 according to Eq.
e
(21). The root B1,critical is found using the Brent’s method (Brent,
1973) implemented in the FIND0: module of the GAN Generalized
Driver (Roy and Hébert, 2000) that manages the DRAGON and DONJON codes. As input parameters, this algorithm requires an interval
e,−
e,+
e,−
e,+
[B1 , B1 ] such that ıkeff (B1 ) × ıkeff (B1 ) < 0, a maximal number of iteration nmax
and a tolerance ıBe > 0. Here, we have used a
critical
1
very small tolerance and we have verified, as an external condition
e
to the Brent’s method, that ıkeff (B1,critical ) ≤ εmax
.
critical
Fig. 8. Control logic for the bounds search.
378
E. St-Aubin, G. Marleau / Nuclear Engineering and Design 293 (2015) 371–384
e
searching for the second bound. In all cases, the adjustment of B1
is performed using
e,naxial +1
B1
e,naxial
= B1
where
e
B1 (ıkeff )
+
e
naxial
B1 (ıkeff
),
⎧
10,
⎪
⎪
⎪
⎪
⎪
5,
⎪
⎨
ıkeff
×
=
2,
|ıkeff | ⎪
⎪
⎪
⎪
⎪ 1,
⎪
⎩
0.5,
(25)
|ıkeff | >
7500
if 7500
≥ |ıkeff | >
5000
if 5000
≥ |ıkeff | >
2500 (26)
if 2500
≥ |ıkeff | >
1000
if
otherwise
e
with ıkeff given in pcm (see Eq. (24)) and B1 in GWd/The .
G,naxial
axial ≥ εmin and n
If εnaxial
is still biased by the iniaxial < 2, ϕrk
axial
tialization, thus another axial iteration is performed with the same
input parameters by following path B. If naxial ≥ 2, the algorithm
axial is decreasing (εnaxial < εnaxial −1 ). In
verifies if the sequence εnaxial
axial
axial
that case, and if the maximal number of axial iterations has not
axial ≥
been reached, the algorithm takes again path B. However, if εnaxial
max
naxial < εnaxial −1 (see Fig. 8), the algoaxial −1 , or n
εnaxial
axial ≥ naxial and εaxial
axial
axial < εmax ),
rithm verifies if an acceptable convergence level (εnaxial
axial
corresponding to the tolerance on the time-average cross sections
defined in Eq. (16), is achieved.
If the latter condition is respected, the algorithm then checks if
naxial | < ıkmax : in the affirmative, a bound has been found and the
|ıkeff
eff
algorithm continues on path A. Otherwise, Cmax additional chances
are given to the current cycle to achieve one of the cases already
e
G,n
presented by adjusting B1 , resetting ϕrk axial and Bjk and restarting an axial iteration (path D). Here, all the input parameters are
reset since the last time-average flux distribution is very far from
the desired behavior. The algorithm will then try to reach the equie
librium from a more realistic B1 . However, if C > Cmax the refueling
strategy is definitively rejected for the current fuel (path F).
axial ≥ εmax and 0 > −ıkmax ≥ ıknaxial , the
In the case where εnaxial
eff
axial
eff
refueling strategy (ns , R) is directly rejected (path F). Indeed, if
axial exceeds εmax after at least 2 axial iterations but the sequence
εnaxial
axial
is still decreasing, this indicates that the convergence is slow for the
e
imposed input parameters. Moreover, B1 will have to be decreased
e
n
before the next iteration ( B1 (ıkeffaxial ) < 0), thus decreasing the
refueling effect on the core reactivity. Therefore, the next set of
input parameters will slow down even more the axial convergence
and the equilibrium cannot be found within the limits of the algonaxial ≥ ıkmax > 0, the axial convergence rate
rithm. However, if ıkeff
eff
could be improved using input parameters more adapted to the cure
naxial ) > 0, but the logic
rent fuel and refueling strategy since B1 (ıkeff
of chances (C) is activated again. Note that the number of chances C
allowed is always incremented whenever the logic is activated and
independently of the path leading to its activation. This logic can
be totally removed from the algorithm, but could lead to an early
rejection of a refueling strategy. We decided to give more chances
to the candidates to reach the equilibrium at this level and discriminate them later (if needed) during the radial iteration presented in
Section 3.2.3.
The bounds search algorithm is executed as often as needed
(unless the refueling strategy is rejected) to find the 2 bounds
e,±
B1 necessary to initialize the Brent’s method. When a bound is
found, it is compared with those found before. Only the bounds
that are the closest to criticality are kept in memory. Once the
2 bounds are known, they are input in the FIND0: module that
e,n
e
returns an estimate B1 critical of the root B1,critical . Axial iterations are
then performed using this estimate until axial convergence. Then,
ncritical ≤ εmax , the solution is considered to be the equilibif ıkeff
critical
e,ncritical +1
is defined according to
rium state (path E). Otherwise, B1,critical
Eq. (25) and is used with R to reset Bjk , and so on. If the Brent’s
Fig. 9. Control logic for the critical iteration.
method does not converge, the refueling strategy is rejected. During the critical iteration, the control logic used during the bounds
search (Fig. 8) is replaced with that presented in Fig. 9. The main differences between the two logics are: the stopping criterion εmin
is
axial
replaced by εˆ min
= max{ε+
, ε−
, εmin
} that takes into account
axial
axial
axial
axial
the precision previously obtained on the bounds; the condition
naxial < 2 is removed since good estimates of the equilibrium state
are already known; and finally, the convergence on the criticality
ncritical | < εmax . Table 3 presents the modeling
is now explicitly |ıkeff
critical
parameters used for the equilibrium search algorithm.
3.2.3. Radial iteration
Now that a stand-alone algorithm able to determine the equilibrium state for a given refueling strategy (ns , R) is available, it
is implemented in a larger calculation scheme to find the optimal
radial refueling strategy R (ns ) for a given fuel composition and
axial refueling strategy ns . This optimum depends on the optimization constraints and search methodology considered. As mentioned
at the beginning of Section 3.2, most of the optimization methods
cannot get out of a local extremum during the search, and thus may
tend to a local optimum. Gradient and alternative gradient methods
are thus based on the implicit assumption that the objective function is concave all over the search domain. Our method is based
on the same simplifying assumption, but we will check if the optimum R (ns ) leads to adequate time-average core characteristics
using some post-optimization selection criteria in Section 4.
The notion of optimal fuel management is based on the fundamental constraints that must be respected at all time. In addition
to criticality, the power distribution must be shaped in such a way
as to avoid damages to the reactor. Here, we consider two thermal phenomena that could compromise the core integrity. First, a
lim
time-average bundle power limit Pjk is imposed to prevent fuel
damage. The critical heat flux can also be achieved if the channelintegrated power exceeds the coolant flow capacity to extract the
heat from the fuel bundles in the channel. Cladding dry out is
lim
avoided by imposing a time-average channel power limit Pj
lim
lim
ically, Pjk = 860 kW and Pj
. Typ-
= 6700 kW (Chambon et al., 2007).
max
For a critical reactor with low maximal bundle (Pjk
= maxPjk ) and
jk
Table 3
Equilibrium search parameters.
Iteration level
Parameter
Axial
B1
nmax
axial
εmax
axial
min
εaxial
8 GWd/The
20
5 × 10⁻²
5 × 10⁻⁴
Bounds search
max
ıkeff
500 pcm
Critical
e,0
max
C
nmax
critical
εmax
critical
Value
5
100
1 pcm
E. St-Aubin, G. Marleau / Nuclear Engineering and Design 293 (2015) 371–384
max
channel (Pj
= maxPj ) power peaks, it is also crucial to ensure
j
that the refueling machines can follow the pace imposed. Since the
e
time-average channel exit burnup Bj is proportional to the channel
refueling period Tj (see Eq. (14)), the objective of maximizing the
e
core average exit burnup B is equivalent to time-average core
refueling rate minimization.
In order to take simultaneously into account all constraints during the optimization, we define an AL-like objective function
max
max
(εaxial , Pjk , Pj
e
max
max
, B ) = E(εaxial ) + P(Pjk , Pj
e
) + B( B )
as the sum of 3 terms. The E penalty term is a negative step function
related to the axial convergence obtained for the refueling strategy
R(ns ):
⎧
−500, if 5 × 10⁻²
⎪
⎪
⎪
⎪
⎪
⎪
−10,
if 1 × 10⁻²
⎪
⎪
⎪
⎪
⎨ −4,
if 5 × 10⁻³
E(εaxial ) =
⎪
−1,
if 1 × 10⁻³
⎪
⎪
⎪
⎪
⎪
⎪
−0.5 , if 5 × 10⁻⁴
⎪
⎪
⎪
⎩
0,
≤
εaxial
≤
εaxial
<
5 × 10⁻²
≤
εaxial
<
1 × 10⁻²
≤
εaxial
<
5 × 10⁻³
≤
εaxial
<
1 × 10⁻³
(28)
otherwise.
The P term is also a negative step function that qualifies how far
the system is from respecting the time-average power constraints:
⎧
max
lim
max
lim
⎪
−200, if Pjk > Pjk
and Pj
> Pj
⎪
⎪
⎪
⎪
⎨ −100, if Pmax ≤ Plim and Pmax > Plim
max
max
jk
jk
j
j
P(Pjk , Pj ) =
(29)
max
lim
max
lim
⎪
⎪
−50,
if
P
>
P
and
P
≤
P
⎪
jk
jk
j
j
⎪
⎪
⎩
0,
otherwise.
Finally, the B term is simply the ratio of the core average exit burnup
e
to the reference core average exit burnup Bref :
e
B( B ) =
e
B
.
e
Bref
(30)
Therefore, for the reference cycle, = 1. Physically, the maximization of
is equivalent to searching for a coherent and critical
time-average flux distribution
e
G
jk
Once the exploration phase is completed, the intensification
phase (nradial >0) is carried out in the same way, except that the
starting point is not 1, but Rnradial −1 which is already known. Consequently, the intensification subsets count only 8 steps:
that maximizes the core average
exit burnup B while maintaining the power peaks below the limits imposed by the cooling system. Note that if the algorithm is not
able to find a critical time-average state, is automatically sets to
−500.
The algorithm in charge of maximizing the objective function
is divided in two phases. First, an exploration phase (nradial = 0)
spans R2 and R3 in all directions (see Eq. (21)) in the vicinity of the
unit radial refueling strategy 1 = [1 1 1] (R2 = R3 = 1) in order to
determine the optimal radial refueling strategy Rnradial . We selected
R2 ∈ 87 , 1, 54 and R3 ∈ 78 , 1, 54 for this exploration phase, for
a total of 9 possible combinations of time-average exit burnup
m
radial profiles Rnradial . We introduced an asymmetry between the
sub-domains R ≥ 1 and R < 1 since the Rz are defined relative to
e
e
the central burnup zone and we expect B1 to be larger than B2
e
and B3 (Chambon, 2006). The maximal uncertainties R±
z,nradial =
±(Rz − 1) on Rz,nradial in the sub-domains Rz ≥ 1 (+) and Rz < 1 (−)
are respectively 1/4 and 1/8 in such a way that the domain Rz < 1
is scanned with a finer mesh. For completeness, the sub-domain
Rz ≥ 1 is also scanned since for a 1D reflected reactor continuously
and bi-directionally refueled, the optimal exit burnup profile favors
a lower burnup at the center of the core (Wight and Girouard, 1978).
R±
2,n
• R
2,nradial −1 ±
• R
±
2,nradial −1
• R
2,n
radial −1
with
(27)
379
radial
R±
2,nradial
with R3,n
with R3,n
±
with R3,n
,
radial
R±
z,nradial =
radial −1
−1 ±
R±
z,n
radial −1
radial −1
R±
3,n
radial
R±
3,n
radial
,
,
/2 in such a way that the maximal
uncertainty on Rz is divided by a factor of 2 at each iteration. Contrarily to the Tabu search method, the algorithm is not able to get
out of a local extremum, since it evaluates the objective function
only in the vicinity of the last pre-computed optimum. The optimal
R (ns ) is assumed to be found after 3 radial iterations (nradial = 2).
The associated maximal uncertainties are thus 1/16 if Rz ≥ 1 and
1/32 if Rz < 1. More details on the optimal radial refueling strategy
search algorithm are provided in St-Aubin and Marleau (2011) and
St-Aubin (2013).
3.3. Instantaneous states
Instantaneous calculations consist simply in computing the flux
G for a known burnup distribution B and reactivity
distribution jk
jk
device positions. Therefore, only one diffusion calculation is needed
per instantaneous state, provided credible burnup distributions are
available. To determine burnup distributions Bjk representative of
the on-power refueling, we use the bundle age
initial
Ajk =
Bjk − Bjk
initial
=
ıBjk
Bjk − Bjk
(31)
e
ns Bj
jk
which is based on the pre-computed optimal equilibrium state.
Assuming that Bjk is linear with time (or that Pjk and ıBjk are
constants), the bundle age Ajk should be the same for all bundles
k ≤ ns in the channel j at equilibrium. If one considers that this age
is the same for all 12 bundles in channel j, the channel age Aj is
then defined as a fraction of the time-average refueling period Tj
(0 ≤ Aj ≤ 1) and represents the elapsed time since the last refueling of the channel. Moreover, assuming that Pjk varies linearly with
time in the vicinity of Pjk , then Pj > Pj for channels with Aj < 12 ,
whereas Pj < Pj for channels with Aj > 12 . With this channel age
model, any instantaneous core state occurring after the equilibrium
(assuming that the same conditions remain) can be represented by
a channel age distribution, such as
Bjk = Binitial
+ Ajk ıBjk ≈ Binitial
+ Aj ıBjk .
jk
jk
(32)
Since Aj is nearly linear with time, then the core averaged chan1
A = 12 and the resulting core state should be
nel age Aj = 380
j j
almost critical (ıkeff ≈ 0). To generate such channel age distributions, we decided to apply a pre-determined channel age pattern
Oj ∈ N∗ , such as
Aj =
Oj − A j
380
=
Oj − 1/2
380
,
(33)
where 1 ≤ Oj ≤ 380 and Oj represents the refueling order of channel j.
The algorithm used to assign Oj to each channel is based on a
subdivision of the core into 16 blocks counting at most 36 channels. First, one chooses in which block the next channel will be
refueled, followed by the selection of the channel in the block. A
channel fueling sequence common to all the blocks is used. This
tends to scatter the refueled channels across the core and thus
to underestimate the hot spots. However, this is coherent with
380
E. St-Aubin, G. Marleau / Nuclear Engineering and Design 293 (2015) 371–384
Fig. 10. Channel age pattern Oj as generated by the block method.
the strategy used by the plant operator who tries to minimize
the perturbation resulting from refueling a channel. The channel age pattern Oj and block limits we selected are depicted in
Fig. 10.
Another instantaneous state of interest is the fresh core. This
state is characterized by a zero burnup distribution. Since we do
not simulate explicitly soluble poisons in moderator, the departure
from criticality ıkeff = keff − 1 indicates the poison requirements at
BOC and can be used to validate the criticality threshold k∞ (tS )
defined to correct the infinite lattice model in Section 2.1.1. The
instantaneous bundle and channel power peaks indicate the additional flattening needed in the center of the core, which is achieved
in practice by substituting fresh fuel bundles by bundles filled with
depleted uranium. The fresh core is also independent of ns and
R (ns ).
4. Advanced fuel cycles selection
Once the cell and the reactivity devices supercell calculations
have been performed with DRAGON for the fuels that respect the
conditions given in Eq. (6), the 3 core states described in Section 3
(optimal equilibrium, refueled core and fresh core) are simulated
with DONJON. Using the preliminary selection process presented
in Section 2.1.1, we have identified 200 thorium-based fuels mixed
with various driver fuels made of LEU (eU ≤ 5 wt.%) and DUPIC in
different homogeneous and heterogeneous configurations including the NU, TU and TD fuels presented in Table 2. Since for some
fuels different axial refueling strategies are acceptable, we also
considered two refueling options, namely: ns = 4 and ns = 8. The
change in ns affects the axial flux and power shapes, as well as
the core refueling rate. The ns = 2 option has also been studied
in details (Morreale et al., 2012), but strongly affects the reactivity devices efficiency and thus defeats the purpose of trying to
identify fuel cycles that could be exploited with minimal modifications to the existing CANDU reactors. Therefore, we have submitted
400 different cycles to the simulation process described in Section
3.
In this section, we discuss how the final cycles selection is performed using criteria relative to the finite core behavior for the 3
simulated states. Then, detailed analysis of the time-average equilibrium is presented and compared with the instantaneous states
that are also used to validate the modeling techniques presented
before.
4.1. Selection criteria
The global quality of advanced fuel cycles is judged in terms of
its ability to avoid core damages and to ensure cycles exploitability
at all time. A final selection is also performed to narrow the number
of eligible advanced cycles for reactivity devices optimization.
Only advanced fuel cycles satisfying the following condition (see
Eq. (27)) were selected:
max
max
(εaxial , Pjk , Pj
e
max
max
, B ) = E(εaxial ) + P(Pjk , Pj
e
) + B( B ) ≥ 1.
(34)
This is possible only if the channel and bundle power peaks are
lower than the pre-imposed limits and the core average exit burnup
e
B is at least as high as the reference. An accurate axial convergence parameter εaxial ≤ 5 ×10⁻³ , which results in E ≥ −4 according
to Eq. (28), must also be achieved because the term related to burnup (see Eq. (30)) could possibly compensate for the E penalty.
The safety criteria must also be respected for the 2 instantaneous
states. The bundle and channel power peaks are generally higher for
instantaneous states than for time-average model. The limits for the
= 935 kW
former are then taken as the explicit licensing limits: Plim
jk
and Plim
= 7300 kW increased by 10%. This accounts for the fact that
j
the channel age pattern selected for refueling does not minimize
power peaks. As a result, the instantaneous safety criteria are:
Pmax
≤ Plim
and Pmax
≤ Plim
jk
j
jk,fresh
j,fresh
(35)
Pmax
≤ 1.1 × Plim
and Pmax
≤ 1.1 × Plim
jk
j
jk,refueled
j,refueled
(36)
Finally, the refueling machines must be able to follow the refueling pace imposed by the refueling strategy R (ns ). Since this
capacity is related to the refueling frequency F, we impose a last
selection criterion:
F ≤ Fref ,
(37)
where Fref is the frequency of the NU cycle.
Out of the 400 cycles submitted to the simulation process,
198 are eliminated based on Eq. (34). Among those, 39 cycles did
not have at least one equilibrium state; 154 cycles are discarded
because the bundle and/or the channel power limits are exceeded;
and 5 cycles are eliminated because the B term is unable to compensate for the axial convergence penalty. Eq. (35) does not affect
the 202 remaining cycles, but Eq. (36) eliminates 99 cycles among
those. Finally, Eq. (37) discriminates 35 of the 103 remaining cycles.
Note that these 35 cycles use a ns = 4 axial refueling strategy, since
cycles using ns = 8 are less sensitives to Eq. (37), as will be explained
in Section 4.2.
Among the 68 cycles that met all the selection criteria, a few
were selected for reactivity devices optimization. Even if these 68
cycles equal or exceed the reference cycle performances, and that
it would be tempting to choose the ones with the higher fissile
E. St-Aubin, G. Marleau / Nuclear Engineering and Design 293 (2015) 371–384
Table 4
Time-average characteristics at the optimal equilibrium for NU, TU and TD cycles.
Cycles
NU
TU
TD
ns
εaxial
R2
R3
8
4.25E−5
0.938
0.875
4
2.93E−4
0.969
0.906
4
2.96E−4
0.906
0.875
max
Pjk
(kW)
838
818
845
Pj
(kW)
6685
6681
6690
B (GWd/The )
F (day−1 )
7.254
1.78
1
0.709
1
1
32.701
0.85
4.508
0.544
1.563
1.604
18.228
1.44
2.513
0.479
1.371
–
max
e
FIR
/NEE
/NUC
resources conversion, the economical maximization is not compatible with high conversion. To maximize the fissile inventory ratio
defined in Eq. (3), two competing processes must be taken into
account: the accumulation of the precursors (233 Th and 233 Pa for
233 U; 239 U and 239 Np for 239 Pu) up to their saturation concentrations, and the increasing 233 U (and 239 Pu) consumption by fission
due to the decreasing concentration of the initial fissile nucleus.
Thus, the optimal cycle time tC , from a fertile conversion point-ofview, lies between the plutonium peak (∼50 days, if present) and
the saturation time of the 233 Pa (∼200 days). However, this cycle
time can be widely exceeded for fuels with high fissile contents
e
(see Fig. 4), and even more if one maximizes B . Here, we concentrate our analyses only on the NU, TU and TD cycles presented in
Table 2, but the behavior of 4 other thorium-based cycles were also
analyzed in details in St-Aubin (2013). From now on, the NU fuel is
associated with the axial refueling strategy ns = 8, whereas the TU
and TD cycles use ns = 4.
4.2. Optimal equilibrium state
Table 4 presents the main time-average characteristics of our
NU, TU and TD fuel cycles. Good agreement is found between the
e
optimized core average exit burnup B and refueling frequency F
for the reference NU cycle and the values published in the literature (7.5 GWd/The and 2 channels per day respectively) (Rouben,
1984). The small differences observed are due to multiple factors, including the core modeling options and the radial refueling
strategy optimization. Globally, all the cycles have at least one timeaverage equilibrium state, since their axial convergence factors are
limit (E = 0). The core average exit burnup maxibelow the εmin
axial
mization impacts directly the time-average channel power peaks
max
e
Pj . Indeed, for a given time-average channel power limit, B is
lim
maximal for a flat channel power distribution (Pj = Pj ). This is
not achievable here since leakage effects cannot be compensated
by refueling (see Eq. (20)) because of the relatively low number of
burnup zones. The same phenomenon is observed for bundle power
peaks, except that non-linear refueling effects are also (directly)
involved. As a result, all the power peaks are very near the imposed
max
max
limits (Pjk ≥ 818 kW, Pj
≥ 6681 kW), but never exceed them
e
(P = 0). Thus, = B( B ) for all cases.
e
We also observe that higher B means lower F. Assuming that
the channel power distributions are the same for all cycles (Pj = Pj ),
e
e
then: ns F B = ns F B . For instance, the TU bundles stay approxe
imately twice as long in the core as the NU bundles, since B is
about 4 times greater but only half of the bundles are loaded at once.
e
Assuming that B is mainly governed by the fissile contents, this
also explains why the ns = 4 option is more sensitive to the criterion
of Eq. (37) for a given fuel composition. In general, we observe that
the cycles based on ns = 8 are more difficult to manage than those
381
with ns = 4 under the reference power limits, since the selection
criteria favor fuels with a high fissile contents.
It is also interesting to compare the core average exit burnup
e
B computed using the time-average model with the simplified
lattice exit burnup. For the NU cycle, the relative difference between
e
Pcell tC /mhe and B is −8.3%, whereas it is −4.7% and −3.3% for TU
e
and TD cycles, respectively. Pcell tC /mhe is lower than B because
e
the optimization procedure maximizes B . As a result, we conclude that the infinite lattice leakage correction ıkleaks is relatively
well-adapted for our cycles, but could be finely tuned a posteriori
using the full core results.
Table 4 also presents the fertile conversion metrics (see Eq. (3))
for all cycles. We observe that the FIR is higher for the NU reference
cycle than for our thorium-based cycles, since we decided to maxe
imize B . However, this does not mean that the generated 233 U
and 239 Pu nucleus are not used efficiently in TU and TD cycles. Normalizing the objective function with the fissile contents metrics
NEE and NUC, defined in Eqs. (1) and (2) respectively, leads to fissile
and 235 U nucleus utilization factors /NEE and /NUC indicating
how much energy can be extracted from initial fissile nucleus in
a particular cycle compared with the NU cycle. /NEE is significantly higher than 1 for both the TU and TD cycles, mainly because
of the in situ burning of 233 U. The /NEE result for the TU cycle is
also coherent with the /NUC value, however this metric does not
apply to the TD case (see Table 2).
As mentioned before, the external boundary and the 3-burnup
zone model restrict the time-average channel power flattening
achievable, which directly impacts the radial refueling strategy. As
a result, R3 ≤ R2 ≤ 1. Wight and Girouard (1978) results indicate
that if more burnup zones are defined, Rz for the intermediate zones become lower than for the zones closer to the radial
reflector. Chambon (2006) results show clearly that the 6700 kW
time-average channel power limit is very restrictive for a 3-burnup
zone model, but the exit burnup profile tends to the optimum computed by Wight and Girouard (1978) as the number of burnup zones
or the channel power limit is increased. Therefore, it would have
been advantageous to define a few more burnup zones, or a finer
mesh in the sub-domain Rz < 1 in the exploration phase of the
radial iteration presented in Section 3.2.3.
Fig. 11 illustrates the channel power distributions for both the
NU and TD cycles. Note that the TU channel power map is not
showed since it is almost identical to the NU map due to their similar radial refueling strategies. For the TD cycle, there is a strong
depression in the channel power for the central burnup zone, due
to the relatively large difference in the exit burnup between the
burnup zones 1 and 2. This depression is due to many factors
including the 4-bundle shift fueling strategy and the large differences between the number of channels Nj,z in a burnup zone. Since
the central burnup zone contains about 1/6 of the channels of the
peripheral zone, the latter has approximately 6 times the weight of
the former in the maximization procedure. This bias suppresses
the power flattening for the TD cycle, thus supporting an increase
in the number of burnup zones. Ideally, the number of channels
per burnup zone should be around 380/Nz with as little as possible spread around the average value. The depression in the flux
distribution will have large consequences on the control devices
reactivity worth for this cycle.
4.3. Instantaneous states
Table 5 presents departure from criticality ıkeff = keff − 1, bundle and channel power peaks for the NU, TU and TD cycles in fresh
and refueled cores. Fig. 12 illustrates both the fresh core and refueled core channel power distributions for NU and TD cycles. For
the fresh core, the power peaks are far below the limits for both
cycles and the power distributions are very similar, since they are
382
E. St-Aubin, G. Marleau / Nuclear Engineering and Design 293 (2015) 371–384
Fig. 11. Channel power distribution at the optimal equilibrium state for NU (left) and TD (right) cycles.
Fig. 12. Channel power distribution in the fresh (top) and refueled (bottom) cores for the NU (left) and TD (right) cycles.
Fig. 13. Axial power shape in central refueling zone for the equilibrium, fresh core and refueled core with NU (left) and TD (right) cycles.
E. St-Aubin, G. Marleau / Nuclear Engineering and Design 293 (2015) 371–384
Table 5
Main instantaneous characteristics of NU, TU and TD cycles for the fresh and refueled
core states.
State
Parameter
NU
TU
TD
Fresh core
ıkeff (pcm)
(kW)
Pmax
jk
(kW)
Pmax
j
6520
801
6987
21,161
807
7043
23,121
806
7027
Refueled core
ıkeff (pcm)
(kW)
Pmax
jk
(kW)
Pmax
j
39
913
7092
60
938
7355
71
993
7670
mainly governed by the core boundary and the reactivity devices.
As a result, no foreseeable additional depleted fuel load is needed to
flatten the fresh core power distribution. To confirm this assertion,
one would need to simulate explicitly the first channel refuelings
in order to determine if higher power peaks appear. On the other
hand, the moderator poisoning must be increased by a factor higher
NU (considering shielding effect) to ensure the criticalthan ıkeff /ıkeff
ity of the fresh core. Comparing the initial departure from criticality
ık∞ (0) = k∞ (0) − 1.05 obtained with the corrected infinite lattice
model in Fig. 4 to the ıkeff presented in Table 5 indicate that the
effective bulk poison needs are very well estimated using the simplified approach, since the relative error for boron concentration is
+6.0% for NU, +0.4% for TU and −0.5% for TD cycles. This confirms
that the corrections to the infinite lattice model are adequate.
For the refueled core, the channel age model works well since
all ıkeff are smalls. St-Aubin (2013) results indicate that passing
from ns = 8 to ns = 4 decreases ıkeff by a factor of 5–10 for a given
fuel. Assuming identical channel power maps, decreasing ns also
decreases ıBjk . This, in turn, has an impact on Eq. (32) and on the
refueled core burnup distribution. The departure from criticality
decreases accordingly.
Channel power distributions for the refueled core (see Fig. 12)
show some hot points that are directly due to the channel age pattern Oj that was not optimized to flatten the power maps. Even if the
distributions are almost identical for both cycles, the power peaks
are respectively 3.7% and 8.2% higher for TU and TD fuels than for the
NU cycle. The large difference in the number of channels per refueling block (6 in the corners compared with 36 in the center of the
core, see Fig. 10) induces an asymmetry between the top right and
the bottom left regions of the power maps that is more pronounced
for TD cycle than for NU cycle. This is because the algorithm assigning the channel refueling order passes to the next block when the
channel candidate actually corresponds to an empty site (A-1 for
example). This adequately spreads the block-averaged channel age
distribution around Aj = 12 but the outer blocks average age is
more susceptible to deviate from Aj which significantly impact
the power distribution symmetry. For instance, the average age
of the channels in the block A-E+12-17 is 0.442 while that of its
symmetrical counterpart (block S-W+6-11) is 0.513, leading to the
power asymmetry observable in Fig. 12. The impact is greater for
TD cycle since its initial equivalent enrichment is high and this
core uses a 4-bundle shift axial refueling strategy leading to having older fuel at core center (k =5, 8) than at channel front-ends
(k =1, 4). For TD cycle, one would have to refuel twice every channel using the same fueling pattern to obtain results equivalent to
those of the NU cycle. Overall, using a larger number of blocks having the same number of channels to refuel should allow to remove
these asymmetries while meeting the same power constraints for
all instantaneous states.
Fig. 13 depicts the axial power shapes 1k (see Eq. (17)) in the
central refueling zone of both the NU and TD cycles for the 3 simulated core states. For the fresh core, the curves are very similar since
the burnup and device distributions are identical for both cycles.
The only difference is that the NU curve is slightly more peaked at
383
the axial positions k =3, 10. This is mainly due to a decrease of both
the LZC and ADJ incremental cross sections for the TD fuel compared
with the reference (St-Aubin and Marleau, 2015). For the equilibrium state, the NU curve is maximal for k =6, 7 because the ns = 8
axial refueling strategy allows fresh fuel bundles to be placed in
the axial positions 5–8, contrarily to the TD case that uses ns = 4.
The depression of the axial power shape is the result of positioning
once burned fuel bundles at the center of the core. As expected,
both equilibrium curves are perfectly symmetrical with respect to
the axial middle plane, since the refueling zones group as many
channels fueled from both core ends (see Section 2.2).
For the NU case, the refueled core seems symmetrical and almost
identical to the equilibrium curve. This is not the case for the TD
fuel where the curve for the refueled core is tilted toward the channel front-end (k ≤ 6). There are 2 reasons to explain this behavior.
First, the TD cycle has a core average exit burnup ∼2.5 times higher
than the NU cycle (see Table 4), thus emphasizing the channel age
(or the refueling) effects for the TD cycle, as discussed in Section
3.2. Secondly, looking at the refueling pattern Oj (see Fig. 10) the
channels (L-12 and M-11) fueled from front to back (increasing k)
have an average channel age about 2 times lower than those (L-11
and M-12) loaded from back to front (decreasing k in Fig. 13). Thus,
the fuel is more reactive in the channel front half (k ≤ 6) than in the
back half (k ≥ 7), inducing an asymmetry in the 1k curves that is
more marked for the TD cycle (also true for the TU cycle). The axial
symmetry is respected if the averaging process is performed over
all the refueling zones since the average channel age is equal to 1/2
only over the whole core.
5. Conclusions and perspectives
Thorium fueled CANDU reactors are of interest because they
can eventually supply in fissile 233 U breeding 232 Th/233 U cycles.
Here, we mainly focus our discussion on designing an optimization algorithm that should facilitate the progressive setting up of
an industrial supply chain for natural thorium. Our fuel selection
procedure is based on safety, exploitability and economic criteria.
Infinite lattice and full core calculations are used to identify the
best fuel compositions from a large envelope of thorium/LEU or
thorium/DUPIC fuels. The coarse cell and supercell DRAGON models used for the selection process have been replaced by optimized
models allowing to generate reactor databases with fixed maximal
errors for minimal computing time.
We also present a novel physics-based methodology to optimize
CANDU fuel management at equilibrium using the time-average
approach. Our core model allows to define realistic radial refueling
strategies while increasing significantly the precision to computing
effort ratio compared to standard models that do not distinguish
burnup and refueling zones. Equilibrium is reached for a given
refueling strategy by following the axial flux shape convergence
and the guessed core average exit burnup during the initialization of the Brent’s method responsible of converging on criticality.
Then, the radial refueling strategy is optimized using a gradientlike method and an augmented objective function including penalty
terms. Instantaneous states have also been included in the selection process, using a channel age model and by simulating the fresh
core explicitly.
The simulation of 400 advanced fuel cycles allows to validate
the modeling and optimization approaches. Results presented in
this paper indicate that there are viables and exploitables thoriumbased fuels for CANDU reactors. Specifically, we showed that
natural uranium resources use can be improved (60% more energy
produced for the same initial mass of fissile isotope). The average exit burnup increases up to 32.7 GWd/The for a CANDU fueled
with low-enriched UO2 and 232 ThO2 (TU cycle). We have also
384
E. St-Aubin, G. Marleau / Nuclear Engineering and Design 293 (2015) 371–384
demonstrated that DUPIC fuels can be efficiently recycled in presence of 232 ThO2 while multiplying by a factor of 2.5 the energy
extracted from the fuel and improving by 37% the fissiles nucleus
efficiency when compared with the reference. However, a strong
flux depression in the center of the core is present for the TD cycle,
thus highlighting the need for a few more burnup zones in the core
model, but especially the needs for reactivity devices adjustment
for advanced fuel cycles.
Based on this study and previous works we will next attempt to
modify the adjuster rods and the liquid zone controllers in such a
way as to preserve their global reactivity and spatial power management efficiency for new fuels during normal and accidental
CANDU operation.
Acknowledgements
The authors wish to acknowledge financial support of the
Natural Sciences and Engineering Research Council of Canada,
Hydro-Québec and the Organization of CANDU Industries.
References
Alaoui, S., 1985. Étude du rechargement optimal d’un réacteur CANDU: développement du code OPTEX-2D (Ph.D. thesis). École Polytechnique de Montréal,
Montréal, Canada.
Beaudet, M., 1991. Application de la programmation non-linéaire aux calculs de
design et de gestion du combustible d’un réacteur CANDU (Ph.D. thesis). École
Polytechnique de Montréal, Montréal, Canada.
Bi, G., Liu, C., Si, S., 2012. PWR core design, neutronics evaluation and fuel cycle
analysis for thorium–uranium breeding cycle. In: PHYSOR2012, Knoxville TN,
USA.
Brent, R.P., 1973. Algorithms for Minimization without Derivatives. Automatic Computation. Prentice-Hall Inc., Englewood Cliffs, NJ.
Chambon, R., 2006. Optimisation de la gestion du combustible dans les réacteurs
CANDU refroidis à l’eau légère (Ph.D. thesis). École Polytechnique de Montréal,
Montréal, Canada.
Chambon, R., Varin, E., 2008. Fuel management in CANDU reactors using Tabu search.
In: PHYSOR2008, Interlaken, Switzerland.
Chambon, R., Varin, E., Rozon, D., 2007. CANDU fuel management optimization using
alternative gradient methods. Ann. Nuclear Energy 34, 1002–1013.
Choi, H., Ko, W., Yang, M., 2001a. Economic analysis on direct use of spent pressurized
water reactor fuel in CANDU reactors – I: DUPIC fuel fabrication cost. Nuclear
Technol. 134, 110–129.
Choi, H., Ko, W., Yang, M., Namgung, I., Na, B., 2001b. Economic analysis on direct
use of spent pressurized water reactor fuel in CANDU reactors – II: DUPIC fuelhandling cost. Nuclear Technol. 134, 130–148.
Choi, H., Rhee, B., Park, H., 1997. Physics study on direct use of spent pressurized
water reactor fuel in CANDU (DUPIC). Nuclear Sci. Eng. 126, 80–93.
Critoph, E., Banerjee, S., Barclay, F., Hamel, D., Milgram, M., Veeder, J., 1976. Prospects
for Self-sufficient Equilibrium Thorium Cycles in CANDU Reactors. Tech. Rep.
AECL-5501. Atomic Energy of Canada Limited.
Guillemin, P., 2009. Recherche de la haute conversion en cycle thorium dans les réacteurs CANDU et REP. Développement des méthodes de simulations associées et
étude de scénarios symbiotiques (Ph.D. thesis). Institut National Polytechnique
de Grenoble, Grenoble, France.
Hatcher, S., 1976. Thorium Cycle in Heavy Water Moderated Pressure Tube (CANDU)
Reactors. Tech. Rep. AECL-5398. Atomic Energy of Canada Limited.
IAEA, 2005. Thorium Fuel Cycle – Potential Benefits and Challenges. Tech. Rep. IAEATECDOC-1450. IAEA, Nuclear Fuel Cycle and Materials Section, Vienna, Austria.
IAEA, 2015, January. Power Reactor Information System. />Jeong, C., Park, C., Ko, W., 2008. Dynamic analysis of a thorium fuel cycle in CANDU
reactors. Ann. Nuclear Energy 35, 1842–1848.
Marleau, G., 2006. New Geometries Processing in DRAGON: The NXT: Module. Tech.
Rep. IGE-260 Rev. 1. Institut de Génie Nucléaire, École Polytechnique de Montréal, Montréal, Canada.
Marleau, G., Hébert, A., Roy, R., 2013. A User Guide for DRAGON Release 3.06L.
Tech. Rep. IGE-174 Rev. 12. Institut de Génie Nucléaire, École Polytechnique
de Montréal, Montréal, Canada.
Martinez Francès, N., Timm, W., Robbach, D., 2012. A high converter concept for
fuel management with blanket fuel assemblies in boiling water reactor. In:
PHYSOR2012, Knoxville TN, USA.
Morreale, A., Ball, M., Novog, D., Luxat, J., 2012. The behaviour of transuranic mixed
oxide fuel in CANDU-900 reactor. In: PHYSOR 2012, Knoxville TN, USA.
Nguyen, D., 1987. La modélisation et l’optimisation de l’équilibre du rechargement
à l’aide d’OPTEX (Master’s thesis). École Polytechnique de Montréal, Montréal,
Canada.
Nuttin, A., Guillemin, P., Bidaud, A., Capellan, N., Chambon, R., David, S., Méplan, O.,
Wilson, J., 2012. Comparative analysis of high conversion achievable in thoriumfueled slightly modified CANDU and PWR reactors. Ann. Nuclear Energy 40,
171–189.
Olson, G., McCardell, R., Illum, D., 2002. Fuel Summary Report: Shippingport Light
Water Breeder Reactor. Tech. Rep. INEEL/EXT-98-00799 Rev. 2. Idaho National
Engineering and Environmental Laboratory.
Ovanes, M., Chan, P., Mao, J., Alderson, N., Hopwood, J., 2012. Enhanced CANDU6:
reactor and fuel cycle options – natural uranium and beyond. In: PHYSOR 2012,
Knoxville TN, USA.
Petrovic, I., Benoist, P., 1996. BN theory: advances and new models for neutron
leakage calculation. Adv. Nucl. Sci. Technol. 24, 1–63.
Rouben, B., 1984. Le CANDU – Étude du coeur et gestion du combustible. Tech. Rep.
AECL-8333(F). Atomic Energy of Canada Limited, Mississauga, Canada.
Roy, R., Hébert, A., 2000. The GAN Generalized Driver. Tech. Rep. IGE-158. Institut
de Génie Nucléaire, École Polytechnique de Montréal, Montréal, Canada.
Rozon, D., Hébert, A., McNabb, D., 1981. The application of generalized perturbation
theory and mathematical programming to equilibrium refueling studies of a
CANDU reactor. Nuclear Sci. Eng. 78, 211–226.
Shen, W., Rozon, D., 1999. Effect of PWRA fuel management strategy on DUPIC fuel
cycle. In: CNS 1999 Annual Conference.
St-Aubin, E., 2013. Ajustement du rechargement et des mécanismes de réactivité des
réacteurs CANDU pour les cycles de combustible avancés (Ph.D. thesis). École
Polytechnique de Montréal, Montréal, Canada.
St-Aubin, E., Marleau, G., 2011. An optimization scheme for selecting alternative
fuels in CANDU-6 reactors. In: CNS 2011 Annual Conference, Niagara Falls,
Canada.
St-Aubin, E., Marleau, G., 2015. Optimized CANDU-6 cell and reactivity device supercell models for advanced fuels reactor database generation. Ann. Nuclear Energy
85, 331–336.
Tajmouati, J., 1993. Optimisation de la gestion du combustible enrichi d’un réacteur CANDU avec prise en compte des paramètres locaux (Ph.D. thesis). École
Polytechnique de Montréal, Montréal, Canada.
Varin, E., Hébert, A., Roy, R., Koclas, J., 2005. A User Guide for DONJON Version 3.01.
Tech. Rep. IGE-208 Rev. 4. Institut de Génie Nucléaire, École Polytechnique de
Montréal, Montréal, Canada.
Wight, A., Girouard, P., 1978. Optimum burnup distribution in a continously fuelled
reactor. Nuclear Sci. Eng. 68, 61–72.
WLUP, 2005. Final Stage of the WIMS-D Library Update Project. http://www-nds.
iaea.org/wimsd