Recombination pathways in a BeO yielding two main dosimetric TL peaks
Bạn đang xem bản rút gọn của tài liệu. Xem và tải ngay bản đầy đủ của tài liệu tại đây (2.5 MB, 7 trang )
Radiation Measurements 151 (2022) 106716
Contents lists available at ScienceDirect
Radiation Measurements
journal homepage: www.elsevier.com/locate/radmeas
Recombination pathways in a BeO yielding two main dosimetric TL peaks
P.G. Konstantinidis a, *, E. Tsoutsoumanos b, c, G.S. Polymeris b, G. Kitis a
a
Aristotle University of Thessaloniki, Physics Department, Nuclear Physics and Elementary Particles Physics Section, GR, 54124, Thessaloniki, Greece
Institute of Nanoscience and Nanotechnology, NCSR Demokritos, GR, 15310, Ag. Paraskevi, Athens, Greece
c
Condensed Matter Physics Laboratory, Physics Department, University of Thessaly, GR, 35100, Lamia, Greece
b
A R T I C L E I N F O
A B S T R A C T
Keywords:
BeOR
Activation energy
de-localized and localized pathways
Isothermal decay
Peak shape methods
Fractional glow technique
Apart from the commercially used Thermalox, BeOR is a new type of Beryllium Oxide fabricated by a different
company in Turkey. As it is shown by other groups, this dosimeter yields two overlapping main dosimetric TL
peaks in the temperature region of 100–300 ◦ C and one peak at 350 ◦ C. The aim of the present study is the
calculation of the activation energies of these two peaks with the use of specific protocols, including the Frac
tional Glow Technique (FGT), an Isothermal Decay signal (PID) and the Peak Shape Methods (PSM). Also, these
experimental procedures were conducted in two different readers, namely the Harshaw and the Risø reader, for
better repeatability and in order to minimize the error of the calculations. Moreover, another goal is to correlate
the activation energy values with the recombination pathways that are present in the BeOR and its corresponding
peaks. Specifically, both peaks have activation energies around 1–1.3 eV in most cases, although there are some
kinds of indications for a difference in the pathways, as the high-temperature region TL main peak seems to
follow the localized recombination via tunneling, in contrast with the low-temperature region TL main peak
which sticks to the delocalized model with the passing via the conduction band.
1. Introduction
Beryllium oxide (BeO) is a well-established dosimeter and is highly
used as medical, environmental, and personal dosimeter, due to its
unique characteristics (Nieto, 2016; Ogorodnikov et al., 2016; Tochilin
et al., 1969). First of all, the tissue equivalence (Zeff = 7.14, almost
identical to that of Zeff = 7.42 of the biological tissues) of BeO is
considered ideal for an excessive number of devices in a variety of
medical fields, which use radiation for diagnostics or therapy (Watanabe
et al., 2010). Even if it is described as an insulator, it possess a thermal
conductivity which even exceeds that of some metals. This fact ensures a
swift and unfluctuating transfer of heat throughout the stage of the
readout of the TL signal, and a TL sensitivity close to that of the
commonly used TLD-100 (Becker et al., 1970). Additionally, its
annealing is easier and simpler as it does not have peaks at the low
temperature region. This tough ceramic material is insoluble in water,
insensitive to most chemical agents, has a high resistance to the influ
ence of mechanical forces, and can be formed at high temperature en
vironments into rods or discs (Kiiko et al., 1999), having ready
availability and low cost. While being solid, free of dust, BeO is nearly
innocuous and the possible health risks accrued from it being machined,
squashed, or converted to its reactive dispersed form are minimal
(Stockinger, 1966).
For the thermoluminescence and dosimetry uses, the Ceramic BeO
(product name; Thermalox@ 995, fabricated by Brush Beryllium Co.) is
the most common of the alternative commercially used BeO Ceramics, as
it offers quality assurance, an almost stable response regarding the longterm uses and is mostly free of noise signals (Crase and Gammage,
1975). Gammage and Garrison (1974) pointed out Al2+ substitutional
for Be as the TL trapping entity in Thermalox@ 995, while its elemental
composition (ppm) as it is given by the manufacturing company is
mainly Si, Mg and Fe, with Ca, Al, Ti, and Cu at lower concentrations. Its
commercial name is Thermalox 995 BeO (BeOT), and yields one main
Thermoluminescence (TL) dosimetric peak at the dosimetric region
between the temperatures of 100–250 ◦ C as well as one peak at 350 ◦ C.
This type of BeO was investigated, for its OSL (Bulur and Goksu, 1998),
LM-OSL (Bulur and Yeltik, 2010) and TR-OSL (Bulur and Saraỗ, 2013;
Bulur, 2014) properties, as well as for the phototransfer and the prop
erties of the TL signals (Bulur, 2007). On the same note, Yukihara (2011,
2019a, 2019b) investigated the TR-OSL and TT-OSL signals of BeOT and
proposed a new protocol for the usage of BeO chips with the help of
automated OSL readers, such as Risø TL/OSL (Yukihara et al., 2016).
* Corresponding author.
E-mail address: (P.G. Konstantinidis).
/>Received 19 November 2021; Received in revised form 23 January 2022; Accepted 29 January 2022
Available online 1 February 2022
1350-4487/© 2022 Elsevier Ltd. All rights reserved.
P.G. Konstantinidis et al.
Radiation Measurements 151 (2022) 106716
private company (Radkor), with laboratory code name BeOR yields two
separate TL peaks at the dosimetric temperature region of 100–300 ◦ C
and one peak at 350 ◦ C (Fig. 1a). BeOR was studied extensively by As¸lar
et al. (2021) with a plethora of techniques, which besides TL and opti
cally stimulated luminescence (OSL) include electron spin resonance
(ESR), scanning electron microscopy (SEM) coupled with energy
dispersive x-ray spectroscopy (EDX) and x-ray diffraction analysis
(XRD). Moreover, the same team conducted some experiments on a
variety of the luminescence dosimetric properties of BeOR, such as
dose-response, minimum detectable dose threshold, thermal stability
and quenching, reproducibility, and bleaching. These authors concluded
that the difference in the TL glow curve between the two types of do
simeters could arise from different sintering and/or calcination appli
cations during the manufacturing process or from the increased content
of Cr, Mg and Sn.
On the other hand, Polymeris et al. (2020) concentrated on the
recombination pathways during the readout stage regarding four
different known dosimeters, including BeOT. It is known that these
pathways can be either delocalized, via the conduction band, or local
ized, involving tunneling through an excited state of the trapped elec
trons. These authors have proposed a series of experiments in order to
compare the value of the activation energy of each peak and to distin
guish its recombination pathway, by including the fractional glow
technique (FGT), an isothermal decay signal (PID) and the peak shape
methods (PSM).
The main aim of the present study is to use the methodology that is
proposed by Polymeris et al. (2020) in order to generate experimental
data for the case of both main dosimetric peaks of BeOR. Specifically, it
would be beneficial to exploit this methodology to the case of one single
material that yields two different and overlapping TL glow peaks with
different recombination pathways. By conducting the three series of
experiments, it is possible to calculate the activation energy of both
main dosimetric peaks at different scenarios and thus being able to
compare them. The second aim of this study, as the protocol suggests, is
to distinguish the recombination pathways that are available in the
BeOR dosimeter, after discriminating them.
2. Apparatus and experimental procedure
The inorganic compounds of BeOR are colorless under normal con
ditions and are created to have dimensions of 4 × 4 × 1mm. The do
simeters that are used in the experiments are either un-preheated or
preheated at 160 ◦ C.
All of the experiments were conducted in two different readers,
namely a Harshaw-3500 and a Risø TLD-reader. The Harshaw-3500
TLD-reader includes only neutral density filters, taking advantage of a
nitrogen atmosphere and a low constant heating rate of 2 ◦ C/s in order
to minimize the thermal lag that may occur. On the other hand, the Risø
TLD-reader (Model DA-20) is equipped with an EMI 9235QB PM Tube,
and the filter used in front of the PMT is a 7.5 mm Hoya U-340 filter
(270–380 nm, FHWM 80 nm). The irradiations were accomplished via
a90Sr/90Y beta source with a dose rate of 0.53 Gy/min. One of the dif
ferences of the two readers lies in the thermal contact, of which the
Harshaw reader is superior. This may lead to a temperature lag in the
case of the Risø measurements resulting in a shift of the TL glow curves.
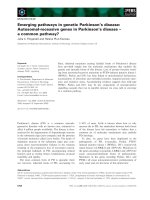
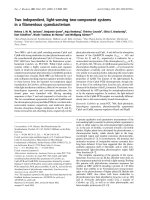
Fig. 1a shows that the BeO fabricated by Radkor indeed has a double
TL main dosimetric peak. The activation energies of each one between
these two overlapping TL traps were calculated using Fractional Glow
and Initial Rise Techniques, Peak Shape Methods, and analysis of
Isothermal TL.
The prompt isothermal decay (PID) experiments were conducted in
both a Harshaw-3500 (Tmax = 400 ◦ C) and a Risø (Tmax = 500 ◦ C) TLDReader, according to the following protocol:
Fig. 1. a) TL signals of BeOR measured using the (1) Risø-reader and (2)
Harshaw-Reader. BeOR has two different overlapping peaks at the main dosi
metric region. At the same figure, glow curve (3) represents BeO Thermalox. (b)
Examples of Isothermal and Residual TL signals of BeOR according to steps 3
and 4 of the corresponding protocol. In all curves, the arithmetic corresponds to
the temperature at which Isothermal TL was measured, while the index rep
resents the corresponding step of the protocol. For the case of the Isothermal
signals the x axis corresponds to the temperature up to the maximum intensity
(170 ◦ C and 215 ◦ C), while the decaying part is plotted versus the stimulation
time. As for the Residual TL curves, the x axis corresponds only to the
temperature.
Recently, Altunal et al. (2018), synthesized four different
nano-powders of BeO with the help of the sol-gel method and studied
their OSL properties, including the thermal stability, the minimum dose
that can be detected and the fading of the signals. The same team found
out that the BeO pellet sintered at 1100 ◦ C has a TL peak around 200 ◦ C.
In another study of Altunal et al. (2019), some BeO pellets were syn
thesized using the precipitation method at three different sintering
temperatures. It was found out that the higher the sintering temperature,
the higher the OSL signal was. Finally, Altunal et al. (2020), who
investigated the effects of the different impurities in Beryllium oxide
ceramics, found that a BeO dosimeter with Dysprosium or Erbium im
purities in its Bravais lattice form, yields a double peak at the dosimetric
region.
However, a new type of BeO ceramic, originating from a Turkish
1. Test dose and TL up to Tmax.
2
P.G. Konstantinidis et al.
Radiation Measurements 151 (2022) 106716
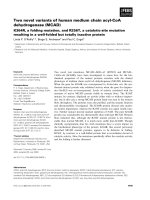
Fig. 2. Residual TL glow curves according to step 4 corresponding to (a) Risø equipment for un preheated sample, (b) Risø equipment for preheated sample, (c)
Harshaw reader for un preheated sample, (d) Harshaw reader for preheated sample. In all cases the residual curves show a slight shift towards higher temperatures
with increasing stimulation temperature (illustrated as arrows).
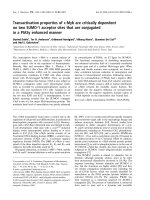
Fig. 3. Normalized Isothermal decay signals for the
case of (a) Harshaw reader for un preheated sample,
(b) Harshaw reader for preheated sample, (c) Risø
equipment for un preheated sample, (d) Risø equip
ment for preheated sample. Isothermal decay curves
fall clearly within two distinguished groups. The first
one includes curves with different shape according to
the Isothermal temperature (illustrated as arrows);
this group is prominent in figures a (where the cor
responding decay curves are highlighted within
ellipsoidal for temperature region 110–165 ◦ C) and c.
The second group consists of decay curves that,
despite their different stimulation temperature, indi
cate shape that coincides. This phenomenon is
prominent in all four plots and specifically in plot a is
highlighted as a rectangle within the temperature
region of 165–220 ◦ C.
2. Dose of 0.275 Gy for Harhsaw and 0.5 Gy for Risø. The experiment
was performed two times in different chips, namely with and without
a preheat with a constant heating rate up to 160 ◦ C in order to
remove the unstable low temperature TL peaks and to ensure that the
only remaining peak from the two overlapping ones in the dosimetric
region will be the higher temperature one.
3
P.G. Konstantinidis et al.
Radiation Measurements 151 (2022) 106716
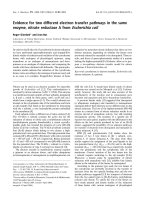
Fig. 4. Example of deconvolution of an Isothermal decay at 150◦ C for the
Harshaw un preheated case. Two components are used for a better fit.
3. Temperature increase up to Ti with a constant heating rate, in which
the isothermal decay will take place for 110 s, in order to record the
PID signal.
4. TL readout up to Tmax (400 ◦ C or 500 ◦ C, depending on the reader) to
require the remnant Residual TL signal (RTL) from step 3.
5. Repeat steps 2–4 for Ti: 110–240 ◦ C with a step of 5 ◦ C for the
Harshaw reader and 10 ◦ C for the Risø one.
One example of the measurement sequence of the aforementioned
protocol is Fig. 1b, in which the first part of the signal, up to the
maximum intensity, is used for the Initial Rise method, while the second
decaying part can be used for the Isothermal Decay Method. Step 4 is
very important, as the Residual Curves can be used for the Initial Rise
method as well as for the Peak Shape Methods (PSM) for the preheated
versions.
The Fractional Glow Technique (FGT) protocol is conducted in Risø
equipment according to the following:
Fig. 5. lnτ for the dominant component of the Isothermal Decay signal for a)
the entire temperature region, in which the activation energies are calculated
with the help of the corresponding slopes and b) a close up at higher
temperatures.
1. Test Dose (TD) of 0.38 Gy and record TL glow curve up to Ti = 40 C
2. Record TL glow curve up to Ti oC, varying from 50 ◦ C to 500 ◦ C in
steps of 10 ◦ C.
)
(
3. Method of analysis
I(T)∝n0 se
As it was mentioned, the activation energies of the two TL glow peaks
of the main dosimetric region of BeOR are calculated with different
methods, which are proposed by Polymeris et al. (2020), in two different
readers in order to accumulate more data and thus better results.
− E/
kT
(1)
Where s(s− 1) is the frequency factor, E(eV) is the activation energy and T
(K) is the temperature. According to equation (1), the plot of ln(T)
versus 1/kT represents a straight line, the slope of which is the activation
energy -E. In the present study the Initial rise method was applied to the
first region of Fig. 1b up to the maximum intensity and to the RTL data of
Fig. 2.
3.1. Initial Rise method (IR)
The Initial Rise method (IR) was firstly given by Garlick and Gibson
(1948), simulated by Kitis et al. (2017) and is the one of the most
important techniques for the calculation of the activation energy of a
trap. It was generalized, by recording the luminescence during both the
heating and cooling stages, and accepted as the Fractional Glow tech
nique (FGT) by Gobrecht and Hofmann (1966) and Tale (1981). In the
present study, a consecutive Initial Rise method in order to increase the
temperature step wise (or the heating stage of the FGT) is applied, ac
cording to which the TL intensity in the region of negligible disturbance
of trap population is given by the following equation:
3.2. Isothermal decay method (PID)
The isothermal decay method can be described by three identical
models as (1) delocalized recombination model (Kitis and Vlachos,
2013), (2) localized recombination model (Kitis and Pagonis, 2018) and
(3) localized tunneling recombination model (Kitis and Pagonis, 2013).
In all aforementioned models the decay constant λ can be given by the
following equation (Chithambo and Niyonzima, 2014):
λ = se
4
−
E
kTi
(2)
P.G. Konstantinidis et al.
Radiation Measurements 151 (2022) 106716
Table 1
Activation energies of the two main dosimetric traps, resulting from four
different analyses for both readers. N corresponds to the total number of the
curves that were used in the whole analysis. For each equipment the first
arithmetic indicates the total number of un preheated curves, while the second
the total number of preheated curves.
Activation
Energy (eV)
Risø (N ¼ 22, 20)
Harshaw (N ¼ 23, 10)
IR
un preheated
RTL
1.26 ±
0.02
IR
1.02 ±
0.04
RTL
1.27 ±
0.03
preaheated
1.27 ±
0.01
1.07 ±
0.01
1.26 ±
0.03
PSM
Chen
Еω
1.00 ±
0.19
Eδ
1.19 ±
0.19
Eτ
1.06 ±
0.20
Еω
1.05 ±
0.12
Kitis
1.03 ±
0.2
1.03 ±
0.3
1.03 ±
0.4
1.18 ±
0.08
PID
C1 140165
C1 165215
un preheated
preheated
0.96
0.96
0.05
0.14
C2
140210
0.56
0.59
C1
140165
0.96
–
FGT (N ¼ 43)
T
Energy
(eV)
1.25 ±
0.04
1.36 ±
0.04
1.90 ±
0.09
130–280
320–390
440–490
IR
1.08
±
0.01
1.12
±
0.03
Eδ
1.14
±
0.15
1.18
±
0.09
Eτ
1.11 ±
0.12
C1
165215
0.06
0.1
C2
140210
0.68
0.44
1.18 ±
0.10
parameters. Nevertheless, the FOM value is given by the following
equation:
⃒
⃒
∑[⃒Yexp − Yfit ⃒]
(4)
FOM(100%) = 100 ×
A
i
In this case Yexp regards the experimental data, Yfit is the theoretical
data resulting from the whole procedure and A is the area of the fitted
curve of the signal that is analyzed.
Fig. 6. a) Results of the Fractional glow technique; three different plateaus
become prominent for the entire glow curve. b) Activation energies calculated
via all different experiments of Initial Rise for all samples, based on the first half
of the PID signal (IR) and the Residual TL curves (RTL).
3.3. Peak shape methods (PSM)
Once again the s(s− 1) is the frequency factor, E(eV) is the activation
energy, and the Ti is the temperature that is used in the step 3 of the
aforementioned PID protocol. The deconvolution of the PID signals can
be accomplished with the general order formula, introduced by Kirsh
and Chen (1991):
− b
[
t ]b− 1
I(t) = I0 1 + (b − 1)
τ
The peak shape methods are used in order to calculate the activation
energy of a TL peak with the condition of it being isolated. Thus, these
methods will be applied only in the cases of the preheated samples, in
order to analyze one TL glow peak at a time. The peak shape methods
take advantage of the geometrical characteristics of the TL glow curve,
mainly the maximum peak temperature Tm and the high and low tem
peratures (T1 and T2 accordingly) sides of the glow curve in the half
maximum intensity. Chen (1969) and Kitis and Pagonis (2007) have
independently created peak shaped equations that give similar but no
identical values for the activation energies based on the general order
kinetics model. Thus, the presenting calculations in this work are based
on both groups of PSM.
(3)
In this equation b∕
=1 is the kinetic order, I(t) is the luminescence
intensity and τ = 1/λ is the mean lifetime. Thus, the decay constant λ can
be calculated by the fitting of Fig. 4, with the help of the spreadsheets of
Afouxenidis et al. (2011). By replacing λ with τ in equation (2) and with
the use of the natural algorithm, the plot of ln(τ) versus 1/kT is a straight
line with a slope that represents the activation energy E of the trap.
However, in order to ensure a good fit for the signals, it is essential that
the Figure Of Merit (FOM %) -introduced by Balian and Eddy (1977)should be as low as possible. These authors concluded that a FOM of 3%
or lower is highly desirable, while a FOM of 10% and above is highly
unrecommended as an acceptable value. For values between 3% and
10% the whole fit should be revised with some alterations in the initial
4. Results and discussion
Fig. 2 shows all the residuals according to the Isothermal decay
protocol and can be used for two experimental analyses. All of the peaks
in the case of Risø have a higher Tm temperature (a deviation of
40–50 ◦ C) and are clearly wider than those of the Harshaw cases, even
though the experiments were conducted in both readers with a heating
5
P.G. Konstantinidis et al.
Radiation Measurements 151 (2022) 106716
rate of 2 ◦ C/s. The aforementioned phenomenon can be ascribed to the
thermal gradient between the sample and the heater plates (Kon
stantinidis et al., 2020; Bilski et al., 2014). When a Harshaw reader is
being used, there is a direct heating of the sample, as it is placed on the
corresponding planchette (Bilski et al., 2014). On the other hand, in the
case of a Risø reader, the sample is firstly placed inside the stainless-steel
cup, which is then placed on the heating planchette of the Risø reader.
This geometry leads to an indirect heating of the used dosimeter or
sample. Having in mind the previous analysis, it can be assumed that
there is smaller thermal gradient in the Harshaw readers and thus, the
values of Tm and FWHM acquired by this reader are closer to the actual
form of the TL glow curve/peaks. As for the comparison of the signals
between the two readers, it is worth mentioning that the TL curves of the
experiments of the Risø system are more intense than those of the
Harshaw 3500 reader, despite the fact that the Risø system has a Hoya
U-340 filter and the Harshaw has none, as there is a difference within the
same applied dose. For the Initial Rise method all four figures can be
utilized, while only the preheated versions are used in order to acquire
the necessary data for the Peak Shape Methods. Also, the clearly visible
temperature shift of the second glow peak can be a first indicator of a
possible localized recombination pathway without the passing via the
conduction band.
Fig. 3 shows the four different versions of the isothermal decay sig
nals, which follow the same trend. The difference in the starting tem
perature between the two readers (10–20 ◦ C) is due to the thermal lag, as
mentioned and discussed before. Also, the preheated samples are used
mainly for the analysis of the second peak of the main dosimetric region.
Moreover, these figures are the second indicator of the different path
ways that are used in the two overlapping peaks of the BeOR dosimeters.
Specifically, the de-localized model pathway can be found up to 165 ◦ C,
while the localized one is at temperatures higher than 165 ◦ C, as can be
seen from the example of Fig. 3a. Fig. 4 presents an example of the
deconvolution analysis of these PID signals, with the use of the
spreadsheets of Afouxenidis et al. (2011) and equations (2) and (3). As
BeOR exhibits two overlapping peaks, the use of two different compo
nents, namely C1 and C2, is essential for the experimental and the
theoretical signals to be in agreement with a FOM value lower than 3%.
It must be noted that the study focuses on the dominant C1, as C2 rep
resents a slower component to the deconvolution process.
From the Isothermal Decay signal (PID) study, the activation en
ergies of the first component in Fig. 5a in the region of 130–165 ◦ C seems
to be near 0.96 eV, regarding the first peak of the BeOR in the dosimetric
region. From the data of Fig. 5b, it is concluded that at temperatures
beyond 165 ◦ C the analysis does not give a satisfactory result, indicating
once again the localized pathway of the second peak. Moreover, Fig. 6a
shows the results of the Fractional Glow Technique through the tem
perature range of 50–500 ◦ C. There are 3 different plateaus, namely at
130–280 ◦ C, 320–390 ◦ C and 440–490 ◦ C. The main dosimetric peaks
are located within the first plateau, both having activation energies of
1.25 eV. From Fig. 6b one can see the activation energies that accrues
from all the experimental procedures of the Initial Rise that were con
ducted in the present study, for the un preheated and the preheated
samples. The same results can be viewed in Table 1 and are in agreement
with the findings of As¸lar et al. (2021). From the Initial Rise method of
the residuals both versions seem to have an activation energy of 1.26eV,
while the IR method from the isothermal signals are set to be at 1.08eV.
Lastly, the peak shape methods of the residuals of the preheated samples
have visible differences between the two readers. For the case of Risø,
the activation energy is at 1.03eV while for the Harshaw it is at 1.18eV.
each one between these two peaks was calculated using Isothermal
Decay, Fractional Glow Technique (or Initial Rise) and Peak Shape
Methods. According to the analysis of the present study, BeOR yields two
main dosimetric peaks with two different recombination pathways. For
the case of the main TL trap corresponding to the low-temperature re
gion, all techniques yield similar values of activation energy, namely
around 1–1.30 eV, providing strong experimental indications towards a
recombination pathway via the conduction band. On the contrary,
regarding the main TL trap corresponding to the high-temperature re
gion, Isothermal TL provides values of activation energies below 0.2 eV,
while the other two techniques around 1.10–1.30 eV. In a nutshell, the
effective use of the aforementioned methodology was successfully
exploited even for the case of one single material that yields two
different and overlapping TL glow peaks with different recombination
pathways. Discrimination could be achieved using solely the Isothermal
TL and neither Initial Rise technique nor the Peak Shape Methods could
identify localized recombination pathways.
Declaration of competing interest
The authors declare that they have no known competing financial
interests or personal relationships that could have appeared to influence
the work reported in this paper.
References
Afouxenidis, D., Polymeris, G.S., Tsirliganis, N.C., Kitis, G., 2011. Computerized curve
deconvolution of TL/OSL curves using a popular spreadsheet program. Radiat.
Protect. Dosim. 149, 363–370.
Altunal, V., Yegingil, Z., Tuken, T., Depci, T., Ozdemir, A., Guckan, V., Nur, N., Kurt, K.,
Bulur, E., 2018. Optically stimulated luminescence characteristics of BeO
nanoparticles synthesized by sol-gel method. Radiat. Meas. 118, 54–66.
Altunal, V., Guckan, V., Ozdemir, A., Sotelo, A., Yegingil, Z., 2019. Effect of sintering
temperature on dosimetric properties of BeO ceramic pellets synthesized using
precipitation method. Nucl. Instrum. Methods Phys. Res. Sect. B Beam Interact.
Mater. Atoms 441, 46–55.
Altunal, V., Guckan, V., Yu, Y., Dicker, A., Yegingil, Z., 2020. A newly developed OSL
dosimeter based on beryllium oxide: BeO:Na,Dy,Er. J. Lumin. 222, 117140.
Asálar, E., Sáahiner, E., Polymeris, G.S., Meriỗ, N., 2021. Thermally and optically
stimulated luminescence properties of BeO dosimeter with double TL peak in the
main dosimetric region. Appl. Radiat. Isot. 170, 109635.
Balian, H.G., Eddy, N.W., 1977. Figure-of-merit (FOM), an improved criterion over the
normalized chi-squared test for assessing goodness-of-fit of gamma-ray spectral
peaks. Nucl. Instrum. Methods 145 (2), 389–395.
Becker, K., Cheka, J.S., Oberhofer, M., 1970. Thermally stimulated exoelectron emission,
TL and impurities in LiF and BeO. Health Phys. 19, 391–403.
Bilski, P., Gieszczyk, W., Obryk, B., Hodyr, K., 2014. Comparison of commercial
thermoluminescent readers regarding high-dose high-temperature measurements.
Radiat. Meas. 65, 8–13.
Bulur, E., 2007. Photo-transferred luminescence from BeO ceramics. Radiat. Meas. 42,
334–340.
Bulur, E., 2014. More on the TR-OSL signal from BeO ceramics. Radiat. Meas. 66, 12–20.
Bulur, E., Goksu, H.Y., 1998. OSL from BeO ceramics: new observations from an old
material. Radiat. Meas. 29, 639650.
Bulur, E., Saraỗ, B.E., 2013. Time-resolved OSL studies on BeO ceramics. Radiat. Meas.
59.
Bulur, E., Yeltik, A., 2010. Optically stimulated luminescence from BeO ceramics: an LMOSL study. Radiat. Meas. 45, 29–34.
Chen, R., 1969. On the calculation of activation energies and frequency factors from
glow curves. J. Appl. Phys. 40, 570–585.
Chithambo, M.L., Niyonzima, P., 2014. On isothermal heating as a method of separating
closely collocated thermoluminescence peaks for kinetic analysis. J. Lumin. 155,
70–78.
Crase, K.W., Gammage, R.B., 1975. Improvements in the use of ceramic BeO for TLD.
Health Phys. 29, 739–746.
Gammage, R.B., Garrison, n A.K., 1974. Investigation of EPR, TLD and TSEE of BeO
ceramic. In: Proc. 4th Int. Conf. Luminescence Dosimetry. Institute of Nuclear
Physics, Krakow, p. 263.
Garlick, G.F.J., Gibson, A.F., 1948. The electron trap mechanism of luminescence in
sulfide and silicate phosphors. Proc. Phys. Soc. Lond. 60, 574–590.
Gobrecht, H., Hofmann, D., 1966. Spectroscopy of traps by fractional glow technique.
J. Phys. Chem. Solid. 27, 509–522.
Kiiko, V.S., Zolotukhina, L.V., Zabolotskaya, E.V., Dmitriev, I.A., Makurin, Yu N., 1999.
Defects in beryllium ceramics. Glass Ceram. 56 (11), 346–349.
Kirsh, Y., Chen, R., 1991. Analysis of the blue phosphorescence of X-irradiated albite
using a TL-like presentation. Nucl. Tracks Radiat. Meas. 18, 37–40.
Kitis, G., Pagonis, V., 2007. Peak shape methods for general order thermoluminescence
glow-peaks: a reappraisal. Nucl. Instrum. Methods Phys. Res. B 262, 313–323.
5. Conclusions
In the present study, the methodology proposed by Polymeris et al.
(2020) was used in order to generate specific experimental data for the
case of a newly developed BeO dosimeter with two main dosimetric TL
peaks. In the framework of this methodology, the activation energy of
6
P.G. Konstantinidis et al.
Radiation Measurements 151 (2022) 106716
Polymeris, G.S., Pagonis, V., Kitis, G., 2020. Investigation of thermoluminescence
processes during linear and isothermal heating of dosimetric materials. J. Lumin.
222, 117142.
Stockinger, H.E. (Ed.), 1966. Beryllium: its Industrial Hygiene Aspects. Academic Press,
New York.
Tale, I.A., 1981. Trap spectroscopy by the fractional glow technique. Phys. Stat. sol. 66,
65–75.
Tochilin, E., Goldstein, N., Miller, W.G., 1969. BeO as a thermoluminescent dosimeter.
Health Phys. 16 (issue 1), 1–7.
Watanabe, S., Gundu Rao, T.K., Page, P.S., Bhatt, B.C., 2010. TL, OSL and ESR studies on
beryllium oxide. J. Lumin. 130, 2146–2152.
Yukihara, E.G., 2011. Luminescence properties of BeO optically stimulated luminescence
(OSL) detectors. Radiat. Meas. 46, 580–587.
Yukihara, E.G., 2019a. Characterization of the thermally transferred optically stimulated
luminescence (TT-OSL) of BeO. Radiat. Meas. 126, 106132.
Yukihara, E.G., 2019b. Observation of strong thermally transferred optically stimulated
luminescence (TT-OSL) in BeO. Radiat. Meas. 121, 103–108.
Yukihara, E.G., Andrade, A.B., Eller, S., 2016. BeO optically stimulated luminescence
dosimetry using automated research readers. Radiat. Meas. 94, 27–34.
Kitis, G., Pagonis, V., 2013. Analytical solution for stimulated luminescence emission
from tunneling recombination in randomly distributions of defects. J. Lumin. 137,
109–115.
Kitis, G., Pagonis, V., 2018. Localized transition models: a reappraisal. Nucl. Instrum.
Methods Phys. Res. B 432, 13–19.
Kitis, G., Vlachos, N., 2013. General semi-analytical expressions for TL, OSL and other
luminescence stimulation modes derived from OTOR model using the Lambert W
function. Radiat. Meas. 48, 47–54.
Kitis, G., Pagonis, V., Tzamarias, E.E., 2017. The influence of competition effects on the
initial rise method during thermal stimulation of luminescence: a simulation study.
Radiat. Meas. 100, 27–36.
Konstantinidis, P., Tsoutsoumanos, E., Polymeris, G.S., Kitis, G., 2020.
Thermoluminescence response of various dosimeters as a function of irradiation
temperature. Radiat. Phys. Chem. 177, 109156.
Nieto, Azorin J., 2016. Present status and future trends in the development of
thermoluminescent materials. Appl. Radiat. Isot. 117, 135–142.
Ogorodnikov, I.N., Petrenko, M.D., Ivanov, V. Yu, 2016. Low-temperature luminescence
and thermoluminescence from BeO: Zn single crystals. Opt. Mater. 62, 219–226.
7