Báo cáo khoa học: Role of conformational flexibility for enzymatic activity in NADH oxidase from Thermus thermophilus pptx
Bạn đang xem bản rút gọn của tài liệu. Xem và tải ngay bản đầy đủ của tài liệu tại đây (375.48 KB, 11 trang )
Role of conformational flexibility for enzymatic activity in NADH
oxidase from
Thermus thermophilus
Gabriel Z
ˇ
olda
´
k
1
,Ro
´
bert S
ˇ
ut’a
´
k
1,2
, Maria
´
n Antalı
´
k
1,3
, Mathias Sprinzl
4
and Erik Sedla
´
k
1
1
Department of Biochemistry, Faculty of Sciences P. J. S
ˇ
afa
´
rik University, Kos
ˇ
ice, Slovakia;
2
Department of Parasitology,
Charles University, Prague, Czech Republic;
3
Department of Biophysics, Institute of Experimental Physics, Slovak Academy of
Sciences, Kos
ˇ
ice, Slovakia;
4
Laboratorium fu
¨
r Biochemie, Universita
¨
t Bayreuth, Germany
NADH oxidase from Thermus thermophilus is a homodimer
with an unknown physiological function. As is typical for an
enzyme isolated from a thermophile, the catalytic rate, k
cat
, is
low at low temperatures and increases with temperature,
achieving an optimum at the physiological temperature of
the organism, i.e. at % 70 °CforT. thermophilus.Atlow
temperatures, the k
cat
of several enzymes from thermophilic
and mesophilic organisms can be increased by chaotropic
agents. The catalytic rate of NADH oxidase increases in the
presence of urea. At concentrations of 1.0–1.3
M
urea it
reaches 250% of the activity in the absence of urea, at 20 °C.
At higher urea concentrations the enzyme activity is inhi-
bited. The urea-dependent activity changes correlate with
changes in the fluorescence intensity of Trp47, which is
located in the active site of the enzyme. Both fluorescence
and circular dichroism measurements indicate that the acti-
vation by chaotropic agents involves local environmental
changes accompanied by increased dynamics in the active
site of the enzyme. This is not related to the global structure
of NADH oxidase. The presence of an aromatic amino acid
interacting with the flavin cofactor is common to numerous
flavin-dependent oxidases. A comparison of the crystal
structure with the activation thermodynamic parameters,
DH*andTDS*, obtained from the temperature dependence
of k
cat,
suggests that Trp47 interacts with a water molecule
and the isoalloxazine flavin ring. The present investigation
suggests a model that explains the role of the homodimeric
structure of NADH oxidase.
Keywords: NADH oxidase; conformational dynamics; flavo-
proteins; fluorescence quenching; Thermus thermophilus.
The activity and stability of an enzyme is a compromise
between two opposing forces in the dynamics of the
polypeptide chain. While the active site of an enzyme has
to have a certain flexibility to fit the incoming substrate, the
stability is related to the rigidity of the polypeptide chain
[1–3]. The balance between the stability/rigidity and the
flexibility of the protein structure is achieved in the native
structure at physiological temperatures [4,5]. It was
suggested nearly 50-years ago [6,7] that conformational
flexibility in the active site is important for substrate
binding, and for enzyme catalysis. The highly dynamic
active site is more highly sensitive to perturbations of the
environment than the rest of the polypeptide structure,
which agrees with the observation that enzyme inactivation
precedes global unfolding of the enzyme structure [8]. The
extreme stability of enzymes from thermophilic organisms
is an attractive feature for biotechnological applications [9].
On the other hand, these enzymes have low activity at
temperatures below their physiological temperature. Find-
ing conditions in which an enzyme is activated but not
destabilized at low temperature is one way to increase
the catalytic efficiency of the thermophilic enzymes.
Another way would be to identify the rate-limiting step
in enzyme catalysis. This information may indicate a
suitable amino-acid residue in the active site as a target for
protein engineering that could result in activation of the
enzyme [2].
Here, we report the case of a thermophilic enzyme that
is sensitive to the conformational flexibility of the active
site. We have studied the effect of urea on NADH oxidase
(EC 1.6.99.3) from Thermus thermophilus.NADHoxidase
is a dimeric flavoprotein containing one molecule of FMN
in each 25-kDa monomer, and it catalyzes hydride
transfer from NADH to an acceptor such as FAD,
ferricyanide, oxygen, and others [10]. It belongs to the
flavin reductase/nitroreductase family that has similar
broad substrate specificity, similar folding and similar
quaternary structure [11,12]. The localization and potential
physiological role of this ÔalternativeÕ dehydrogenase in
this thermophile species is not known. In the course of the
purification procedure, the major activity of NADH
oxidase was found in the supernatant of the cell lysates.
The main location of the NADH oxidase activity was
found in the polar aqueous solution. This indicates a
possible role in regulation of the cytoplasmic NADH/
NAD
+
moiety.
The flavin cofactors, FMN and FAD, are tightly bound
with dissociation constants of % 10
)7
M
)1
and % 10
)5
M
)1
,
respectively. The low temperature factor determined from
the crystal structure also indicates tight binding [10]. NADH
oxidase is relatively rigid, however, the cofactor is located in
Correspondence to E. Sedla
´
k, Department of Biochemistry,
Faculty of Sciences, P. J. S
ˇ
afa
´
rik University, Moyzesova 11,
041 54 Kos
ˇ
ice, Slovakia. E-mail:
Enzymes: NADH oxidase (EC 1.6.99.3).
(Received 20 September 2003, accepted 22 October 2003)
Eur. J. Biochem. 270, 4887–4897 (2003) Ó FEBS 2003 doi:10.1046/j.1432-1033.2003.03889.x
the intermonomeric interface that is a region with relatively
high dynamics [13]. Binding of substrate in homologous
reductases is accompanied by the induced fit of the helix at
the intermonomeric interface. The high temperature factor
of the analogous helix in NADH oxidase indicates its high
flexibility. Destabilization of this helix containing Trp47
would affect the interaction of the flavin cofactor with
Trp47 in the active site of the enzyme. This could be a
general mechanism of substrate/enzyme interaction in this
flavoprotein family.
In the work presented here, we have shown that NADH
oxidase can be activated in low concentrations of chaotropic
agents due to increased local dynamics in the active site. The
rate-limiting step in NADH oxidase is proposed to include
movement of Trp47. The observed correlation between
activity and tryptophan fluorescence can occur only when
the enzyme is in a dimeric form, indicating that NADH
oxidase is a functional homodimer.
Experimental procedures
Analytical-grade biochemicals were obtained from Merck
(Germany). Urea (high purity grade) was purchased from
Sigma. Urea concentrations were determined from refract-
ive index measurements using an Abbe Refractometer AR3-
AR6. The pH values of the solutions were measured with a
Sensorex glass electrode before and after measurement at
room temperature. Only the measurements at which the pH
change was less than 0.2 pH units were taken for further
consideration.
Protein expression and purification
The NADH oxidase from T. thermophilus was overpro-
duced in E. coli JM 108 using recombinant plasmid
pTNADOX (amp
R
, tac promotor and nox gene) [14].
1m
M
IPTG (Gerbu) was added after the bacterial culture
reached D
600
¼ 0.9–1.0 and harvested after 4–5 h. The
purification procedure for the overproduced NADH oxi-
dase was described earlier [15] and used with only minor
modifications. The heat treatment step was performed in the
presence of a small amount of FAD (increases the thermal
stability of the enzyme), dialyzed and loaded on a Blue
Sepharose CL-6B affinity column. After the washing
procedure NADH oxidase was eluted with 1 m
M
NAD
+
.
The final product was a single band on a SDS/PAGE gel
[16] stained with Coomassie Brilliant Blue. Before use, the
protein was dialyzed in the absence of FAD in 50 m
M
phosphate buffer, pH 7.2. The final preparation yielded
NADH oxidase with a specific activity of 11.32 unitsÆmg
)1
at 20 °C. One unit is defined as 1 l
M
NADH oxidized per
min.
Determination of the protein concentration
The extinction coefficient (e) of the protein at 280 nm was
calculated from the number of tryptophan residues (4),
tyrosine residues (7) and cysteine residues (0) per mono-
mer using an equation in [17]. The predicted molar
absorption coefficient for apoenzyme is e
280
¼
32 430
M
)1
Æcm
)1
. The noncovalently bound cofactor
FAD also contributes to the extinction coefficient at
280 nm. The molar absorption coefficient for FAD
dissolved in pH 7.2 phosphate buffer, is e
280
¼
20 600
M
)1
Æcm
)1
. Therefore, the protein concentration
with the bound cofactor was determined using the
extinction coefficient e
280
¼ 52 030
M
)1
Æcm
)1
. The calcu-
lated specific activity is very similar to previous data [15],
provided the protein concentration was determined
according to the method of Bradford.
Steady-state kinetics
All kinetic measurements were performed on a Shimadzu
UV3000 spectrophotometer. The kinetic parameters were
determined from the initial decrease in the absorbance of
NADH at 340 nm (e
340
¼ 6220
M
)1
Æcm
)1
), at 20 °C.
Measurements were performed after incubation (12 h) in
120 n
M
NADH oxidase holoenzyme, 50 m
M
sodium
phosphate, pH 7.2, containing 0.120 m
M
FAD and differ-
ent concentrations of urea. The reaction was started with
the addition of NADH. The observed rate at 340 nm is a
combination of the enzyme-mediated rate changes and
other rates, e.g. the self-decay of NADH and the reduction
of externally added FAD. The self-decay of NADH is
insignificant in these conditions and needs to be taken into
account only at high temperatures. The externally added
FAD has an absorption maximum at 375 nm, and
reduction of the flavin might affect the absorbance at
340 nm. To determine if the change in the redox state of
exogenously added FAD contributes to the time-dependent
changes in absorbance at 340 nm, related to oxidation of
NADH, we have monitored the reduction/oxidation reac-
tion of FAD. Because it is very complicated to follow this
reaction in the presence of NADH at 340 nm we have
monitored the reduction/oxidation of FAD at 450 nm. Our
results indicated that equilibrium of the reaction has been
achieved within the time (% 10 s) the instrument took to
start collecting data, which is in accordance with a
previously reported observation [18]. Therefore, this reac-
tion does not contribute to time-dependent changes in
absorbance at 340 nm during measurements. The oxidation
rate of NADH depends on the initial flavin concentration,
and saturation occurred at nearly 0.10 m
M
flavin. In the
enzyme assay the concentration of FAD was always
0.120 m
M
. The data were fitted to the Michaelis–Menten
equation where K
M, app
corresponds to the apparent
Michaelis constant and the apparent V
max
is the maximum
velocity for the catalytic reaction. The experimental data
were also plotted according Lineweaver-Burk and analyzed
by linear regression. Similar results were obtained using
both methods.
Temperature dependence of enzyme activity
Enzyme activity measurements were performed in 50 m
M
phosphate buffer, 0.120 m
M
FAD and 120 n
M
holoenzyme.
The reactions were started by the addition of NADH to
achieve a final concentration of 0.180 m
M
NADH. The
initial velocities were measured from 20 to 40 °C. The
temperature during measurements was kept constant by
temperature controlled water circulation around the
cuvette. Temperature dependences were analyzed with a
simple Arrhenius equation
4888 G. Z
ˇ
olda
´
k et al.(Eur. J. Biochem. 270) Ó FEBS 2003
lnk
cat
¼À
E
a
RT
þ C
1
ð1Þ
where R is the gas constant (8.314 JÆK
)1
Æmol
)1
), E
a
is the
activation energy for the observed reaction and C
1
is a
temperature independent constant. Data (at least five
points) were plotted as ln(k
cat
)vs.T
)1
and analyzed by
linear regression. Coefficients of linearity were typically
higher than 0.98. From comparison of the Arrhenius
equation and the transition state theory the enthalpy DH*
and entropy DS* of activation were calculated
DH
Ã
¼ E
a
À RT ð2Þ
T ln
k
cat
T
¼
TDS
Ã
R
þ C
2
ð3Þ
C
2
is the temperature independent constant. This approach
avoided any extrapolation connected with large errors in the
estimation of the activation entropy [19].
ThefreeenergyofactivationDG* was calculated from
the equation:
DG
Ã
¼ DH
Ã
À TDS
Ã
ð4Þ
Fluorescence emission spectroscopy
The fluorescence steady-state measurements were per-
formed on a Shimadzu RF5000 spectrofluorophotometer.
Using different excitation wavelengths, i.e. 280, 290 and
450 nm, we were able to follow changes in the environment
close to different internal chromophores, i.e. Tyr, Trp and
FAD, respectively. The cuvette contained 50 m
M
sodium
phosphate, pH 7.2, with various concentrations of urea and
2.4 l
M
dimeric protein in a total volume of 2.5 mL. To
avoid the inner filter effect the absorbance of protein
samples was always lower than 0.1. Samples were incubated
12 h at room temperature. The data from all fluorescence
and quenching experiments were collected at 25 °C. The
quantum yields were calculated by a comparative method
using the integrated areas of fluorescence intensity for
protein samples and for free
L
-tryptophan [20,21]. The
quantum yield of free
L
-tryptophan was used as a standard
(F
L-Trp
¼ 0.14) [22]. A similar approach was also used for
FAD in solution (F
FAD
¼ 0.05).
Fluorescence quenching
Quenching experiments were performed with acrylamide
(Carl Roth GmbH & Co., Germany). A fresh 2
M
acryl-
amide (14.2%) solution was dissolved in 50 m
M
sodium
phosphate buffer, pH 7.2. Protein concentrations of
5–10 l
M
were used in 50 m
M
sodium phosphate buffer,
pH 7.2, and various concentrations of urea in a total
volume of 2.5 mL. The acrylamide was added to the cuvette
in 5, 10 and 20 lL aliquots. After 30 s incubation the
emission spectra after excitation at 290 nm were recorded.
Longer incubation times were not necessary. No significant
changes occurred in the emission band even after 1 h of
incubation. Therefore, a 30 s incubation interval was used
for all measurements and samples were assumed to reach
equilibrium. Analysis of the experimental data was
performed using several models. The Stern–Volmer
equation (Eqn 5) assumes a homogenous population of
fluorophores:
F
0
F
¼ 1 þ k
0
s
0
½Qð5Þ
where k
0
s
0
¼ K
SV
which is the quenching constant. k
0
is the
bimolecular quenching constant describing collisional
quenching, and s
0
is the fluorescence lifetime of the
tryptophan residues. In some cases, quenching of the
tryptophan moiety could be described with a model of a
single fluorophore population [23]. This model was success-
fully used for N-acetyl-
L
-tryptophanamide and also for
NADH oxidase in 9
M
urea. Equation 5 does not include
static quenching, i.e. the formation of a fluorophore
complex with the quencher before excitation. In the case
of static quenching, the dependence of F
0
/F on Q, as plotted,
has an upward curvature due to factor e
[Q]V
where V is the
static constant [24]. Data obtained from the quenching of
NADH oxidase by acrylamide were impossible to fit to a
simple Stern–Volmer equation due to a downward curva-
ture of F
0
/F vs. Q. This is typical for heterogeneous
populations of fluorophores. This is not surprising because
NADH oxidase contains four tryptophan residues, each
with a different extent of accessibility to the quencher.
Quenching of the tryptophan moieties of NADH oxidase
could be described in terms of accessible and nonaccessible
populations using a modified Stern–Volmer equation [25]:
F
0
F
0
À F
¼
1
f
a
þ
1
f
a
Á K
c
½Q
ð6Þ
where f
a
is the fraction of accessible fluorophore and K
c
is the
effective collisional quenching constant. This modified
equation assumes that the population is heterogeneous and
that there is a difference in the quenching behavior of the
different tryptophan moieties. A linear regression,
F
0
F
0
ÀF
vs
1
½Q
whose slope ¼
1
f
a
K
c
and intercept ¼
1
f
a
was used for data
analysis. Data processing was performed using
GRAFIT
3.00
(Erithacus Software Ltd, Cambridge, UK).
Circular dichroism measurements
CD measurements were performed on a Jasco J-600
(Tokyo, Japan) spectropolarimeter at 20 °Cwith29.3l
M
NADH oxidase in 10 m
M
sodium phosphate, pH 7.2, and
urea. A 0.1 cm path-length cuvette was used for the peptide
region and a 1 cm cuvette for the aromatic region. Each
spectrum was an accumulation of 4–6 consecutive scans.
The thermal transitions were recorded at 222 nm with a
constant scan rate of 1 KÆmin
)1
. The temperature was
measured with a PTC)348 WI Peltier block inside the
cuvette. The temperature calibration was performed with a
Brand (Wertheim, Germany) precision thermometer.
Results
Enzyme activity
The catalytic mechanism of NADH oxidase is not under-
stood. The enzyme kinetics of NADH oxidase from
T. thermophilus were analyzed using a simple Michaelis–
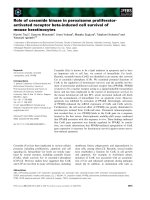
Menten model where FAD is at a saturation level. Figure 1
Ó FEBS 2003 Flexibility of the NADH oxidase active site (Eur. J. Biochem. 270) 4889
shows the time-dependence of NADH oxidation monitored
at 340 nm in the absence and in the presence of 1.25
M
and
4
M
urea. Surprisingly, the activity of NADH oxidase is
increased in the presence of urea and reached its optimum at
1.25
M
urea. The Lineweaver–Burk plot (Fig. 1, inset)
indicates that the presence of low urea concentrations affects
both the apparent maximal velocity of the reaction and the
apparent Michaelis constant for NADH’s interaction with
the enzyme. In the absence of urea the apparent steady-state
parameters were k
cat
¼ 6.6 ± 0.1 s
)1
and
K
M,app
¼ 5.2 ± 0.2 l
M
, and the catalytic efficiency was
k
cat
/K
M,app
¼ 1.3 ± 0.1 · 10
6
M
)1
Æs
)1
. These values are
similar to those published previously [15]. All parameters
consist of multiple kinetic terms and could not be associated
directly with any one step in the catalytic reaction.
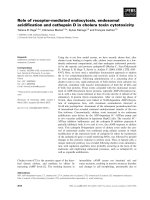
The effect of urea was studied in detail, and the results are
shown in Fig. 2. The measured parameters are summarized
in Table 1. The velocity of NADH oxidation is 2.5 fold
higher at 1.0–1.3
M
urea compared to the control. The
catalytic rate of NADH oxidase is also increased in the
presence of ionic chaotropic reagents such as guanidine
hydrochloride (% 0.5
M
) and sodium perchlorate
(% 0.25
M
) (data not shown). In all experiments, externally
added flavin was the electron acceptor that recovered the
reduced internal flavin. However, a similar activation of
NADH oxidase was also observed in the presence of
alternative acceptors such as ferricyanide (data not shown).
The presence of urea has a similar effect on both k
cat
and
K
M
, i.e. the increase in k
cat
is associated with an increase in
K
M
. This results in nearly constant values of k
cat
/K
M
at
different urea concentrations (Table 1). At higher concen-
trations of urea (> 2
M
) k
cat
sequentially decreases and, at
6.0
M
urea, the enzyme is essentially inactive.
Fluorescence
NADH oxidase from T. thermophilus contains many fluoro-
phore groups: seven tyrosine residues, four tryptophan
residues and the flavin cofactor per monomer. The trypto-
phan residues emission spectra were followed after excitation
at 290 nm. The maximum of the emission spectrum was
336 nm, i.e. the maximum shifted to lower wavelengths
compared to the emission spectrum of solvent exposed
L
-
tryptophan (352 nm) (Fig. 2, inset). This indicates that
tryptophan residues in the NADH oxidase dimer are buried
in nonpolar regions of the protein [26]. The emission band is a
convoluted contribution of all tryptophan residues in the
enzyme; therefore, it is difficult to determine separate
quantum yields. The averaged quantum yield is low
(F
av
¼ 0.07). The quantum yield of solvent accessible
L
-
tryptophan is 0.14 and it increases if the tryptophan residues
are buried. The low quantum yield of tryptophan fluorescence
in NADH oxidase shows efficient quenching of the trypto-
phan residues in the protein. Such quenching can be the result
of interactions with the flavin cofactor, the imidazole ring of
histidine residues, negatively charged carboxylic groups and/
or by the highly mobile indole group of the tryptophan
residues [27]. Steady-state analysis of the FAD fluorescence
in NADH oxidase has shown that its emission maximum
after excitation at 450 nm is centered at 522 nm. This is very
similar to the value of the emission maximum characteristic
for free FAD in aqueous solution (emission at 525 nm). This
finding is in agreement with the location of the cofactor in
the crystal structure of NADH oxidase [10]. The quantum
yield of the flavin cofactor in NADH oxidase (F ¼ 0.02) is
smaller than that of free FAD in solution (F ¼ 0.05).
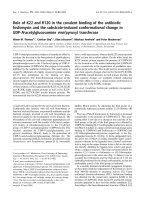
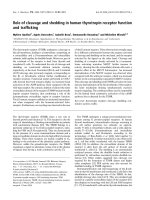
The position of the tryptophans and the flavin cofactor in
the crystal structure of NADH oxidase is depicted in
Fig. 3. It should be noted that the structure shown contains
FMN as the cofactor. However, the exchange of FMN for
FAD results in essentially an identical structure with only
Fig. 1. Enzymatic oxidation of NADH by NADH oxidase from
T. thermophilus monitored by absorbance at 340 nm at 0
M
, 1.25
M
, and
4
M
urea. Changes in absorbance were normalized. The curve is not
based on a theoretical analysis, it serves only to lead eyes. Inset: Line-
weaver–Burk plot for NADH oxidation in the absence of urea (s)and
in the presence of 1.25
M
urea (d). Assays were performed at 20 °C.
Fig. 2. The effect of urea concentration on the activity (d) and intrinsic
fluorescence (n)ofNADHoxidasefromT. thermophilus. Values of
fluorescence intensities are shown as the ratio F/F
0
, where F
0
corres-
ponds to fluorescence at 0
M
urea, and similarly A/A
0
is the ratio of the
activity (A) in the presence of urea and A
0
corresponds to the enzyme
activity at 0
M
urea. Inset: Fluorescence emission spectra of NADH
oxidase in the absence (solid line) and in the presence of 1.0
M
urea
(dashed line). Decrease in the fluorescence and the slight red-shift of
the fluorescence maximum was observed at the low urea concentra-
tion. Activity was determined from the initial linear decrease of the
absorbance at 340 nm. The fluorescence measurements were per-
formed with 5 l
M
protein using an excitation wavelength of 290 nm
for tryptophan residues. All experiments were performed at 20 °C.
4890 G. Z
ˇ
olda
´
k et al.(Eur. J. Biochem. 270) Ó FEBS 2003
slight conformational changes of the C-terminal end
between Glu189 and His194 to accommodate the second
phosphate group of FAD [10]. Tryptophan residues in the
monomeric form of NADH oxidase are spatially separated
from the location of the flavin cofactor. The distance
between N1 of the flavin cofactor and N
e1
of tryptophans 47,
52, 131, 204 are 33.6 A
˚
, 22.7 A
˚
, 25.1 A
˚
, 29.5 A
˚
,
respectively. In the dimeric form, the distances of trypto-
phan residues 47, 52, 131, 204 from the flavin cofactor are
7.7 A
˚
, 16.3 A
˚
, 12.5 A
˚
, 25.3 A
˚
, respectively. Interestingly,
changes in the enzyme activity correlate with changes in the
fluorescence intensity of the tryptophan residues. Fluores-
cence probes the properties of the local environment of the
dipole–dipole interaction rather than global structural
changes in proteins. As the dipole–dipole interaction
decreases very steeply with distance (as 1/distance
6
), the
relative position of Trp47 and the flavin cofactor is
especially notable. Moreover, the crystal structure indicates
that contact between Trp47 and the cofactor is mediated
through a tightly bound structural water molecule [10]. This
strongly indicates that the fluorescence of Trp47 is respon-
sible for the observed correlation between activity and
tryptophan fluorescence (Fig. 2). It is not possible to
exclude allosteric effects that could affect the distance
between the cofactor and the other tryptophan residues.
This is probably not the case because we could not see
significant changes in the circular dichroism spectra that
would accompany such a significant conformational change
(see below). In the presence of 1.0–1.3M urea, there is nearly
a 60% decrease in tryptophan fluorescence simultaneous
with a slight red shift (% 5 nm) of the tryptophan emission
maximum (Fig. 2, inset). Tryptophan residues 131 and 204
are completely exposed to solvent while Trp52 is rigidly
embedded at a distant location in the protein matrix. In the
case of NADH oxidase the perturbation of a microenvi-
ronment, probably that of Trp47, is interrelated with the
changes in activity at a narrow concentration range of urea.
At higher concentrations of urea (> 7
M
) the fluorescence
intensity sharply increases due to unfolding of the protein
and dissociation of the flavin cofactor (data not shown). At
9
M
urea the tryptophan residues of NADH oxidase possess
characteristics very similar to free
L
-tryptophan F % 0.19
and k
em
¼ 350 nm. The flavin fluorescence is not changed
significantly in the presence of 0–7
M
urea (data not shown).
The urea-induced changes in enzyme activity and urea-
induced protein unfolding, as monitored by fluorescence,
show that inactivation of the enzyme takes place before the
global unfolding of the protein.
Circular dichroism
The global structure of the protein may be efficiently
monitored by CD spectroscopy. The effect of urea on the
Table 1. Steady-state kinetic parameters (k
cat
and apparent K
M
) at various concentrations of urea and temperature. Acrylamide quenching constants
and the fraction of the accessible tryptophans for NADH oxidase at various concentrations of urea. Activity and quenching experiments were
performed at 20 °C (see Experimental procedures). Kinetic parameters were obtained by the nonlinear regression analyses of a simple Michaelis–
Menten equation. Quenching parameters were obtained from fitting by a modified Stern–Volmer equation (Eqn 6). Standard deviations (±)
represent possible errors in the estimated parameters for straight line.
Urea (
M
)
0 0.5 1.0 1.5 2.0
Activity
K
M, app
(l
M
) 5.2 ± 0.2 8.8 ± 0.2 9.2 ± 0.4 13.8 ± 0.9 9.1 ± 0.4
k
cat
(s
)1
) 6.6 ± 0.1 9.9 ± 0.1 14.9 ± 0.2 15.3 ± 0.4 9.9 ± 0.2
k
cat
/K
M, app
(
M
)1
Æs
)1
) 1.27 · 10
6
1.12 · 10
6
1.64 · 10
6
1.10 · 10
6
1.10 · 10
6
T
opt
(°C) 70 ± 3 47 ± 3 50 ± 3 53 ± 3 52 ± 3
Fluorescence quenching
K
c
(
M
)1
) 20 ± 1 7.6 ± 0.6 6.8 ± 0.4 10.0 ± 0.1 14.9 ± 0.1
f
a
0.42 ± 0.03 0.59 ± 0.17 0.71 ± 0.08 0.61 ± 0.03 0.48 ± 0.03
r
a
(0.9900) (0.9720) (0.9900) (0.9968) (0.9891)
a
Coefficients obtained by linear regression.
Fig. 3. Dimeric structure of NADH oxidase from T. thermophilus.
Monomers are drawn in different greyscale. All tryptophan residues
and FMN cofactors are shown. Noteworthy, Trp47 is located close to
the environment of the FMN cofactor. The structure was drawn using
VIEWER LITE
42 (1NOX.pdb).
Ó FEBS 2003 Flexibility of the NADH oxidase active site (Eur. J. Biochem. 270) 4891
activity of NADH oxidase was therefore investigated by
circular dichroism at various concentrations of urea
(Fig. 4). The shape of the spectra in the far UV region is
typical for a mixture of a-helix and b-sheet elements in
the secondary structure. No apparent differences were
observed in ellipticity in the peptide region in the absence
or in the presence of 6.7
M
urea. The secondary structure
of the enzyme is unaffected even at high concentrations of
urea indicating an extreme resistance to urea-induced
perturbations. The ellipticity in the near UV region is
characteristic for aromatic residues – tryptophan, tyrosine,
and the flavin cofactor. Contrary to the situation in the
peptide region, the aromatic region is sensitive to urea
(Fig. 4B). The proximity of Trp47 to the flavin cofactor
induces asymmetry in the tryptophan environment that is
likely to result in a strong positive signal in the aromatic
region. The addition of urea causes gradual changes in the
near UV spectrum (Fig. 4B, inset) accompanied by a
decrease in ellipticity at 265 nm and a slight shift to longer
wavelengths. The isodichroic point at about 270 nm
indicates that the conformational transition has a two-
state character. As observed by fluorescence measurements,
the circular dichroism results confirm that the inactivation
of the enzyme at high concentrations of urea (> 6
M
)is
not accompanied by the global unfolding reaction. The
gradual changes in ellipticity in the aromatic region
indicate local conformational changes and/or changes in
the tertiary structural dynamics in the environment of the
flavin cofactor.
Thermal stability of the active site and global structure
of the enzyme
The temperature dependence of the enzyme activity was
measured as an indicator of stability of the active site.
Unfolding of secondary structure is related to global
unfolding of protein structure. The ellipticity at 220 nm
was therefore measured to assess the stability of the global
structure (Fig. 5). In the absence of urea, the enzyme
achieves its maximal activity at % 70 °C which is close to the
optimal temperature of T. thermophilus [15]. In the condi-
tions where the maximal activity of the enzyme at room
temperature was achieved, i.e. in the presence of 1.25
M
urea, the stability of the active site of the enzyme is
significantly perturbed. The optimal temperature for
enzyme activity at 1.25
M
urea was shifted by % )25 °C
from the optimal temperature of NADH oxidase in the
absence of urea (Fig. 5). An additional increase in the urea
concentration (> 2.0
M
) had no significant effect on the
optimal temperature of the enzyme but reduced the
maximal enzyme activity (Fig. 5, Table 1). The transition
temperature, T
trs
, of unfolding of the secondary structure, is
represented by the position of the peak maximum of the first
derivative of ellipticity at 220 nm dQ/dT. Global stability,
characterized by this transition temperature, is significantly
higher than the thermal stability of the active site of the
enzyme (Fig. 5). In the absence of urea, T
trs
¼ 88.6 °C
,
about 15 °C higher than the temperature of the physiolo-
gical milieu of T. thermophilus. In the presence of low
concentrations of urea, i.e. 2.5
M
, the transition temperature
decreases only by about 3 °C. Even in the conditions where
the enzyme is completely inactive, i.e. at 6.7
M
urea, the
thermal transition of the protein secondary structure has a
sigmoidal shape with T
trs
¼ 71.6 °C (data not shown). In
summary, the active site of the enzyme is considerably more
sensitive to temperature-induced perturbation than the
global structure of NADH oxidase. This is most pro-
nounced at low concentrations of denaturant where the
optimal activity of the enzyme is achieved at the expense of
the flexibility/stability of the active site of the enzyme.
Fig. 4. Circular dichroism spectra of NADH oxidase from T. thermo-
philus in the peptide (A) and aromatic (B) regions in the absence and
presence of urea. (A) 0
M
urea (solid line), 6.7
M
urea (dashed-double
dotted line). (B) 0
M
urea (solid line), 0.9
M
(dashed line), 1.7
M
(dotted
line), 3.5
M
(dash-dotted line), and 6.7
M
urea (dash-double dotted
line). Measurements were performed on a Jasco J-600 spectropola-
rimeter with 29.3 l
M
NADH oxidase. A 0.1 cm path-length cuvette
was used for far UV and a 1 cm cuvette for the aromatic region. Inset:
dependence of difference in the CD spectra at 250–320 nm on con-
centration of urea. The curve in the inset is not based on a theoretical
analysis, it serves only to lead the eyes.
Fig. 5. Normalized activity and the first derivative of the melting curve
of NADH oxidase monitored by ellipticity at 220 nm. Activity was
measured in 50 m
M
phosphate buffer, pH 7.2, in the absence of urea
(d), 1.25
M
urea (n)and2.0
M
urea (h), respectively. Heat denatur-
ation was measured in 10 m
M
phosphate buffer, pH 7.2, in 0
M
urea
(solid line), 1.3
M
urea (dotted line) and at 2.6
M
urea (dashed line).
The lines are not based on a theoretical curve but only serve to lead the
eyes. Transition temperature at 0
M
urea T
trs
¼ 88.6 °C, 1.3
M
urea
T
trs
¼ 88.4 °C and at 2.6
M
urea T
trs
¼ 85.6 °C.
4892 G. Z
ˇ
olda
´
k et al.(Eur. J. Biochem. 270) Ó FEBS 2003
To address quantitatively the activation of NADH
oxidase at low concentrations of denaturant, the activation
parameters DH*andDS* of the reaction were determined
(Fig. 6). The activation parameters were calculated accord-
ing equations 1–3. The urea effect on DH*andTDS*
indicates that both parameters reach a minimum at the urea
concentration at which enhancement of activity is observed
(Fig. 2). The Arrhenius plot in the absence of urea is linear
from 20 to 65 °C without any apparent curvature or break
(Fig. 6, inset) as was reported for some other enzymes from
thermophiles [28]. Interestingly, the Arrhenius plots in the
absence and in the presence of 1.0
M
urea intersect at
% 60 °C. This indicates that the activity of NADH oxidase
is the same in both conditions at this temperature.
Consequently, the enzyme was not activated by the addition
of urea at 60 °C (data not shown).
Fluorescence quenching
In an effort to monitor the accessibility of the tryptophan
residues as an indicator of the dynamics of the active site,
quenching experiments were performed. Acrylamide was
used to quench the fluorescence of the tryptophan residues.
It is known to be an effective quencher of the fluorescence of
tryptophan residues that are completely or partially exposed
to solvent [29]. Quenching experiments enabled us to
determine the effective quenching constants K
c
, and the
number of accessible tryptophan residues f
a
.NADH
oxidase contains four tryptophan residues in different
locations within the enzyme that prevents a detailed
analysis. A comparison of the parameters determined by
quenching, however, enabled us to extract information
about changes in the accessibility of the tryptophan residues
in NADH oxidase (Table 1). Quenching of N-acetyltrypto-
phanamide, as a model compound that is fully accessible to
the solvent, is characterized by K
c
¼ 35.7 ± 0.3
M
)1
and
f
a
¼ 1.02 ± 0.01 (Eqn 6). If the simple Stern–Volmer
model is used we obtained K
SV
¼ 37 ± 2
M
)1
(Eqn 5). In
the absence of urea, the effective quenching constant for
NADH oxidase was K
c
¼ 20 ± 1
M
)1
and the fraction of
accessible fluorophore f
a
¼ 0.42 ± 0.03, indicating that
% 2 tryptophan residues are accessible to solvent (Fig. 7)
which agrees with the crystal structure that shows that
Trp131 and Trp204 are completely exposed to the solvent
[10]. Iodide anions are another type of quencher that, due to
the negative charges, is only accessible to protein surfaces.
The fraction of fluorophores accessible to iodide anions was
f
a
¼ 0.41 ± 0.02. The activity and the conformation of the
active site of NADH oxidase are very sensitive to both the
ionic strength and the type of anions (G. Z
ˇ
olda
´
k, M. Sprinzl
and E. Sedla
´
k, unpublished results). Therefore, for further
quenching experiments we have used only uncharged
acrylamide. Table 1 shows that the fraction of exposed
tryptophan residues of NADH oxidase increased in 1.0
M
urea to the value f
a
¼ 0.71 ± 0.08. This value corresponds
to the exposure of three tryptophan residues to solvent. To
be certain that acrylamide does not affect the conformation
of the enzyme active site, we have determined the enzyme
activity in the presence of up to 180 m
M
acrylamide. At such
relatively high concentrations of acrylamide the enzyme
activity was only slightly diminished, % 10–15%, compared
to the sample without acrylamide. This indicates that
acrylamide does not significantly affect the conformation of
the enzyme active site. This agrees with previously published
results that acrylamide does not seriously perturb the native
Fig. 6. Activation parameters DH*(d) and TDS*(s) as a function of
urea concentration. Values were obtained from kinetic experiments
described in Experimental procedures using Eqns 1–3. Arrhenius plots
were analyzed at various concentrations of urea and temperatures in
the range from 20 to 40 °C. Errors were calculated according to the
deviation from linearity of the Arrhenius plots. The lines are not based
on a theoretical curve, but only serve to lead the eyes. Inset: Arrhenius
plots of NADH oxidase in the absence and in the presence of 1.0
M
urea, respectively. The plots intersect at % 60 °C, i.e. the activity is
equal at this temperature, indicating that the dynamics of the active site
are comparable.
Fig. 7. Modified Stern–Volmer plots (Eqn 6) for acrylamide quenching
of tryptophan fluorescence at 0
M
urea (d)and1.0
M
urea (s). Lines
were obtained from the linear regression analysis. F
0
, F is fluorescence
in the absence and presence of acrylamide, DF represents the difference
F
0
–F.For0
M
urea: y ¼ 0.121Æx +2.41(r ¼ 0.990). For 1.0
M
urea:
y ¼ 0.210Æx +1.40 (r ¼ 0.990). For comparison, the acrylamide
quenching of N-acetyl-
L
-tryptophanamide (NATA) fluorescence is
shown (dashed line). NATA is a tryptophan analogue completely
exposed to molecules of solvent and the quencher.
Ó FEBS 2003 Flexibility of the NADH oxidase active site (Eur. J. Biochem. 270) 4893
conformation of proteins because the enzyme activity of a
number of proteins is unaffected in the presence of
acrylamide [29].
Discussion
Activation of NADH oxidase is caused by an increase in
the conformational dynamics of the enzyme active site
NADH oxidase from T. thermophilus, has diminished
activity at low temperatures, similar to many enzymes from
thermophilic organisms [4,30]. The activation of NADH
oxidase at low concentrations of chaotropic agents may
result from: (a) a conformational change and/or (b)
increased dynamics in the enzyme active site or (c)
destabilization of the enzyme-product complex. Several
types of electron-acceptors used (FMN, FAD, oxygen,
ferricyanide) gave similar results. This indicates that desta-
bilization of the enzyme-product complex is not the rate-
limiting step in NADH oxidase catalysis. It also indirectly
indicates that the kinetic mechanism of NADH oxidase is
the ping-pong reaction found in other homologue oxidases
[31]. The activation is due to conformational and/or
dynamic changes in the enzyme active site. This agrees with
previously published observations that activation of differ-
ent enzymes at low concentrations of chaotropic agents was
associated with conformational changes in the tertiary
[32–37], and secondary [38] structure of the enzymes, or the
dynamics of the enzyme active site [39,40].
NADH oxidase activation correlates with changes in
tryptophan fluorescence. Although the enzyme contains 4
tryptophan residues, only one tryptophan, Trp47, has a
suitable spatial location. The distance and the orientation of
the dipole moment (1L
a
) towards the isoalloxazine ring of
the flavin cofactor enables us to monitor static or dynamic
conformational changes in the active site (Figs 3 and 8). It
should be emphasized that the proper position of a
tryptophan residue towards the flavin cofactor is possible
only in the dimeric structure of NADH oxidase. None of the
tryptophan residues is close to the binding site of the flavin
cofactor in the monomeric form of the enzyme (Fig. 3). The
correlation of the decrease of tryptophan fluorescence and
enzyme activity at low concentrations of urea strongly
indicates that NADH oxidase forms functional dimers.
Although the dimeric structure is obvious from the crystal
structure [10], it was not apparent from the properties of the
enzyme in solution [15].
The enzyme concentration (80-fold difference) had no
effect on the urea–induced activity changes. This implies that
the quaternary structure of NADH oxidase is intact in the
range of urea concentrations at which enzyme activation
occurred. The effect of urea on the level of the tertiary but not
the secondary structure of the enzyme active site is indicated
by: (a) a significant shift of the optimal temperature/activity
profile to lower values and unaffected thermal stability of
global folding (Fig. 5), (b) ellipticity changes in the aromatic
region (Fig. 4B) and unperturbed ellipticity in the peptide
region (Fig. 4A), and (c) a change in intensity and a slight
shift in the maximum position of tryptophan fluorescence
without any other apparent conformational changes.
There is a well-known relationship between protein
stability and protein flexibility/rigidity that assumes the
rigidity of the polypeptide chain is a prerequisite for global
protein stability. This relationship is supported both
experimentally [1,4,41,42] and theoretically [3]. On the other
hand, an inverse relationship exists between rigidity and
enzymatic catalysis [43,44]. Urea-induced perturbation of
the environment of the active site of NADH oxidase results
in a partial exposure of buried Trp47 to solvent due to the
increased dynamics of the active site. This is supported by
(a) the slight shift in the maximum of tryptophan fluores-
cence to higher wavelengths (Fig. 2), (b) insignificant
changes in the ellipticity in the aromatic region, and,
importantly (c) an increased fraction of tryptophan residues
made accessible by the addition of a quencher such as
acrylamide (Fig. 7). The higher dynamics of the active site is
also indirectly reflected by (a) a )25 °C shift of the optimal
temperature and (b) an increase in the apparent K
M
values
for NADH binding to the enzyme (Table 1). The pro-
nounced local destabilization of the active site and the
unaffected global stability (Fig. 5) agrees with observations
that the active site is the most flexible and thus the most
labile part of the enzyme [2]. Therefore, the enzyme active
site undergoes inactivation at milder conditions than is
necessary for global unfolding [8].
Protein dynamics are characterized by motion on a broad
spectrum of time scales. Not all time scales are relevant or
significant for the stability or activity of an enzyme [45].
Because the lifetime of the excitation state of tryptophan is
several nanoseconds [24], the activation of NADH oxidase
must occur on a nanosecond time scale. This matches the
observed rate constants for the process of stacking and
unstacking bases in nucleic acids that is in the range of
10
6
)10
7
s
)1
[46,47].
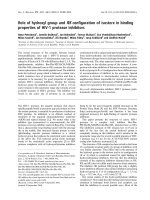
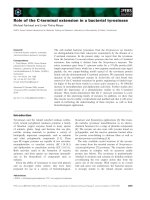
Fig. 8. Localization of Trp47, Wat42 and FMN in the dimeric interface
of NADH oxidase from T. thermophilus. The individual monomers are
designated by the letters A and B. The side chain of Trp47 is almost
parallel to the flavin system. The water molecule forms hydrogen
bonds to the backbone nitrogen of Trp47 and to O2 of the ribityl chain
and is located in the middle of the flavin system with distances of 3.3 A
˚
toN10and3.7A
˚
to N5. Arrows indicate the possible flipping move-
ment of the Trp47 side chain induced by low concentrations of urea
(1.0–1.5 m) or by incoming substrate – the nicotinamide ring. The
structure was drawn using
VIEWER LITE
42.
4894 G. Z
ˇ
olda
´
k et al.(Eur. J. Biochem. 270) Ó FEBS 2003
The determination of the activation parameters shows (a)
positive values of DH*andTDS* in the absence of urea and
(b) a decrease of both parameters by % 15–20 kJÆmol
)1
in
the range of urea concentrations where the enzyme activa-
tion occurs (Fig. 6). Because urea effects both of the
activation parameters, the so-called enthalpy/entropy com-
pensation [19,48,49], tells us that DH*andTDS*have
opposite effects on the activity of the enzyme. The decrease
in DH* diminishes the energy barrier of the reaction,
whereas the decrease in DS* decelerates the catalytic action.
The decrease in both parameters indicates that the ground
and transition states are similar. The positive entropy seems
surprising, at first glance, for a process that involves a tight
interaction of NADH and FAD in the active site of the
enzyme. This is probably due to the structural role of the
water molecule in the enzyme active site [50]. The observed
decrease in both activation parameters at % 1.5
M
urea
(Fig. 6) indicates that the difference between the ground and
the transition state was reduced. The effect of a low urea
concentration (1.25
M
) might be interpreted as a breakage
of a noncovalent bond in the active site that reduces its
rigidity resulting in the negative affects on the activity of the
enzyme at low temperature. The value of the decrease in
DH* % 15–20 kJÆmol
)1
corresponds to the loss of about one
hydrogen bond and the location of the structural water
molecule in the active site. The crystal structure of the
enzyme supports the inclusion of the structural water
molecule in catalysis.
Implications of the observed changes for enzyme
catalysis and conformational changes
Generally speaking, proteins have more mobility in the
side chains than in the peptide backbone. This is
especially true for side chains that participate in enzy-
matic catalysis [51]. Analysis of the cofactor in the
binding site from the crystal structure shows an inter-
action between the flavin cofactor, the water molecule
and Trp47 (Fig. 8) [10]. The side chain of Trp47 is almost
parallel to the isoalloxazine ring; however, the elevated
temperature factor and the weaker electron density
indicate it is flexible. The 6–7 A
˚
gap between this side
chain and the flavin ring contains some diffused electron
density and one well defined and tightly bound water
molecule. This water molecule forms hydrogen bonds
with the backbone nitrogen of Trp47 and the O2 of the
ribityl chain, and it is located in the middle of the flavin
system with distances of 3–4 A
˚
to the flavin nitrogens
[10].
NADH oxidase and three homologous flavoproteins
form a novel flavoprotein family in which all members
contain an aromatic amino-acid residue (Phe, Trp) that
interacts with the isoalloxazine ring of the flavin cofactor
[31]. This conserved interaction may play an important
role in the catalytic mechanism of the flavoproteins. In
fact, the crystal structure of the nonhomologous enzyme
NADPH-cytochrome P450 oxidoreductase, with NADP
+
shows nicotinamide access to FAD is blocked by a
tryptophan residue that stacks against the isoalloxazine in
the flavin ring [52]. It has been proposed that the
tryptophan residue acts as a ÔswitchÕ – when reduced
substrate, NADPH, enters the active site an interaction
between the isoalloxazine and nicotinamide rings is able
to displace the tryptophan residue. After the substrate is
oxidized to NADP
+
the interaction between the nicotin-
amide ring and the flavin cofactor weakens and the indole
ring of the tryptophan displaces the oxidized substrate
from the binding site. This mechanism may be common
in the catalytic actions of flavoproteins. A similar
movement of aromatic amino-acid residues in active sites
of enzymes after interaction with substrate has been
proposed for other flavoproteins [53].
In NADH oxidase, the binding site of the incoming
substrate (NADH) is blocked by a water molecule tightly
bound to the flavin cofactor and Trp47. Thus, the nicotin-
amide ring has to displace the water molecule to achieve the
proper position for hydride transfer to the cofactor.
Breaking of the hydrogen bond(s) which displaces the water
molecule, and the concomitant local conformational change
in the enzyme active site might be the rate-limiting step in
NADH oxidation. We speculate that this is the mechanism
by which urea at low concentrations activates NADH
oxidase at room temperature. It perturbs hydrogen bond(s)
in the active site between the flavin cofactor, the water
molecule and Trp47 (decrease in DH*by% 15–20 kJÆ
mol
)1
). This leads to release of strain in the active site and an
increase in the dynamics of the Trp47 side chain (decrease in
the tryptophan fluorescence and a slight red shift of the
fluorescence maximum), weakens the water molecule’s
interaction with the flavin cofactor and opens the active
site (increased f
a
value from quenching experiment). The
isodichroic point in the aromatic region of the circular
dichroism spectrum (Fig. 4B) indicates a two state character
for the conformational change. The flavin-aromatic amino
acids probably move from closed (buried and rigid) to open
(exposed and dynamic) in the active site. In fact, it has been
shown that the equilibrium between solvent-exposed and
ÔburiedÕ forms of the flavin cofactor may be important in the
catalytic mechanism of flavoproteins [54]. Although our
results strongly suggest that Trp47 has a role in enzymatic
catalysis, they are not conclusive. The current work;
however, identifies Trp47 as a good candidate for site
directed mutagenesis to elucidate the rate-limiting step in the
NADH oxidase catalysis.
The increased dynamics due to urea-induced perturbation
of hydrogen bonds decreases the energy needed to go from
the ground state to the transition state in the active site of
NADH oxidase from T. thermophilus at room temperature.
The changes in the dynamics of the active site of NADH
oxidase at room temperature caused by changes in solvent
properties, pH, and the presence of chaotropic anions
further indicate an important role for dynamics/plasticity in
the enzyme catalysis.
Acknowledgements
The authors would like to thank the Fonds der Chemischen Industrie
for financial support. We are also grateful for support through grants
No. D/01/02768 from the Deutsche Akademische Austauschdienst
(DAAD), no. 1/8047/01 and 1/0432/03 from the Slovak Grant Agency,
and an internal grant from the UPJS Faculty of Sciences (VVGS 2002)
for E.S and G.Z
ˇ
. We thank Norbert Grillenbeck for his technical
assistance. The authors wish to thank Linda Sowdal for her invaluable
editorial help in preparing the manuscript.
Ó FEBS 2003 Flexibility of the NADH oxidase active site (Eur. J. Biochem. 270) 4895
References
1. Vihinen, M. (1987) Relationship of protein flexibility to thermo-
stability. Protein Eng. 1, 477–480.
2. Shoichet, B.K., Baase, W.A., Kuroki, R. & Matthews, B.W.
(1995) A relationship between protein stability and protein func-
tion. Proc. Natl Acad. Sci. USA 92, 452–456.
3. Tang, K.E. & Dill, K.A. (1998) Native protein fluctuations: the
conformational-motion temperature and the inverse correlation of
protein flexibility with protein stability. J. Biomol. Struct. Dyn. 16,
397–411.
4. Za
´
vodszky, P., Kardos, J., Svingor, A. & Petsko, G.A. (1998)
Adjustment of conformational flexibility is a key event in the
thermal adaptation of proteins. Proc. Natl Acad. Sci. USA 95,
7406–7411.
5. Thomas, T. & Cavicchioli, R. (2000) Effect of temperature on
stability and activity of elongation factor 2 proteins from Antarctic
and thermophilic methanogens. J. Bacteriol. 182, 1328–1332.
6. Lindstrøm-Lang, K.M. & Schellman, J.A. (1959) In Enzymes
(Boyer, P., ed.) pp. 413–510. Academic, New York.
7. Koshland, D.E. (1958) Application of a theory of enzyme spe-
cificity to protein synthesis. Proc. Natl Acad. Sci. USA 44, 98–104.
8. Tsou, C L. (1995) Inactivation precedes overall molecular con-
formation changes during enzyme denaturation. Biochim. Biophys.
Acta 1253, 151–162.
9. Vieille, C. & Zeikus, G.J. (2001) Hyperthermophilic enzymes:
sources, uses, and molecular mechanisms for thermostability.
Microbiol. Mol. Biol. Rev. 65, 1–43.
10. Hecht, H.J., Erdmann, H., Park, H.J., Sprinzl, M. & Schmid,
R.D. (1995) Crystal structure of NADH oxidase from Thermus
thermophilus. Nat. Struct. Biol. 2, 1109–1114.
11. Lovering, A.L., Hyde, E.I., Searle, P.F. & White, S.A. (2001) The
structure of Escherichia coli nitroreductase complexed with nico-
tinic acid: three crystal forms at 1.7 A
˚
, 1.8 A
˚
and 2.4 A
˚
resolution.
J. Mol. Biol. 309, 203–213.
12. Haynes, C.A., Koder, R.L., Miller, A F. & Rodgers, D.W. (2002)
Structures of nitroreductase in three states: effects of inhibitor
binding and reduction. J. Biol. Chem. 227, 11513–11520.
13. Gerstein, M., Lesk, A.M. & Clothia, C. (1994) Structural
mechanisms for domain movements in proteins. Biochemistry 33,
6739–6743.
14. Park, H.J., Kreutzer, R., Reiser, C.O.A. & Sprinzl, M. (1992)
Molecular cloning and nucleotide sequence of the gene encoding a
H
2
O
2
-forming NADH oxidase from the extreme thermophilic
Thermus thermophilus HB8 and its expression in Escherichia coli.
Eur. J. Biochem. 205, 875–879.
15.Park,H.J.,Reiser,C.O.A.,Kondruweit,S.,Erdmann,H.,
Schmid, R.D. & Sprinzl, M. (1992) Purification and character-
ization of a NADH oxidase from the thermophile Thermus
thermophilus HB8. Eur. J. Biochem. 205, 881–885.
16. Laemmli, U.K. (1970) Cleavage of structural proteins during
the assembly of the head of bacteriophage T4. Nature 227, 680–
685.
17. Pace, C.N., Vajdos, F., Fee, L., Grimsley, G. & Gray, T. (1995)
How to measure and predict the molar absorption coefficient of a
protein. Protein Sci. 4, 2411–2423.
18. Schmidt, H L., Sto
¨
cklein, W., Danzer, J., Kirch, P. &
Limbach, B. (1986) Isolation and properties of H
2
O-forming
NADH oxidase from Streptococcus faecalis. Eur. J. Biochem. 156,
149–155.
19. Cornish-Bowden, A. (2002) Enthalpy-entropy compensation: a
phantom phenomenon. J. Biosci. 27, 121–126.
20. Parker, C.A. & Reeses, W.T. (1960) Correction of fluorescence
spectra and measurement of fluorescence quantum efficiency.
Analyst (London) 85, 587–600.
21. Yengo, C.M., Fagnant, L., Chrin, L., Rovner, A.S. & Berger, C.L.
(1998) Smooth muscle myosin mutants containing a single
tryptophan reveal molecular interactions at the actin–binding
interface. Proc.NatlAcad.Sci.USA95, 12944–12949.
22. Valeur, B. & Weber, G. (1977) Resolution of the fluorescence
excitation spectrum of indole into the 1La and 1Lb excitation
bands. Photochem. Photobiol. 25, 441–444.
23. Chang, W.I. & Matthews, K.S. (1995) Role of Asp274 in lac
repressor: diminished sugar binding and altered conformational
effects in mutants. Biochemistry 34, 9227–9234.
24. Lakowicz, J.R. (2000) Principles of Fluorescence Spectroscopy, 2nd
edn. Plenum Press, New York.
25. Lehrer, S.S.(1971) Solute perturbation of protein fluorescence. The
quenching of the tryptophanyl fluorescence of model compounds
and of lysozyme by iodide ion. Biochemistry 10, 3254–3263.
26. Burstein, E.A., Vedenkina, N.S. & Ivkova, M.N. (1973) Fluores-
cence and the location of tryptophan residues in protein molecules.
Photochem. Photobiol. 18, 263–279.
27. Elodi, P. & Lakatos, S. (1973) The anomalous absorption of
tryptophan. Eur. J.Biochem. 36, 45–52.
28. Truhlar, G.D. & Kohen, A. (2001) Convex Arrhenius plots and
their interpretation. Proc.NatlAcad.Sci.USA98, 848–851.
29. Eftink, M.R. & Ghiron, C.A. (1981) Fluorescence quenching
studies with proteins. Anal. Biochem. 114, 199–227.
30. Thomas, T.M. & Scopes, R.K. (1998) The effects of temperature
on the kinetics and stability of mesophilic and thermophilic
3-phosphoglycerate kinases. Biochem. J. 330, 1087–1095.
31. Parkinson, G.N., Skelly, J.V. & Neidle, S. (2000) Crystal structure
of FMN-dependent nitroreductase from Escherichia coli B: a
prodrug-activating enzyme. J. Med. Chem. 43, 3624–3631.
32. Wolosiuk, R.A. & Stein, M. (1990) Modulation of spinach
chloroplast NADP-glyceraldehyde-3-phosphate dehydrogenase
by chaotropic anions. Arch. Biochem. Biophys. 279, 70–77.
33. Fan, Y X., Ju, M., Zhou, J M. & Tsou, C L. (1996) Activation
of chicken liver dihydrofolate reductase by urea and guanidine
hydrochloride is accompanied by conformational change at the
active site. Biochem. J. 315, 97–102.
34. Narayanasami, R., Nishimura, J.S., McMillan, K., Roman, L.J.,
Shea, T.M., Robida, A.M., Horowitz, P.M. & Masters, B.S.S.
(1997) The influence of chaotropic reagents on neuronal nitric
oxide synthase and its flavoprotein module. Urea and guanidine
hydrochloride stimulate NADPH-cytochrome c reductase activity
of both proteins. Nitric Oxide 1, 39–49.
35. Zhang, H J., Sheng, X R., Pan, X M. & Zhou, J M. (1997)
Activation of adenylate kinase by denaturants is due to the
increasing conformational flexibility at its active sites. Biochem.
Biophys. Res. Commun. 238, 382–386.
36. Das, M. & Dasgupta, D. (1998) Enhancement of transcriptional
activity of T7 RNA polymerase by guanidine hydrochloride.
FEBS Lett. 427, 337–340.
37. Deshpande, R.A., Kumar, A.R., Khan, M.I. & Shankar, V. (2001)
Ribonuclease Rs from Rhizopus stolonifer: lowering of optimum
temperature in the presence of urea. Biochim. Biophys. Acta 1545,
13–19.
38. Inui, T., Ohkubo, T., Urade, Y. & Hayaishi, O. (1999) Enhance-
ment of lipocalin-type prostaglandin D synthase enzyme activity
by guanidine hydrochloride. Biochem. Biophys. Res. Commun.
266, 641–646.
39. Kujo, C. & Oshima, T. (1998) Enzymological characteristics of the
hyperthermostable NAD-dependent glutamate dehydrogenase
from the archaeon Pyrobaculum islandicum and effects of dena-
turants and organic solvents. Appl. Envir. Microbiol. 64, 2152–
2157.
40. Jaenicke, R. & Bo
¨
hm, G. (2001) Thermostability of proteins from
Thermotoga maritima. Methods Enzymol. 334, 438–469.
4896 G. Z
ˇ
olda
´
k et al.(Eur. J. Biochem. 270) Ó FEBS 2003
41. Daniel, R.M., Cowan, D.A., Morgan, H.W. & Curran, M.P.
(1982) A correlation between protein thermostability and
resistance to proteolysis. Biochem. J. 207, 641–644.
42. Tsai, A.M., Udovic, T.J. & Neumann, D.A. (2001) The inverse
relationship between protein dynamics and thermal stability.
Biophys. J. 81, 2339–2343.
43. Cannon, W.R., Singleton, S.F. & Benkovic, S.J. (1996) A
perspective on biological catalysis. Nat. Struct. Biol. 3, 821–832.
44. Alper, K.O., Singla, M., Stone, J.L. & Bagdassarian, C.K. (2001)
Correlated conformational fluctuations during enzymatic cata-
lysis: Implications for catalytic rate enhancement. Protein Sci. 10,
1319–1330.
45. Hernandez, G., Jenney, F.E.J., Adams, M.W. & Le Master, D.M.
(2000) Millisecond time scale conformational flexibility in a
hyperthermophile protein at ambient temperature. Proc. Natl
Acad. Sci. USA 97, 3166–3170.
46. Dewey, T.G. & Turner, D.H. (1979) Laser temperature-jump
study of stacking in adenylic acid polymers. Biochemistry 18,
5757–5762.
47. Hammes, G.G. (2002) Multiple conformational changes in
enzyme catalysis. Biochemistry 41, 8221–8228.
48. Lumry, R. & Rajender, S. (1970) Enthalpy-entropy com-
pensation phenomena in water solutions of proteins and small
molecules: a ubiquitous property of water. Biopolymers 9, 1125–
1227.
49. Sharp, K. (2001) Entropy-enthalpy compensation: fact or artefact?
Protein Sci. 10, 661–667.
50. Wolfenden,R.&Snider,M.J.(2001)The depth of chemical time and
the power of enzymes as catalysts. Acc. Chem. Res. 34, 938–945.
51. Sitnitsky, A.E. (1994) Conformational dynamics of protein side
chains and enzyme–substrate interaction. J. Biomol. Struct. Dyn.
12, 475–486.
52. Hubbard, P.A., Shen, A.L., Paschke, R., Kasper, C.B. & Kim,
J J.P. (2001) NADPH-cytochrome P450 oxidoreductase. Struc-
tural basis for hydride and electron transfer. J. Biol. Chem. 276,
29163–29170.
53. Koike, H., Sasaki, H., Kobori, T., Zenno, S., Saigo, K., Murphy,
M.E.P., Adman, E.T. & Tanokura, M. (1998) 1.8 A
˚
crystal
structure of the major NAD(P)H: FMN oxidoreductase of a
bioluminescent bacterium, Vibrio fischeri: overall structure,
cofactor and substrate-analog binding, and comparison with
related flavoproteins. J. Mol. Biol. 280, 259–273.
54. Zheng, Y., Dong, J., Palfey, B.A. & Carey, P.R. (1999) Using
Raman spectroscopy to monitor the solvent-exposed and ÔburiedÕ
forms of flavin in p-hydroxybenzoate hydroxylase. Biochemistry
38, 16727–16732.
Ó FEBS 2003 Flexibility of the NADH oxidase active site (Eur. J. Biochem. 270) 4897