Báo cáo khoa học: Mitochondrial biogenesis in mtDNA-depleted cells involves a Ca2+-dependent pathway and a reduced mitochondrial protein import pdf
Bạn đang xem bản rút gọn của tài liệu. Xem và tải ngay bản đầy đủ của tài liệu tại đây (827.54 KB, 25 trang )
Mitochondrial biogenesis in mtDNA-depleted cells involves
aCa
2+
-dependent pathway and a reduced mitochondrial
protein import
Ludovic Mercy, Aure
´
lia de Pauw, Laetitia Payen, Silvia Tejerina, Andre
´
e Houbion,
Catherine Demazy, Martine Raes, Patricia Renard and Thierry Arnould
Laboratory of Biochemistry and Cellular Biology, University of Namur (FUNDP), Namur, Belgium
Keywords
biogenesis; calcium ⁄ CaMKIV; gene
expression; mitochondrial dysfunction;
protein import
Correspondence
T. Arnould, Laboratory of Biochemistry and
Cellular Biology, University of Namur
(F.U.N.D.P.), 61 rue de Bruxelles,
5000 Namur, Belgium
Fax: +32 81 724135
Tel: +32 81 724321
E-mail:
(Received 31 May 2005, revised 3 August
2005, accepted 11 August 2005)
doi:10.1111/j.1742-4658.2005.04913.x
Alterations in mitochondrial activity resulting from defects in mitochond-
rial DNA (mtDNA) can modulate the biogenesis of mitochondria by mech-
anisms that are still poorly understood. In order to study mitochondrial
biogenesis in cells with impaired mitochondrial activity, we used rho-L929
and rho
0
143 B cells (partially and totally depleted of mtDNA, respectively),
that maintain and even up-regulate mitochondrial population, to character-
ize the activity of major transcriptional regulators (Sp1, YY1, MEF2,
PPARgamma, NRF-1, NRF-2, CREB and PGC-1 a) known to control the
expression of numerous nuclear genes encoding mitochondrial proteins.
Among these regulators, cyclic AMP-responsive element binding protein
(CREB) activity was the only one to be increased in mtDNA-depleted cells.
CREB activation mediated by a calcium-dependent pathway in these cells
also regulates the expression of cytochrome c and the abundance of mito-
chondrial population as both are decreased in mtDNA-depleted cells that
over-express CREB dominant negative mutants. Mitochondrial biogenesis
in mtDNA-depleted cells is also dependent on intracellular calcium as its
chelation reduces mitochondrial mass. Despite a slight increase in mito-
chondrial mass in mtDNA-depleted cells, the mitochondrial protein import
activity was reduced as shown by a decrease in the import of radiolabeled
matrix-targeted recombinant proteins into isolated mitochondria and by
the reduced mitochondrial localization of ectopically expressed HA-apo-
aequorin targeted to the mitochondria. Decrease in ATP content, in mito-
chondrial membrane potential as well as reduction in mitochondrial Tim44
abundance could explain the lower mitochondrial protein import in
mtDNA-depleted cells. Taken together, these results suggest that mito-
chondrial biogenesis is stimulated in mtDNA-depleted cells and involves a
calcium-CREB signalling pathway but is associated with a reduced mito-
chondrial import for matrix proteins.
Abbreviations
ANT2, adenine nucleotide translocase isoform 2; ATF2, activating transcription factor 2; b-ATPase, beta subunit of Fo-F1-ATPase; CaMKIV,
calmodulin-dependent kinase IV; COX I, II, IV and VIII, cytochrome c oxidase subunit I, II, IV and VIII; CPT-1, carnitine palmitoyl transferase-1;
CREB, cAMP-responsive element binding protein; cyt c, cytochrome c; DHFR, dihydrofolate reductase; FCCP, carbonyl cyanide
p-trifluoromethoxyphenylhydrazone; HA, hemaglutinin; mtDNA, mitochondrial DNA; MEF2, myocyte enhancer factor 2; mtTFA ⁄ Tfam,
mitochondrial transcription factor A; NAO, nonyl acridine orange; NFAT, nuclear factor of activated T cells; NFjB, nuclear factor kappaB;
NRF-1 and 2, nuclear respiratory factor-1 and 2; OXPHOS, oxidative phosphorylation; PGC-1a and b, PPARc coactivator-1 a and b; PPARc,
peroxisome proliferator-activated TATA-box receptor c; PRC, PGC-1a-related coactivator; R123, rhodamine 123; ROS, reactive oxygen
species; Sp1, specificity protein 1; TBP, TATA-binding protein; TNFa, tumor necrosis factor a; TIM, translocase of inner membrane; TOM,
translocase of outer membrane; USF-2, upstream stimulatory factor-2; YY1, ying-yang 1; Dwm, mitochondrial membrane protential.
FEBS Journal 272 (2005) 5031–5055 ª 2005 FEBS 5031
Mitochondria play crucial functions in health and
diseases and many mitochondrial disorders, that
mainly affect tissues with high energy demands,
result from mutations or deletions in the mitochond-
rial genome that impair the synthesis of one or more
of the mitochondrial encoded respiratory protein
leading to a decrease in oxidative phosphorylation
(OXPHOS) capacity [1–3]. Mitochondrial prolifer-
ation and increase in the expression of respiratory
proteins are a common manifestations found in
patients with mitochondrial myopathies or mtDNA
depletion that is responsible for the so-called ‘ragged-
red fibers’ phenotype of skeletal muscle [4]. In
addition, several studies have now shown that mito-
chondrial dysfunction leads to the stimulation of
mitochondrial biogenesis. For example, muscle from
mouse with myopathy and hypertrophic cardiomyo-
pathy resulting from the targeted inactivation of the
gene encoding the heart muscle isoform of the aden-
ine nucleotide translocator (ANT 1) display abnormal
proliferation of mitochondria [5]. In a conditional
knockout mice for mitochondrial transcription factor
A (Tfam), a transcription factor involved in the
regulation of the mitochondrial genome replication
and transcription [6], leading to mtDNA-depletion
and prolonged respiratory chain deficiency, Hansson
et al. recently reported that the mitochondrial mass
increases in respiratory chain deficient embryos and
differentiated mouse tissues [7].
If each mammalian cell contains several hundreds
to more than a thousand mitochondria, it is thus
now clear that the size, shape, and abundance of
mitochondria vary dramatically in different cell types
and may change under different energy demand [8].
The abundance of mitochondria in a cell is deter-
mined by division and ⁄ or biogenesis of the organelle
[9] that can be defined as a complex biological pro-
cess requiring the synthesis of phospholipids and
cooperative interactions between proteins encoded by
both the nuclear and mitochondrial genes [10,11], the
mitochondrial protein import and their assembly [3].
However, mechanisms leading to mitochondrial bio-
genesis in cells deficient for mitochondrial activity
are still poorly understood.
As the protein-coding capacity of mammalian
mtDNA is limited to 13 respiratory subunits that are
necessary for mitochondrial function and integrity,
more than 95% of the genes necessary for mito-
chondrial biogenesis are encoded in the nucleus and
their expression is regulated by the activation of a
small set of specific transcription factors and signal-
ling pathways [9,12,13]. The first class of nuclear
transcriptional regulators involved in the biogenesis
of the organelle includes specific DNA-binding tran-
scription factors such as nuclear respiratory factors 1
and 2 (NRF-1 and NRF-2) that act on the genes
coding for constituent subunits of the OXPHOS sys-
tem and mtDNA replication [14–17]. Other factors
such as CREB (cyclic-AMP responsive element-bind-
ing protein) [18], PPARc (peroxisome proliferator
activated receptor gamma) [19,20],or the muscle-spe-
cific transcription factor MEF2 (myocyte enhancer
factor 2) [21,22] and general factors such as YY-1
(ying yang 1) [23], USF-2 (upstream stimulatory fac-
tor-2) [24], and Sp1 (specificity protein 1) [25] have
been described to act as activators or repressors of
nuclear genes encoding mitochondrial proteins and
more particularly proteins involved in the OXPHOS
complexes. A second class of regulators contains
coactivators that are unable to bind DNA such as
PGC-1a (peroxisome proliferator activated receptor
gamma coactivator-1alpha) and related family mem-
bers (PRC and PGC-1b) [26]. These proteins can
interact with DNA-bound transcription factors in
order to coordinate their action in the expression of
genes essential for cellular energetics and mitochond-
rial biogenesis [27] as recently shown in exercise-
induced skeletal muscle adaptation [28].
Numerous signalling pathways have been reported to
act upstream of these transcriptional regulators involved
in mitochondrial biogenesis by stimulating the expres-
sion of nuclear genes encoding respiratory proteins.
Firstly, reactive oxygen species (ROS) have been des-
cribed to promote expression of cytochromes c
1
and b
through a H
2
O
2
-dependent signalling in human cells
that respond to defective respiratory function [29].
Moreover, a treatment of human MRC-5 lung cells with
antimycin A that elevated the intracellular ROS produc-
tion induced an increase in the mitochondrial mass in
the cells [30]. ROS have also been reported to enhance
the expression of nuclear genes involved in mitochon-
drial biogenesis such as NRF-1 and Tfam in rho
0
HeLa
S3 cells [31]. Secondly, a nitric oxide (NO)-cGMP-
dependent pathway has been reported to control mit-
ochondrial biogenesis in several mammalian cell types
[32]. On the other hand, many links do exist between a
high cytosolic calcium concentration and the increase in
mitochondrial biogenesis as a treatment of muscle cells
with A23187 (a calcium ionophore) triggers the expres-
sion of cyt c in a PKC-dependent manner [33]. Ojuka
et al. also demonstrated that intermittent increases in
cytosolic calcium stimulate mitochondrial biogenesis in
muscle cells and suggested that calcium is the mediator
responsible for the increase in mitochondrial population
in response to exercise [34,35]. Furthermore, mitochond-
rial dysfunction and calcium homeostasis are closely
Mitochondrial biogenesis in mtDNA-depleted cells L. Mercy et al.
5032 FEBS Journal 272 (2005) 5031–5055 ª 2005 FEBS
interdependent in cell signalling and cell death [36].
Indeed, it was observed that depletion of mtDNA below
a certain level as well as treatment of mammalian cells
with respiratory inhibitors increased steady-state levels
of cytosolic calcium that may change activities of several
Ca
2+
-dependent transcription factors such as CREB
[37], nuclear factor of activated T-cells (NFAT), activa-
ting transcription factor 2 (ATF2) and nuclear factor
kappa B (NFjB) that increase OXPHOS gene expres-
sion including subunit Vb of cytochrome c oxidase
(COXVb) and thus stimulate mitochondrial biogenesis
[38]. A role of calcium and calmodulin-dependent kinas-
es (CaMKs) in the control of mitochondrial biogenesis
has also been demonstrated in skeletal muscle of trans-
genic mice that over-express a muscle-specific constitu-
tively active form of CaMKIV [39], a kinase we
previously found to be activated in L929 and 143B
mtDNA-depleted cells and responsible for CREB
activation [37].
During the mitochondrial biogenesis process, the
majority of the thousand or more mitochondrial pro-
teins are required to be imported from nuclear-enco-
ded cytosolically synthesized precursors. The import of
these proteins is achieved by different mechanisms
known to operate during the import of the two major
classes of mitochondrial proteins such as the hydro-
philic proteins with cleavable presequences and hydro-
phobic proteins with multiple internal signals [40]. The
mitochondrial protein import involves an important
group of proteins including translocase of the outer
membrane (TOM) such as Tom40, Tom20, Tom70
and translocase of the inner membrane (TIM) such as
Tim22 and Tim23 family members [40] as well as
numerous chaperones such as Hsp70 [41] forming
effectors, adaptors and receptors of the mitochondrial
protein import machinery. Several reports mentioned
the significance of the protein import in the rate of
mitochondrial protein import as several stimuli, inclu-
ding contractile activity of skeletal muscle, thyroid
hormone treatment, and muscle differentiation can
alter the expression of the import proteins that ulti-
mately lead to a change in protein import rate and
mitochondrial phenotype [42–46].
Numerous mtDNA-depleted cell lines have been
generated by long-term treatment with ethidium bro-
mide [47,48] or DNA polymerase-c inactivation [49]
to study important mitochondrial defects in
OXPHOS, calcium homeostasis alteration, ROS pro-
duction and more recently resistance to apoptosis
[37,38,50]. It is also interesting to emphasize that
mtDNA-depleted cells maintain their ability to gener-
ate mitochondria-like structure and a mitochondrial
membrane potential (Dwm) [51–53]. Thus, even if the
mechanisms involved in the mitochondrial biogenesis
of mtDNA-depleted cells are poorly understood, it is
now more evident that mtDNA is not essential for
the biogenesis of mitochondrial-like structure in pro-
liferating cells.
In this study, to address the question of mitochond-
rial biogenesis in cells depleted of mtDNA, we used
rho-L929 and rho
0
143 B cells (partially and totally
depleted of mtDNA, respectively) to evaluate the ret-
rograde signalling that controls the expression of
nuclear genes encoding mitochondrial proteins and
the activity of mitochondrial matrix-tageted protein
import. We first showed that cells depleted of mtDNA
not only maintain but up-regulate the biogenesis of
mitochondria, as the mitochondrial staining with spe-
cific fluroescent dyes and the expression of cyt c are
both increased in these cells. We next studied the
activity status of several key transcriptional regulators
known to control the biogenesis of mitochondria such
as NRF-1 ⁄ 2, PPARc, MEF2, CREB, Sp1 and YY-1,
as well as the abundance of the coactivator PGC1a
and found that CREB is the only overactivated factor
in mtDNA-depleted cells. We also showed that CREB
regulates cyt c expression and could play a role in
mitochondrial biogenesis in mtDNA-depleted cells as
the over-expression of dominant negative mutants
(K1-CREB and M1-CREB) decreases both cyt c
expression and nonyl acridine orange (NAO) accumu-
lation used to monitor mitochondrial mass in cells.
The dependence of mitochondrial biogenesis on intra-
cellular calcium in mtDNA-depleted cells was also evi-
denced as chelation of intracellular calcium reduces
the abundance of mitochondrial population. However,
despite a slight increase in mitochondrial population
and cyt c abundance in mtDNA-depleted cells, the
mitochondrial import activity for matrix proteins is
reduced in these cells as we observed a decrease in the
import of radiolabeled matrix-targeted recombinant
proteins into isolated mitochondria and a lower
mitochondrial localization of ectopically expressed
HA-apoaequorin addressed to the mitochondria. We
also clearly showed that lower mitochondrial import
for matrix proteins in mtDNA-depleted cells is associ-
ated with a decrease in ATP content, in mitochondrial
membrane potential as well as with a reduction in mit-
ochondrial Tim44 abundance, an important effector
of mitochondrial import apparatus. Taken together,
these results suggest that mitochondrial biogenesis
leading to the accumulation of ‘abnormal’ mitochon-
dria in mtDNA-depleted cells could be mediated, at
least partly, by a calcium-CREB signalling pathway
but is associated with a reduced mitochondrial import
for matrix proteins.
L. Mercy et al. Mitochondrial biogenesis in mtDNA-depleted cells
FEBS Journal 272 (2005) 5031–5055 ª 2005 FEBS 5033
Results
Maintenance of mitochondrial structure
in mtDNA-depleted cell lines
Rho-L929 cells [54] as well as rho
0
143B cells were pre-
viously characterized by our group for mtDNA-deple-
tion and impaired mitochondrial function [37,51]. To
compare mtDNA-depletion in rho-L929 and rho
0
143B
cells used in this study, COXI expression was deter-
mined by western blot analysis in parental and
mtDNA-depleted cells (Fig. 1A). As expected, this
mtDNA-encoded subunit of cytochrome c oxidase is
not expressed in rho
0
143B and its expression is barely
detectable in rho-L929 cells. To investigate whether or
not mtDNA depletion leads to modifications in mito-
chondrial content, the abundance and the morphology
of mitochondria were compared in rho-L929 and L929
cells using transmission electron microscopy (TEM)
(Fig. 1B). In rho-929 cells, the morphology of mito-
chondria is clearly different as they appear rounder,
swollen and less dense to electrons as already reported
for several other mtDNA-depleted cell lines [53,55].
When mitochondrial population abundance was
assessed with Mitotracker Red, a specific mitochond-
rial fluorescent probe used for mitochondrial mass
detection [56,57], we found a punctuated pattern of
staining that is compatible with a mitochondrial reten-
tion and localization of the fluorescent probe in both
mtDNA-depleted and parental cells (Fig. 1C). Quanti-
tative analysis of Mitotracker Red accumulation using
spectrofluorimetry also revealed that staining is
dependent on loading time and suggests a slight
increase in rho-L929 cells when assessed after 30 min
in the presence of the dye (supplementary Fig. S1).
Similar results were also found for rho
0
143B cells
stained with Mitotracker Red or NAO, a lipophilic
cation that has a high affinity for mitochondrial cardi-
olipin rich membranes [58] (Figure 7A). We are aware
that in several cell types NAO staining has been des-
cribed recently to be also dependent on the mitochond-
rial membrane potential [59]. As the NAO staining is
not reduced, and is even slightly increased in mtDNA-
depleted cells while the mitochondrial membrane
potential is lower in these cells [51,52], these data sug-
gest a higher mitochondrial mass in mtDNA-depleted
cells. This statement is also supported by the analysis
of mitochondrial population abundance perfomed by
the quantification of the cell area occupied by mito-
chondria on transmission electron microscopy (TEM)
micrographs from L929 and rho-L929 cells. Indeed,
using the nih image software free online (http://rsb.
info.nih.gov/nih-image/Default.html) we analysed three
section images (10.7 square inches; magnification
15 600·) taken from random observations and found
that the surface corresponding to mitochondria repre-
sents 11.2 ± 2.3% and 18.8* ± 2.5% (*P < 0.05) for
L929 and rho-L929 cells, respectively.
A
B
C
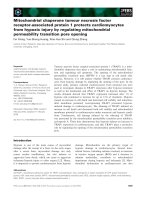
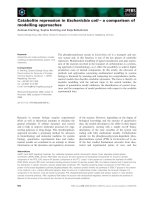
Fig. 1. Mitochondrial structures are still observed in mtDNA-deple-
ted cells that do not express mitochondrial-encoded markers. (A)
Western blotting analysis of COXI subunit expression in 143B,
rho
0
143B, L929 and rho-L929 cells. Equal loading was determined
by the immunodetection of TBP. (B) Electron micrographs of rho-
L929 and parental L929 cells showing the presence of rounder
shaped mitochondria (arrows) (magnification: 25 200 X). (C) Staining
for mitochondrial population with Mitotracker Red in L929, rho-
L929, 143B and rho
0
143B incubated with 250 nM of the cationic
dye for 30 min and processed for confocal microscopy observation.
Scale bars ¼ 10 lm and arrows indicate punctuated mitochondrial
staining.
Mitochondrial biogenesis in mtDNA-depleted cells L. Mercy et al.
5034 FEBS Journal 272 (2005) 5031–5055 ª 2005 FEBS
These data show that the abundance of mitochond-
rial population in cells without mtDNA is maintained
and even slightly increased when compared to parental
cells.
Effect of mtDNA depletion on some
mitochondrial markers
As mitochondrial biogenesis is dependent on the expres-
sion of numerous nuclear-encoded genes, we next deter-
mined the expression level of several key mitochondrial
markers that cover energetic pathway or mitochondrial
protein import machinery such as the b-subunit of the
Fo-F1-ATPase (b-ATPase), the adenine nucleotide
translocator isoform 2 (ANT2), COXVb or Tom40
and Tim44. The relative mRNA abundance of
b-ATPase, COXVb and Tim44, determined by real-
time PCR, is significantly up-regulated (> twofold
increase) in rho
0
143B cells compared to parental cells
(Fig. 2A). However, we found that some of these
genes might be variously expressed at the protein level
when assessed on cleared cell lysates. Indeed, the
Fo-F1-ATPase b-subunit is similarly expressed in both
143B and rho
0
143B cells (Fig. 2B), a data in agreement
with a previous report showing that the expression of
b-ATPase is unchanged in rho
0
HeLa S3 and rho
0
143B
[52]. The reason for this discrepancy between mRNA
and protein abundance is unknown but could involve
a post-transcriptional regulation as it has been pro-
posed before for the over-expression of Tfam and
NRF-1 at the transcriptional level that was not reflec-
ted at the protein level in mtDNA-depleted cells
[31,60]. However, this regulation might also be rela-
tively specific as Tim44 was found to be over-expressed
at the protein level in rho
0
143 B cells, a data in
accordance with the increase in the messenger RNA
for this marker (Fig. 2A).
To discriminate between a transcriptional regulation
and mRNA stabilization in the accumulation of these
transcripts, we next transfected cells with plasmids
encoding chloramphenicol acetyl transferase (CAT)
reporter gene driven by the authentic promoter of the
cyt c or the b-ATPase gene (Fig. 2C). CAT activity was
significantly up-regulated (respectively three and sixfold
increase) in rho
0
143B, a result that is consistent with a
positive transactivation of these genes. In order to
make sure that the activation of the cyt c promoter is
really the result of a mitochondrial inhibition and not a
consequence of an indirect long-term cell adjustment
to mtDNA depletion, we tested the effect of mito-
chondrial metabolic inhibitors on the promoter activity.
143B cells were first transiently transfected with the cyt
c-CAT plasmid and then incubated for 24 h with 1 lm
antimycin A (a complex III inhibitor) or 10 lm
carbonyl cyanide p-trifluoromethoxyphenylhydrazone
(FCCP), a mitochondrial uncoupler that both impair
the OXPHOS. We found that cyt c promoter was also
activated in response to both treatments (Fig. 2D).
These results show that mitochondrial activity impair-
ment per se is responsible for the up-regulation of cyt c
gene expression and several other mitochondrial
markers while ANT2 does not seem to be over-
expressed in mtDNA-depleted cells (Fig. 2C).
As cyt c is a common marker used to characterize
mitochondrial biogenesis [32] and in order to directly
address both the expression and the distribution of the
protein, the endogenous expression of cyt c was first
analysed by western blotting performed on proteins
extracted from enriched-mitochondrial fractions of
mtDNA-depleted cell lines (Fig. 3A). The protein is
more abundant (two- to threefold increase) in the
mitochondria of both mtDNA-depleted cell lines sug-
gesting that not only the protein is over-expressed but
is also imported into mitochondria. These data have
been confirmed by immunostaining of cyt c in the
different cell lines (Fig. 3B). Quantification of fluores-
cence signals in cell sections indicates both over-expres-
sion and a wider distribution of the protein in
mtDNA-depleted cells (Fig. 3C). Taken together, these
data strongly suggest an over-expression of cyt c that
might be associated with a more abundant mitochond-
rial population in mtDNA-depleted cells. The role and
the functional significance of cyt c over-expression in
mitochondria of mtDNA-depleted cells is an intriguing
observation that should be addressed in the future.
The regulation of mitochondrial marker expression
in mtDNA-depleted cells is a process that might
involve the activation of transcription factors described
to control the biogenesis of mitochondria.
Reduced expression and activity of NRF-1, NRF-2
and Tfam in mtDNA-depleted cells
It has been reported previously that mtDNA-depleted
HeLa cells display increased mRNA levels of NRF-1
and Tfam genes [61]. We thus evaluated NRF-1 and
NRF-2, two major transcription factors that control
the expression of several nuclear genes encoding mito-
chondrial proteins [6,14,62] and Tfam expression
[60,63,64]. Interestingly, while NRF-1 expression is
only slightly reduced in both mtDNA-depleted cells
(10–20%), NRF-2 expression is strongly decreased in
rho
0
143B and rho-L929 cells by 60 and 80%, respect-
ively (Fig. 4A). As both factors have been implicated
in the control of Tfam expression [6] which is known
to regulate mtDNA transcription and replication [65],
L. Mercy et al. Mitochondrial biogenesis in mtDNA-depleted cells
FEBS Journal 272 (2005) 5031–5055 ª 2005 FEBS 5035
we thus monitored the expression of Tfam in the
murine cell line [66] and show that this factor is down-
regulated in rho-L929 cells (Fig. 4B). These results are
in agreement with data obtained in rho-C2C12 cells
[60] and suggest that the activity of NRFs is decreased
in mtDNA-depleted cells. To test this hypothesis, cells
A
C
D
B
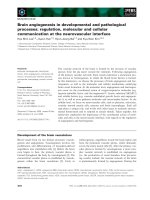
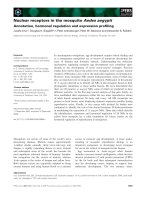
Fig. 2. Expression of mitochondrial markers in mtDNA-depleted cells. (A) Total RNA was isolated from 143B (white) and rho
0
143B cells
(black) before the relative amount of transcript encoding the b-subunit of the Fo-F1-ATPase, Tim44 and COXVb was determined by real-time
PCR using SYBR green staining and normalized for TBP (TATA-box binding protein) used as a reference gene. Results are expressed as rela-
tive mRNA abundance compared to control 143B cells and represent means ± 1 SD. for 3 independent extractions. (B) Western blot analyses
of clear lysate proteins (35 lg) prepared from 143B and rho
0
143B cells using specific antibody to Tim44 and to the F1-ATPase b subunit.
Equal protein loading between lanes was determined by the immunodetection of a-tubulin. (C) Promoter activity of ANT2, cyt c and b subunit
of F1-ATPase determined by CAT activity in transiently cotransfected 143B (white) and rho
0
143B (black) cells with CAT reporter constructs
driven by the authentic promoter of these genes and a plasmid encoding b-galactosidase. CAT activity (cpm: count per minute) was deter-
mined 48 h post-transfection and normalized for b-galactosidase activity. Results are expressed in percentages of control cells (n ¼ 4)
(*,***): significantly different from control cells with, respectively, P < 0.05, and P < 0.001. (D) Effect of antimycin A and FCCP on the
promoter activity of cyt c determined by CAT activity. 143 B cells were transiently transfected with a CAT reporter construct driven by the
cyt c promoter and were incubated or not (control, CTL) for 6 h with 1 l
M antimycin A or 10 lM FCCP. CAT activity (cpm) was determined
48 h post-transfection and normalized for b-galactosidase activity. Results are expressed in percentages of control cells as means for n ¼ 2.
Mitochondrial biogenesis in mtDNA-depleted cells L. Mercy et al.
5036 FEBS Journal 272 (2005) 5031–5055 ª 2005 FEBS
were transiently transfected with luciferase reporter
constructs driven by a minimal TK promoter linked to
either four copies of the binding site for NRF-1 (4X
NRF-1) or the Tfam authentic promoter responsive to
NRF-1 [57]. Under these conditions, a dramatic and
highly significant decrease in luciferase activity was
obtained for both constructs in rho
0
143 B (Fig. 4C).
These results suggest that the transactivation mediated
by NRF-1 is reduced in mtDNA-depleted cells. As
NRF-1 DNA-binding and activity have been shown to
be positively regulated after phosphorylation by casein
kinase II [67], the activity of this enzyme was assessed
in vitro after immunoprecipitation of the kinase from
L929 and rho-L929. Results show an important
decrease in the activity of casein kinase II in mtDNA-
depleted cells (Fig. 4D). Furthermore, in human fibro-
blasts, ROS production has also been reported to
mediate a retrograde signalling pathway that can
enhance the expression of NRF-1 and Tfam mRNA in
rho
0
HeLa or antimycin A-treated cells [29,31]. ROS
production was thus determined in L929 and rho-L929
cells using the dichlorofluorescein (DCF) probe. In
these conditions, while antimycin A, used as a positive
control, triggers a significant increase in ROS produc-
tion in L929, we found that ROS generation was
reduced by almost 40% in rho-L929 cells (Fig. 4E) as
A
B
C
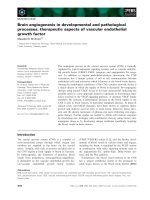
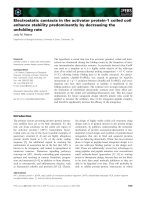
Fig. 3. Expression of cytochrome c protein
is enhanced in mtDNA-depleted cells. (A)
Western blot analysis of mitochondrial cyt c
(mtcyt c) abundance performed on proteins
extracted from mitochondrial-enriched frac-
tions of 143B, rho
0
143B, L929, and rho-
L929 cells. Equal protein loading between
mtDNA-depleted and corresponding parental
cell lines was determined by the immuno-
detection of the nuclear-encoded COXIV.
(B) Immunostaining of cyt c and confocal
microscopy analysis performed on para-
formaldehyde-fixed and Triton permeabilized
143B, rho
0
143B, L929 and rho-L929 cells.
(C) Analysis of fluorescence intensity per-
fomed on cell sections presented in B using
the
QUANTIFY software from Leica. Fluores-
cence intensity profiles are plotted from A
to B direction for the different cell lines.
L. Mercy et al. Mitochondrial biogenesis in mtDNA-depleted cells
FEBS Journal 272 (2005) 5031–5055 ª 2005 FEBS 5037
already reported for other cell lines depleted of
mtDNA [68,69]. These cells are also less-responsive to
an antimycin A treatment. Taken together, these
results support a lower expression and activity of
NRF-1 and Tfam in mtDNA-depleted cells.
Activity of YY1, Sp1, PPARc, MyoD, MEF2 and
CREB in mtDNA-depleted cells
Beside the crucial role of NRF-1 and NRF-2 in the
regulation of OXPHOS genes [15], the transcriptional
control of numerous nuclear genes encoding mito-
chondrial proteins also involves other transcription
factors such as YY1, Sp1, PPARc, MyoD, MEF2 and
CREB [13,70–74]. Using a sensitive colorimetric assay
system as previously described for NF-jB [75], we thus
measured the DNA-binding activity of these transcrip-
tion factors to specific synthetic DNA consensus
sequence in nuclear protein extracts prepared from
143B L (L929) and rho
0
143B cells (Fig. 5A) or from
L929 and rho-929 cells (Fig. 5B). The amount of Sp1,
PPARc and MyoD that binds to DNA is reduced in
both mtDNA-depleted cell lines while MEF2 DNA-
binding activity is unchanged in these cells. These
results suggest that a chronic inhibition of mitochond-
rial activity impairs the DNA-binding activity of
A
B
C
D
E
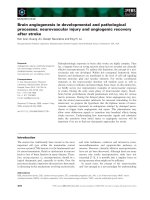
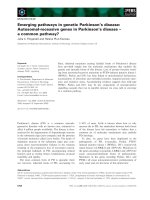
Fig. 4. Decrease in NRF-1, NRF-2 and Tfam expression in mtDNA-
depleted cells is associated with a reduction in casein kinase II
activity and a lower ROS production. (A) Western blot analysis of
NRF-1 and NRF-2 expression performed on 20 lg of proteins from
clear lysates of 143B, rho
0
143B, L929, and rho-L929 cells. Equal
loading between mtDNA-depleted and corresponding parental
cell line was determined by the immunodetection of a-tubulin.
(B) Western blot analysis of Tfam expression performed on 20 lg
of proteins from clear lysates of L929 and rho-L929 cells. Equal
loading between lanes was determined by the immunodetection of
a-tubulin. (C) mtDNA-depletion decreases the activity of a NRF-1-
responsive synthetic promoter as well as the activity of the authen-
tic Tfam promoter. 143B and rho
0
143 B cells were transiently
cotransfected with 0.25 l g of a CMV ⁄ b-gal expression plasmid and
0.5 lg of the 4X NRF-1-Luc construct or 0.5 lgoftheTfam promo-
ter-Luc construct. Luciferase activity was determined 24 h post-
transfection and normalized for b-galactosidase activity. Results are
expressed in percentages of control 143B cells as means ± 1 SD
for n ¼ 3 (**: significantly different from control cells with
P < 0.01). (D) Casein kinase II activity is reduced in rho-L929 cells.
The enzyme was immunoprecipitated from cleared lysates of L929
and rho
–
L929 cells. In vitro activity was then determined in the
presence of a synthetic peptide and [c-
32
P]ATP as described in the
‘experimental procedures’. Results represent the radioactivity asso-
ciated with the substrate and are expressed in cpm as means for
two samples. The amount of immunoprecipitated kinase in the dif-
ferent conditions is shown on the western blot below. (E) ROS pro-
duction is reduced in rho-L929 cells. Cells were incubated for
30 min at 37 °C with 5 l
M DCF and then incubated or not with
1 l
M antimycin A for 60 min. Cells were then lysed before cell-
associated fluorescence was measured with a spectrofluorimeter.
Results are expressed in arbitrary fluorescence units as means ±
S.D. for n ¼ 4. **, ***: significantly different from L929 cells as
determined by an
ANOVA I and Sheffe
´
’s contrasts with, respectively,
P <0.01andP < 0.001.
Mitochondrial biogenesis in mtDNA-depleted cells L. Mercy et al.
5038 FEBS Journal 272 (2005) 5031–5055 ª 2005 FEBS
several key transcription factors involved in the control
of genes encoding mitochondrial proteins.
In order to study the activity of YY1 and PPARc
further, cells were transiently transfected with con-
structs encoding a luciferase reporter gene driven by
promoters responsive to these factors (Fig. 5C). The
transcriptional activity of these factors was either
unchanged (YY1) or slightly decreased (PPARc)in
rho
0
143B cells. Using luciferase constructs that are specific
ally activated by Sp1 or NRF-2, we also observed a
decrease in the transcriptional activity of these factors
in both mtDNA-depleted cells (data not shown). On the
contrary, CREB, a transcription factor we previously
identified as specifically activated in cells with impaired
mitochondrial activity [37], is activated in rho
0
143B
cells as shown by a 2.5-fold increase in the luciferase
activity encoded by a reporter construct driven by the
a-inhibin promoter that contains several CRE sites [76].
Several of the nuclear transcription factors that con-
trol the expression of genes encoding mitochondrial
proteins are coordinated by PGC-1a, which induces
NRF-1 and NRF-2 expression and coactivates several
mitochondrial regulatory factors such as NRF-1,
MEF2 or PPARc [76a]. In skeletal muscle, it has been
shown that a p38 MAPK signalling stimulates PGC1 a
expression and promotes mitochondrial biogenesis [28].
Indeed, consequently to its activation, PGC1a causes
an increase in mRNA for several genes encoding mit-
ochondrial proteins such as cyt c, COXII and COXIV,
the b-ATPase, CPT-1 and uncoupling proteins (UCPs)
in a cell type-selective manner [19,57,77]. In both rho-
L929 and rho
0
143B cell lines, PGC1a expression is
decreased, as shown by a strong reduction of PGC-1a
promoter activity and protein abundance analysed by
western blotting and immunostaining (supplementary
Fig. S2).
Role of a CREB ⁄ CaMKIV pathway in the
mitochondrial biogenesis of mtDNA-depleted
cells
We showed previously that a CaMKIV-CREB signal-
ling pathway is specifically activated in cells with
impaired mitochondrial activity [37] and more recently
several studies reported the importance of this pathway
in the regulation of mitochondrial biogenesis in skel-
etal muscle [39,78]. To test the potential role of CREB
in the biogenesis of mitochondria in mtDNA-depleted
cells, we over-expressed K-CREB and M1-CREB, two
dominant negative mutants of CREB [79] and meas-
ured their effect on the CAT reporter gene driven by
the cyt c promoter, containing two functional CRE
sites [18]. While inhibition efficiency is rather different
for both dominant negative forms that could be
explained by either their different mechanism of action
or their respective level of expression, the over-expres-
sion of both dominant mutants significantly reduces
Fig. 5. Effect of mtDNA-depletion on Sp1, PPARc, MyoD and MEF2
DNA-binding activity and transactivation. Microwells containing the
DNA probes were incubated with 10 lg of nuclear proteins prepared
either (A) from 143B (white) and rho
0
143B (black) or (B) from L929
(white) and rho-L929 (black). After the colorimetric reaction, absorb-
ance was measured at 490 nm and the results were expressed in
percentages of corresponding controls as means ± 1 SD. for n ¼ 3.
(C) Effect of mtDNA-depletion on the transcriptional activity of YY1,
PPARc and CREB. 143B and rho
0
143B cells were transiently
transfected with 0.25 lg of a CMV ⁄ b-gal plasmid and 0.5 lgof
responsive luciferase constructs responsive to either YY1 (Msx2SS-
Luc), PPARc (3X-PPRE-TK-Luc) or CREB. Luciferase activity was
determined 24 h post-transfection and normalized for b-galacto-
sidase activity. Results are expressed as percentages of controls as
means ± 1 SD. for n ¼ 3. *, **, ***: significantly different from
corresponding controls as determined by an
ANOVA I and Sheffe
´
’s
contrasts with, respectively, P < 0.05, P < 0.01, and P < 0.001.
L. Mercy et al. Mitochondrial biogenesis in mtDNA-depleted cells
FEBS Journal 272 (2005) 5031–5055 ª 2005 FEBS 5039
the activity of cyt c promoter in rho
0
143B cells
(Fig. 6A). The over-expression of K-CREB and
M1-CREB also decreases the expression of endogenous
cyt c in rho-929 cells (Fig. 6B,C). Furthermore, the
over-expression of a CaMKIV dominant mutant
(CaMKIVT200A) [80] is also able to repress cyt c
expression in rho
–
L929 cells (Fig. 6B,C), suggesting
that a calcium ⁄ CaMKIV-CREB pathway might be
involved in the induction of cyt c expression in
mtDNA-depleted cells. As a single mitochondrial pro-
tein marker is not enough to characterize mitochond-
rial biogenesis, we next used NAO dye to monitor
total abundance of the mitochondrial population in
rho
0
143 B cells that over-express either K-CREB or
M1-CREB. After 48 h, we consistently found a reduc-
tion of about 15–20% in the NAO signal in these cells
(Fig. 7A), suggesting that global mitochondrial abun-
dance can be reduced by inhibiting CREB activity.
Taken together, these data suggest that the presence of
mitochondria in mtDNA-depleted cells could be
dependent on an active CaMKIV-CREB pathway. As
mtDNA-depletion causes a sustained increase in cyto-
solic calcium that activates cell signalling such as
CaMKIV-CREB or JNK pathway [37,38], and because
intermittent or sustained increase in cytosolic calcium
of skeletal muscle during exercise results in an increase
A
B
C
Fig. 6. Cytochrome c up-regulation is dependent on CREB in
mtDNA-depleted cells. (A) cyt c promoter activity in transiently
cotransfected 143B (white) and rho
0
143B (black) cells with plas-
mids encoding K-CREB, M1-CREB, a CREB-sensitive CAT reporter
construct driven by the cyt c promoter and an expression plasmid
encoding the b-galactosidase. CAT activity was determined in cell
lysates 48 h post-transfection. Substrate-associated radioactivity
(cpm) was normalized for b-galactosidase activity and results are
expressed in percentages of 143B control cells as means ± 1 SD.
for n ¼ 3 (***: significantly different from 143B control cells with
P < 0001; + and + + + : significantly different from rho
0
cells with,
respectively, P < 0.05 and P < 0.001). (B) Representative western
blot image of cyt c expression assessed in L929 and rho-L929 cells
transiently transfected with either plasmids encoding K-CREB,
M1-CREB, CaMKIV(T200A) or a pGL2 empty vector (L929 and
rho-L929 control cells). Equal loading was determined by the immu-
nodetection of a-tubulin. (C) Quantification of cyt c expression after
optical density determination of the different signals and normaliza-
tion by the abundance of a-tubulin. The mean value in L929 cells
was set as a reference for comparison and results are expressed in
fold-increase as means ± 1 SD. (n ¼ 3). *: significantly different
from L929 cells with P < 0.05.
Fig. 7. Mitochondrial mass is dependent on CREB and calcium in
mtDNA-depleted cells. (A) Spectrofluorimetric determination of
mitochondrial abundance measured by NAO accumulation in 143B
(white) and rho
0
143B (black) cells transiently transfected with a
plasmid encoding K-CREB or M1-CREB for 48 h or (B) in cells incu-
bated in the presence of BAPTA (10 l
M) for 72 h. Results are
expressed in arbitrary fluorescence unit normalized for protein con-
tent as means ± 1 SD for n ¼ 3 (A) or means for n ¼ 2(B).
Mitochondrial biogenesis in mtDNA-depleted cells L. Mercy et al.
5040 FEBS Journal 272 (2005) 5031–5055 ª 2005 FEBS
in mitochondria [34,35], we next incubated mtDNA-
depleted cells for 72 h with 10 lm BAPTA, an intra-
cellular calcium chelator, before the mitochondrial
abundance was assessed with NAO staining (Fig. 7B).
In these conditions, NAO fluorescence was reduced by
almost 40% in both mtDNA-depleted cell lines, sug-
gesting a decrease in mitochondrial population.
Mitochondrial protein import for matrix-targeted
proteins is reduced in mtDNA-depleted cells
As mitochondrial biogenesis in mtDNA-depleted cells
most likely requires mitochondrial protein import, we
next assessed this process by two different experimen-
tal approaches. We first adapted an in vitro assay,
that has been used mainly in yeast [81], to quantita-
tively determine the import of radiolabeled mito-
chondrial proteins targeted to the matrix in purified
mitochondria as visualized on the electron micrograph
of enriched mitochondrial fractions (Fig. 8A). Two
precursor fusion proteins targeted to the mitochond-
rial matrix, the subunit-9 of the ATPsynthase–
dihidrofolate reductase (DHFR) and a truncated form
of the cytochrome b2(b
2
(167)
D
-DHFR), have been
translated and radiolabeled with [
35
S]methionine in vitro
(Fig. 8B). The mitochondria-associated radioactivity
was then measured on mitochondrial fractions of 143B
and rho
0
143B cells treated with proteinase K after
the import assay. The global mitochondrial import
was reduced by 66% and 85%, respectively, for
Su9-ATPase-DHFR and b
2
(167)
D
-DHFR proteins
(Fig. 8C,D). We next wondered if the reduced global
mitochondrial import of matrix proteins in mtDNA-
depleted cells could be due to a decrease in the
b-barrel Tom40 core of the TOM complex, through
which the precursor proteins are passing before being
transferred to other mitochondrial compartments [82].
This is not likely the case as the amount of Tom40 in
purified mitochondria is comparable in rho
0
and
parental 143B (Fig. 8E) despite a strong increase in the
expression of Tom40 in both mtDNA-depleted cell
Fig. 8. The mitochondrial protein import is reduced in mitochondria
isolated from mtDNA-depleted cells. (A) Electron micrograph of an
enriched mitochondrial fraction prepared for the import assay and
illustrated for mitochondria purified from 143B cells analysed by
transmission electron microscopy. Scale bar: 100 nm. (B) Autoradi-
ography of the cytochrome b
2
and the ATPase subunit-9 chimeric
proteins translated and radiolabeled in vitro (10% of the output).
b2(167D)-DHFR consists of the first 167 amino acids of the cyto-
chrome b
2
precursor fused to the full-length mouse DHFR by a lin-
ker of two amino acids. The cytochrome b
2
presequence consists
of an amino-terminal matrix-targeting sequence (residues 1–31) and
a sorting sequence (residues 32–80). Su9-DHFR contains the first
66 amino acids of the subunit-9 of Neurospora crassa ATPase
fused to DHFR. (C,D) For the mitochondrial protein import assay,
isolated mitochondria (30 lg) from 143B and rho
0
143B cells were
incubated for 10 min at 25 °C with reticulocyte lysate containing
35
S-labelled Su9-DHFR (C) or b2(167D)-DHFR (D). The import assay
was then stopped by the addition of 1 l
M valinomycin. To remove
nonimported preproteins, all samples were treated with proteinase
K(40lgÆmL
)1
) for 15 min on ice. After mitochondria isolation, asso-
ciated radioactivity was counted. Results are presented as repre-
sentative data for three independent experiments and expressed in
c.p.m. as means ± 1 SD. (E) Western blotting analysis of b-ATPase,
Tom40 and Tim44 abundance performed on mitochondrial purified
fractions of 143B and rho
0
143B cells.
A
B
C
D
E
L. Mercy et al. Mitochondrial biogenesis in mtDNA-depleted cells
FEBS Journal 272 (2005) 5031–5055 ª 2005 FEBS 5041
lines as shown by western blot analysis of clear cell
lysates and immunostaining (supplementary Fig. S3).
In addition, western blot analysis of mitochondrial
fractions prepared from 143B and rho
0
143B cells
revealed that the abundance of b-ATPase and Tom40
is similar in both cell lines while Tim44, an important
effector of mitochondrial protein import that interacts
with mtHsp70 (mitochondrial heat-shock protein 70)
[41], could only be detected in parental cells (Fig. 8E).
While we cannot rule out that the abundance of the
various markers in the mitochondria of mtDNA-deple-
ted cells may result from a different degradation of the
different proteins in the mitochondria of cells depleted
of mtDNA, these results indicate that endogenous mit-
ochondrial proteins might be differentially imported in
the mitochondria of mtDNA-depleted cells.
In order to extend our data on the mitochondrial
protein import in mtDNA-depleted cells in situ, the
import activity was also determined in rho-L929 cells
transfected with a cDNA encoding a chimeric protein
containing HA-tagged apoaequorin and the mito-
chondrial presequence of the COXVIII subunit that
specifically targets the fusion protein to the mitochond-
rial matrix [83]. Confocal microscopy observations
(Fig. 9A) and quantitative analysis of fluorescence sig-
nals on sections of cells immunostained for HA-tagged
apoaequorin and cyt c, used as a mitochondrial mar-
ker, revealed a decrease in the colocalization between
both proteins in the mitochondria of rho-L929 as evi-
denced by the reduced match of fluorescence signals
found in the overlapping fluorescence profiles for these
cells (Fig. 9B).
A
B
21.37 µm
16.87 µm
Fig. 9. The mitochondrial protein import is
reduced in mtDNA-depleted cells. (A) L929
and rho-L929 cells were transiently trans-
fected with an expression plasmid encoding
HA-tagged apoaequorin targeted to the
mitochondria (mtAEQ ⁄ pcDNA1). Expression
of HA-apoaequorin in a transfected cell
(green), abundance of endogenous cyt c
(red), and colocalization (overlay) were then
visualized by confocal microscopy after the
immunostaining of both proteins. (B) Analy-
sis of fluorescence intensity perfomed for
HA-apoaequorin (green) and cyt c (red) on
cell sections using the
QUANTIFY software
from Leica. Fluorescence intensity profiles
showing expression level and colocalization
are plotted from A to B direction for L929
and rho-L929 cells (representative of about
30 analyses).
Mitochondrial biogenesis in mtDNA-depleted cells L. Mercy et al.
5042 FEBS Journal 272 (2005) 5031–5055 ª 2005 FEBS
Effect of mtDNA depletion on membrane
potential and ATP content
It is well known that the protein import into mito-
chondria is driven by the mitochondrial membrane
potential (Dwm) and the ATPase activity of mtHsp70
that requires ATP [84,85]. As expected, and as already
reported for other mtDNA-depleted cell lines such as
L6 myocytes [86], the ATP content in the mtDNA-
depleted cells was also decreased by 60–70% in both
rho
0
143B and rho-L929 cells (Fig. 10A). We thus
qualitatively assessed the mitochondrial membrane
potential (Dwm) with the cationic fluorescent dye
Rhodamine 123 (R123) at 500 nm (the lowest concen-
tration that gave a significant fluorescence signal above
background in our experimental conditions) and found
that the mitochondrial membrane potential was
reduced in both mtDNA-depleted cell lines when com-
pared with their related parental cell lines showing a
normal oxidative capacity (Fig. 10B,C). An argument
in favor that relative mitochondrial membrane poten-
tial (Dwm) measurement can be assessed in these con-
ditions is brought by the fact that FCCP induces a
significant decrease in the R123 fluorescence. These
results clearly show that both driving forces required
for matrix mitochondrial protein import are reduced in
cells with impaired mitochondrial activity and could
explain why mitochondrial matrix-targeted proteins
import is reduced in mtDNA-depleted cells.
Discussion
In this study, we have used two different cell lines that
differ mainly by their origin and the severity of
mtDNA-depletion to investigate the nature of some
mechanisms involved in the mitochondrial biogenesis
of cells with a chronic mitochondrial dysfunction.
Indeed, stimulation of mitochondrial biogenesis and
increase in the expression of nuclear genes encoding
mitochondrial proteins such as respiratory enzymes
seem to be a common cell response to mitochondrial
dysfunction or high energy demand observed in many
pathophysiological conditions [86a,70,86b] and experi-
mental models [5,7]. While mitochondrial biogenesis
has been thought to be dependent on the expression
and replication of mitochondrial genome [87], several
studies have reported later on significantly higher
steady-state levels of nuclear-encoded mRNAs for
mitochondrial proteins in rho
0
cells [88,89]. Moreover,
mitochondria-like structures can still be observed
in the cytoplasm of mtDNA-depleted cells suggesting
an active biogenesis of the organelle in these cells
[52,53].
A
B
C
Fig. 10. Mitochondrial protein import driving forces are decreased
in mtDNA-depleted cells. (A) ATP content was measured in the var-
ious cell lines using a luciferin-luciferase assay and results calcula-
ted in RLU (relative light unit) were normalized for protein content
and expressed in percentages of control cells as means ± 1 SD for
n ¼ 3.: Significant differences from L929 or 143B control cells with
*P < 0.05, ***P < 0.001. Effect of mtDNA-depletion on mitochon-
drial membrane potential as determined by the accumulation of
R123. Rho-L929 and L929 (B) or 143B and rho
0
143B (C) seeded at
50 000 cells per well in a 12-well plate were preincubated or not
with 10 l
M FCCP for 2 h and then loaded 30 min with Rhodamine
123 (500 n
M) before fluorescence was measured in a spectrofluo-
rimeter. Results are expressed in fluorescence intensity unit
normalized for protein content as means ± 1 SD. for n ¼ 3.
+ + , + + +: significantly different from parental cell lines with,
respectively, P < 0.01 and P < 0.001. *, ** and ***: significantly
different from corresponding untreated cells with P < 0.05,
P < 0.01 and P < 0.001 respectively.
L. Mercy et al. Mitochondrial biogenesis in mtDNA-depleted cells
FEBS Journal 272 (2005) 5031–5055 ª 2005 FEBS 5043
Using electron and confocal microscopy as well as
quantitative determination assays to monitor total
mitochondrial population based on the analysis of the
surface occupied by mitochondria in rho-L929 cells and
on the accumulation of fluorescent dyes (Mitotracker
Red and NAO) that stain mitochondria by two differ-
ent mechanisms, we found that not only mitochondrial
population is maintained in mtDNA-depleted cells but
there is even a slight increase in the abundance of
mitochondria in these cells. A previous study reporting
the fragmentation of the mitochondrial network lead-
ing to a distribution of small individual organelles in
rho
0
MRC5 fibroblasts and rho
0
143B emphasized the
fact that while the structure ⁄ morphology of mitochon-
dria is modified in mtDNA-depleted cells, the total
amount of mitochondrial volume did not appear modi-
fied between normal and rho
0
cells [90]. However, no
quantitative analysis was performed by these authors.
As many mitochondrial proteins are encoded by the
nuclear genome, it is likely that rho
0
cells are able to
express many components of mitochondria-like struc-
tures despite a depletion of mtDNA [91] and to import
mitochondrial proteins through TOM and TIM com-
plexes. Indeed, mtDNA-depleted cells maintain a
reduced mitochondrial membrane potential by mecha-
nisms reported elsewhere [51,52,91]. Mitochondrial
membrane potential and ATP content are known to be
crucial for matrix protein import as they both act as
driving forces [92].
While mitochondrial biogenesis has been intensively
studied in yeast [93] and in the context of muscle exer-
cice [46,70], the signalling pathway linking bioenergetic
stress and mitochondrial biogenesis [94] is still poorly
understood, particularly in mtDNA-depleted cells. The
goal of the present study was thus to analyse the
impact of a chronic bioenergetic defect induced by
mtDNA-depletion on the activity status of key mecha-
nisms involved in mitochondrial biogenesis (key tran-
scriptional regulators and mitochondrial protein
import activity) in cell lines that are partially (rho-
L929) or totally (rho
0
143B) depleted of mtDNA.
First, our data show that several genes encoding
mitochondrial proteins such as bATPase, Tim44,
COXVb and cyt c are up-regulated in mtDNA-deple-
ted cells while ANT2 is not affected by a chronic meta-
bolic stress. Interestingly, the over-expression of
COXVb was already reported previously in rho-C2C12
cells [38]. Tom40 is also clearly over-expressed in both
mtDNA-depleted cells while its mitochondrial abun-
dance is unchanged in these cells. As demonstrated for
several mitochondrial markers, the up-regulation
involves an active transcription of these genes but
additional regulation might be specifically involved in
the control of the protein synthesis as only Tim44 and
cyt c but not b-ATPase subunit were found to be over-
expressed at the protein level (Fig. 11). In conclusion,
even if mtDNA-depleted cells are unable to generate
ATP by the OXPHOS, it seems that some proteins
involved in the respiratory chain are over-expressed
and accumulate in the mitochondrial structure as dem-
onstrated for cyt c.
We are aware that only few proteins were analysed
to assess mitochondrial biogenesis but as several mito-
chondrial markers are up-regulated at the transcrip-
tional level in mtDNA-depleted cells, we thus next
investigated the activity status of several transcrip-
tional regulators known to control the expression of
nuclear genes encoding mitochondrial proteins and
thus the mitochondrial biogenesis [13,16]. A key obser-
vation of this study is that the expression and ⁄ or
the activity of major factors described to control mit-
ochondrial biogenesis in various cell types such as
NRF-1, NRF-2, Tfam and other regulators such as
MEF2, MyoD, PPARc or the coactivator PGC-1a
[13,16,17,27,57] are either down-regulated or not modi-
fied in both mtDNA-depleted cell lines (Fig. 11). One
can also emphasize that NRF-1 and Tfam down-regu-
lation is correlated with a decrease in ROS production
and casein kinase II activity in rho-L929 cells support-
ing the positive role of these molecules in the expres-
sion and the activity of this transcription factor
[29,31,67]. Tfam, a NRF-1 regulated gene [6], was
already described to be down-regulated in other rho
0
cell lines [95,96]. In addition, as PGC-1a affects the
expression as well as the transcriptional activity of
NRF-1 [57], it is thus likely that lower abundance of
the protein observed in rho-L929 cells results from the
decrease in NRF-1 and PGC-1a expression in these
cells. Among the various regulators that control the
expression of genes known to encode mitochondrial
proteins analysed in this study, we clearly confirmed
that CREB is the only transcription factor found to be
activated in mtDNA-depleted cells [37].
CREB has been described as a key regulator of
several nuclear genes encoding mitochondrial proteins
such as cyt c [18,97], CPT-1 [98] and MnSOD [99].
Furthermore, the promoter of murine and human
Tom40 (NM_016871 and NM_006114), a mitochond-
rial marker we found to be over-expressed in mtDNA-
depleted cells, also contains putative CRE sites
(TGACGT) within a fragment of 1000 bp upstream
the transcription start site (in silico analysis performed
with dbtss: and tfsearch: http://
molsun1.cbrc.aist.go.jp/research/db/TFSEARCH.html
softwares), suggesting that Tom40 could also be a
CREB-target gene. Furthermore, promoter analysis for
Mitochondrial biogenesis in mtDNA-depleted cells L. Mercy et al.
5044 FEBS Journal 272 (2005) 5031–5055 ª 2005 FEBS
Tim44 (NM_006351) and for beta subunit of F1-AT-
Pase (NM_001686) using the new CREB Target Gene
Database ( [100]
revealed that both genes are also potentially regulated
by CREB as, using chromatin immunoprecipitation
assay (ChIP), the factor was found to bind their pro-
moter in hepatocytes and other cell types. Taken
together, these data suggest that several of the
up-regulated nuclear genes encoding mitochondrial
proteins in response to mitochondrial dysfunction
could be controlled by activated CREB. It might be
apparently surprising to find an up-regulation of mit-
ochondrial biogenesis in mtDNA-depleted cells that is
accompanied by a decrease in the abundance of
Fig. 11. Schematic representation of a molecular pathway that potentially contributes to mitochondrial biogenesis in mtDNA-depleted cells
leading most likely to ‘abnormal’ mitochondria. Chronic mitochondrial dysfunction induces a calcium-CaMKIV-CREB-dependent pathway
leading to the over-expression of several nuclear genes encoding mitochondrial proteins and the adaptative ⁄ compensatory mitochondrial bio-
genesis. The role of this pathway is probably important in these conditions as major regulators of mitochondrial biogenesis are either down-
regulated (Sp1, PPARc, MyoD, PGC-1a) or unchanged (MEF2, YY1) in mtDNA-depleted cells. However, some up-regulated transcripts (+) like
b-ATPase do not lead to protein accumulation (¼). Furthermore, some up-regulated proteins are not found in the mitochondria (– : Tim44),
some do not accumulate more in the organelle (¼ : Tom40, b-ATPase) while others do (+ : cyt c), suggesting a differential import and ⁄ or
degradation in the mitochondria of mtDNA-depleted cells. The thickness of arrows that symbolize the mitochondrial import is related to the
importance of the recovered protein in the mitochondria. Discontinued arrows represent potential control not analysed in this study.
b-ATPase, beta subunit of ATPsynthase; CaMKIV, calmodulin-dependent kinase IV; CREB, cAMP-responsive element binding protein; cyt c,
cytochrome c ; DHFR, dihydrofolate reductase; mtDNA, mitochondrial DNA; NRF-1 and 2, nuclear respiratory factor-1 and 2; MEF2, myocyte
enhancer factor 2; PGC-1a, PPARc coactivator-1 a; PPARc, peroxisome proliferator-activated receptor c; Sp1, specificity protein 1; TIM,
translocase of inner membrane; TOM, translocase of outer membrane; YY1, Ying-Yang 1.
L. Mercy et al. Mitochondrial biogenesis in mtDNA-depleted cells
FEBS Journal 272 (2005) 5031–5055 ª 2005 FEBS 5045
PGC1a. However, Wang et al. have recently identified
PPARd as a major and direct effector in the adaptative
muscle response to endurance exercise characterized by
an increase of mitochondrial biogenesis, up-regulation
of mtDNA and over-expression of mitochondrial mark-
ers without any modification in PGC1a protein [101].
The activation of a calcium ⁄ CaMKIV ⁄ CREB signal-
ling pathway initiated by a chronic mitochondrial dys-
function (Fig. 11) has been previously characterized in
the mtDNA-depleted cells used in this study [37,51].
Here we found and extend our data by showing that
this pathway is also crucial for mitochondrial biogen-
esis in mtDNA-depleted cells as the over-expression of
CREB dominant negative mutants (K-CREB and
M1-CREB) or of a negative form of CaMKIV
(CaMKIVT200A) decreases both the activation of the
cyt c promoter and the expression of the endogenous
protein. Furthermore, the mitochondrial abundance is
lower in mtDNA-depleted cells that over-express
K-CREB or M1-CREB or in cells incubated with
BAPTA, a calcium chelator. In a recent study using
rho-C2C12 cells and MELAS (mitochondrial encephalo-
myopathy with lactic acidosis and stroke-like episodes)
fibroblasts dealing with the protein import machinery
and transcription factors involved in mitochondrial bio-
genesis, it was shown that differential behavior and gene
expression can be observed depending on mtDNA
defects. Indeed, in rho-cells, Tom20 and Tim23 protein
levels were reduced whereas mtHSP70 was induced,
leading to a small increase in enhanced yellow fluores-
cent protein (EYFP) import into mitochondria in these
cells, while EYFP import was not altered in MELAS
cells [60]. In both mtDNA-depleted cell lines used in the
present study, the expression of mtHSP70 is unchanged
(data not shown). Furthermore, these authors have
shown that NRF-1 and transcription factor A (Tfam)
expression declined in rho-cells whereas no change was
observed for PGC-1alpha [60].
Finally, we addressed the mitochondrial protein
import activity in rho-L929 and rho
0
143B cells by two
different approaches that both support a reduction
of mitochondrial matrix protein import in mtDNA-
depleted cells. First, using chimeric recombinant pro-
teins (Su9ATPsynthase–DHFR and cytochrome b2
[b
2
(167)
D
-DHFR] translated and radiolabeled in vitro,
we found that mitochondrial import by purified mito-
chondria from rho
0
143B is dramatically reduced. Sec-
ond, the quantitative analysis of fluorescence signal
profiles showing a reduction in the colocalization
between the mitochondrial-targeted HA-apoaequorin
ectopically over-expressed and the endogenous cyt c in
L929 mtDNA-depleted cells suggests a decrease in the
import of the protein in situ. Finally, the abundance of
Tim44, an essential component of the machinery that
mediates the translocation of nuclear-encoded proteins
across the mitochondrial inner membrane [102,103], is
also dramatically reduced in the mitochondria of
rho
0
143B while the gene is over-expressed both at the
transcript and the protein levels. The reduction of
Tim44 abundance in the mitochondria of mtDNA-
depleted cells could thus result from a lower mito-
chondrial protein import and contribute to explain, in
addition with a reduced ATP content and a decrease
in the Dwm (Fig. 10), how matrix protein import is
reduced in the mitochondria of mtDNA-depleted cells.
Furthermore, these results showing a deficit in the pro-
tein import for Tim44 not observed for b-ATPase sub-
unit, Tom40 or cyt c that even accumulates in the
mitochondria, suggest that mitochondrial dysfunction
might impair mitochondrial protein import differently
according to the protein of interest (Fig. 11). It is note-
worthy that while the mechanisms of cyt C import
are still obscure [104] mitochondrial import of apo-
cytochrome c is apparently independent of the major
receptors Tom20, Tom70 and even Tom40 [104]. Thus,
a reduction in matrix protein import can probably not
be extended to all mitochondrial proteins. Taken
together, these results show that mitochondria of
mtDNA-depleted cells are qualitatively different than
the ones found in parental cells.
In conclusion, our results show that nuclear factors
usually described as key effectors in the control of
mammalian mitochondrial biogenesis are down-regula-
ted in mtDNA-depleted cells while CREB is activated.
Furthermore, several CREB-responsive nuclear genes
encoding mitochondrial proteins are up-regulated in
mtDNA-depleted cells. For example, we previously
showed that CaMKIV-dependent CREB activation in
mtDNA-depleted cells is a pathway activated by mito-
chondrial dysfunction [37]. Here, we show that this
pathway could be involved in the mitochondrial bio-
genesis of mtDNA-depleted cells. While the function
of mitochondria-like structures in cells depleted of
mitochondrial genome is unclear and should be
addressed in the future, other mitochondrial activities
than ATP production as well as prevention of apoptosis
have been proposed.
Experimental procedures
Cell cultures
The characterization of L929, rho-L929, 143B and
rho
0
143B cells was described previously [37,54,105]. Cells
were grown in Dulbecco’s modified Eagle’s medium
containing 4.5 mgÆmL
)1
glucose and 10% fetal bovine
Mitochondrial biogenesis in mtDNA-depleted cells L. Mercy et al.
5046 FEBS Journal 272 (2005) 5031–5055 ª 2005 FEBS
serum (Gibco, BRL, Paisley, UK) and maintained at 37 °C
in a humidified incubator (Heraeus, Hassau, Germany)
under 5% (v ⁄ v) CO
2
. As a polyclonal cell population, rho-
L929 were kept in media containing ethidium bromide
(400 ngÆmL
)1
), uridine (50 lgÆmL
)1
) and pyruvate (1 mm)
to compensate for the respiratory metabolism impairment
and support cell growth.
Transmission electron microscopic (TEM)
L929, rho-L929 cells or mitochondria-enriched fractions
prepared from 143B cells were processed for electron micro-
scopy as described previously [106]. Briefly, samples were
fixed overnight with 2.5% (v ⁄ v) glutaraldehyde (Ladd,
Williston, USA) in 0.1 m sodium cacodylate buffer (pH 7.4)
then rinsed three times with 0.1 m sodium cacodylate buffer
(pH 7.4) and postfixed with 1% (w ⁄ v) OsO
4
(Sigma, St
Louis, MO, USA) in the same buffer. After dehydration
with a graded series of ethanol (Merck, Rahway, NJ, USA)
[3 · 10 min in 50, 70, 90 and 100% (v ⁄ v) ethanol], they
were immersed in acetone and embedded in EPON resin.
Section of 40 nm were cut (Ultramicrotome NOVA, LKB,
Bromma, Sweden), counterstained with uranyl acetate and
examined with an electron microscope (Phillips EM 301,
Eindhoven, the Netherlands). To quantify mitochondrial
population abundance on transmission electron microscopy
micrographs, we analysed the area occupied by mitochon-
dria on the micrographs showing the ultrastructure of
rho-L929 and parental L929 cells by using the NIH image
software ( />We analysed three section images (magnification 15 600·)
taken from random observations and calculated the total
area occupied by mitochondria (cumulative data) out of a
global surface of 10.7 square inches.
Determination of intracellular reactive oxygen
species
Intracellular H
2
O
2
was detected using 2 ¢-7¢ dichlorofluoresc-
ein diacetate (DCFH-DA, Molecular Probes, Eugene, OR,
USA) as described previously [50] with a slight modifica-
tion. Cells were seeded at a density of 100 000 cells per well
in a 24-well plate format (Corning, NY, USA) 16 h before
being incubated (30 min at 37 °C) with 5 lm DCFH-DA
in HBSS (8 gÆL
)1
NaCl, 0.4 gÆL
)1
KCl, 60 mgÆL
)1
Na
2
HPO
4
Æ2H
2
O, 60 mgÆL
)1
KH
2
PO
4
, 100 mgÆL
)1
MgSO
4
Æ7
H
2
O, 0.147 gÆL
)1
CaCl
2
,1gÆL
)1
glucose and 100 mgÆL
)1
MgCl
2
). Cells were then rinsed once with HBSS, lysed using
Passive Lysis Buffer (Promega, Madison, WI, USA) and
ROS production was assessed on 100 lL aliquotes by fluor-
escence intensity determination using a spectrofluorimeter
(FluoStar, BMG Lab Technologies, Offenburg, Germany)
(excitation wavelength, 485 nm; emission wavelength,
530 nm). Fluorescence intensity values are reported as arbi-
trary units after subtracting background. Where indicated,
cells were incubated with 1 lm antimycin A for 60 min after
cell loading with the probe.
Transient transfection and luciferase reporter
gene assay
To determine the transcriptional activity of NRF-1, YY1,
PPARc and CREB, or to assess the activity of the authentic
Tfam promoter, 143B and rho
0
143B cells were seeded in
12-well plates (50 000 cells per well) and transiently
cotransfected by the Superfect reagent (Qiagen, Valencia,
CA, USA) for 6 h in a 1 : 5 ratio, with a luciferase reporter
construct responsive to one of these factors (0.5 lg per well)
or with the mtTFA-RC4 ⁄ pGL3 reporter construct that con-
tains the authentic promoter of Tfam driving the expression
of the luciferase gene and an expression plasmid encoding
b-galactosidase (0.25 lg per well). The activity of PGC-1a
promoter was assessed by transient cotransfection of L929,
rho-L929, 143B and rho
0
143B cells with 0.5 lg per well of a
pGL3-mPGC-luc plasmid that contains a truncated 230 bp
fragment of the murine PGC-1a promoter and 0.25 lg per
well of a plasmid encoding b-galactosidase. Cells were lysed
24 h post-transfection and the luciferase activity was deter-
mined using the Luciferase Reporter Assay (Promega) and
then normalized for b-galactosidase activity.
Transient transfection and CAT reporter gene
assay
To analyse the expression of mitochondrial markers such as
cyt c, ANT2 and b-ATPase genes, 143B and rho
0
143B cells
were seeded in 60 mm Ø culture dishes (Corning) at 500 000
cells per dish. The next day, cells were transiently cotrans-
fected for 6 h by the Superfect reagent with 0.75 lgofa
plasmid encoding b-galactosidase and 2.5 lg of a CAT
reporter gene expressed under the control of either the
authentic promoter of cyt c, ANT2 and b-ATPase genes.
For cyt c expression, when indicated, cells were transiently
cotransfected with 1.75 lg of a pGL2 empty vector or
expression plasmids encoding K-CREB (Arg287Leu) or
M1-CREB (Ser133Ala). Cells were lysed 48 h after trans-
fection in cell culture lysis reagent (Promega) and CAT
activity was measured as described previously, after a simple
phase-extraction step [107]. Briefly, cell lysates were incuba-
ted for 10 min at 60°C to inactivate endogenous deacetylase
activity and then aliquots corresponding to 500 lg protein
were incubated for 18 h at 37°C with 5 llofn-butyryl-CoA
(Promega) and 5 l lof[
14
C]chloramphenicol (PerkinElmer,
Boston, MA, USA) in a total reaction volume of 125 ll.
The n-butyryl chloramphenicol was then extracted with 300
ll of xylene (Sigma) and the associated radioactivity was
counted on a 200 lL aliquot of the xylene phase in a scintil-
lation counter (Hewlett Packard, Palo Alto, USA). Results
were then normalized for b-galactosidase activity.
L. Mercy et al. Mitochondrial biogenesis in mtDNA-depleted cells
FEBS Journal 272 (2005) 5031–5055 ª 2005 FEBS 5047
Casein kinase II (CKII) assay
Confluent rho-L929 cells were rinsed with NaCl ⁄ P
i
and
lysed in 1 mL of cold lysis buffer containing 1% (v ⁄ v) Tri-
ton X-100, 150 mm NaCl, 10 mm Tris ⁄ HCl pH 7.5, 1 mm
EDTA, 1 mm EGTA, 1 mm Na
3
VO
4
, and a protease inhib-
itor cocktail (Roche, Indianapolis, IN, USA). CKII was
then immunoprecipitated from cleared lysates with 2.5 lg
of a monoclonal antibody, anti-CKII (Santa Cruz Biotech-
nology, Santa Cruz, CA, USA) for 2 h at 4 °C. Immune
complexes were immobilized by adding 60 lL of Protein G
Plus ⁄ Protein A-Agarose beads (Oncogene, Boston, MA,
USA) and washed twice with 800 lL of lysis buffer. For
the determination of immunoprecipitated kinase, aliquotes
of resuspended beads were resolved by 10% SDS ⁄ PAGE
and western blotting analysis. Immunoprecipitates were
washed with 500 lL of kinase reaction buffer (20 mm
Tris ⁄ HCl; pH 7.5, 10 mm MgCl
2
,5mm dithiothreitol) and
resuspended in 50 lL of kinase reaction buffer containing
10 lm of a synthetic peptide (RRRDDDSDDD) used as the
substrate for CKII (Cell Signalling, Beverly, CA, USA). The
assay was carried out in the presence of 20 lm unlabeled
ATP (Sigma) and 10 lCi [c-
32
P]ATP (PerkinElmer) for
30 min at 30 °C. A 25 lL aliquote was applied to a phospho-
cellulose membrane spin column (Pierce, Rockford, IL,
USA), washed with 500 lLof75mm H
3
PO
4
, and mem-
brane-associated radioactivity was counted.
Immunofluorescence confocal laser scanner
microscopy (CLSM)
Immunolocalization of cyt c, PGC-1a and Tom40 proteins
was performed on L929, rho-L929 and ⁄ or on 143B and
rho
0
143B cells. Cells were fixed for 10 min with NaCl ⁄ P
i
containing 4% (v ⁄ v) paraformaldehyde, washed three times
with NaCl ⁄ P
i
, permeabilized with NaCl ⁄ P
i
⁄ 1% (v ⁄ v) Tri-
ton-X 100 for 5 min and unspecific sites were blocked with
NaCl ⁄ P
i
⁄ 1% (w ⁄ v) BSA (Sigma). Cells were then incubated
at 4 °C for 16 h with either a rabbit antibody raised against
cyt c (Santa Cruz Biotechnology), PGC-1a or Tom40 at
1 ⁄ 100 dilution. Cells were then washed three times with
NaCl ⁄ P
i
⁄ 1% (w ⁄ v) BSA and incubated for 1 h at 37 °C
with an AlexaFluor (568 nm) goat polyclonal anti-rabbit
IgG (Molecular Probes) at a 1 ⁄ 500 dilution. Cells were then
processed for confocal microscopy with Mowiol (Aldrich,
Bornem, Belgium) solution and observed with a confocal
microscope TCS (Leica, Solms, Germany) using a constant
photomultiplicator. To determine cyt c abundance and dis-
tribution, quantitative analysis of the fluorescence signals
was carried out on cell sections using quantify software
(Leica) and fluorescence profiles were plotted on charts.
To assess mitochondrial protein import activity in situ,
L929 and rho-L929 cells were seeded on glass cover slips in
24 well-culture plates (25 000 cells per well) and transiently
transfected with 1 lg of a plasmid encoding mitochondrial
apoaequorin that contains a HA-tag (mtHA-apoaequorin)
(Molecular Probes) and the pre-sequence of COXVIII that
targets the protein to mitochondria. After 24 h, cells were
fixed for 10 min with NaCl ⁄ P
i
containing 4% (v ⁄ v) para-
formaldehyde, washed three times with NaCl ⁄ P
i
, permeabi-
lized with NaCl ⁄ P
i
1% Triton-X 100 for 5 min and
unspecific sites were blocked with NaCl ⁄ P
i
and 1 % (w ⁄ v)
BSA (Sigma). For double staining of mtHA-apoaequorin
and endogenous cyt c, cells were incubated at 4°C for 16 h
with an anti-HA mouse monoclonal antibody (Roche) and
with a rabbit antibody raised against cyt c (Santa Cruz)
both at a 1 ⁄ 100 dilution. Cells were then washed three
times with NaCl ⁄ P
i
⁄ 1%(w⁄ v) BSA and incubated for 1 h
at 37°C with an Alexa Fluor (488 nm) goat polyclonal anti-
mouse IgG (1 ⁄ 500 dilution) and with an Alexa Fluor (568
nm) goat polyclonal anti-rabbit IgG (1 ⁄ 500 dilution; both
Molecular Probes). After several washes with NaCl ⁄ P
i
⁄ 1%
(w ⁄ v) BSA and NaCl ⁄ P
i
, cells were processed for confocal
microscopy. To assess the import of HA-apoequorin into
mitochondria and its colocalization with cyt c, quantitative
analysis of the fluorescence signals was carried out on cell
sections for both proteins using quantify (Leica) and
fluorescence profiles were compared.
To assess mitochondrial abundance, cells were seeded in
24-well dishes (50 000 cells per well) on glass cover slides
(Merck). Cells were incubated with 250 nm MitoTracker
Red (Molecular Probes) for 30 min in Dulbecco’s modified
Eagles’ medium containing 4.5 mgÆmL
)1
glucose and 10%
(v ⁄ v) fetal bovine serum, before being fixed for 10 min with
a sodium cacodylate buffer (0.1 m, pH 7.4) containing 0.5
%(v⁄ v) glutaraldehyde and processed for confocal micros-
copy.
Spectrofluorimetric quantitation of mitochondria
L929, rho-L929, 143B and rho
0
143B cells were seeded in
24-well plates (50 000 cells per well). When indicated, 143B
and rho
0
143B cells were incubated with 10 lm BAPTA-AM
or transiently transfected with 0.75 lg of a pGL2 empty
vector or expression plasmids encoding K-CREB or
M1-CREB. After 72 h, they were rinsed once with HBSS
buffer: 8 gÆL
)1
NaCl, 0.4 g KCl, 60 mgÆL
)1
KH
2
PO
4
,
60 mgÆL
)1
NaH
2
PO
4
, pH 7.4, 100 mgÆL
)1
MgSO
4
,1gÆL
)1
glucose, 100 mgÆL
)1
MgCl
2
, 350 mgÆL
)1
NaHCO
3
, 140
mgÆL
)1
CaCl
2
) and incubated with 250 nm Mitotracker
Red or 10 l m NAO for the indicated times. Cells were
washed twice with HBSS and lysed in 150 lL of Passive
Lysis Buffer (Promega) for 15 min. The lysates were then
centrifuged 15 min at 15 000 g and the fluorescence was
quantitated on supernatants with a spectrofluorimeter (Flu-
ostar, BMG lab technologies: Mitotracker Red: excitation
wavelength, 585 nm; emission wavelength, 612 nm; NAO:
excitation wavelength, 485 nm; emission wavelength,
520 nm). Fluorescence intensities were normalized for pro-
tein content determined by a Bio-Rad Protein assay [108].
Mitochondrial biogenesis in mtDNA-depleted cells L. Mercy et al.
5048 FEBS Journal 272 (2005) 5031–5055 ª 2005 FEBS
Reverse transcription and real-time PCR
Total RNA was extracted from 143B and rho
0
143B cells
with the RNAgents total RNA isolation system (Promega)
according to the manufacturer’s instructions. Reverse tran-
scription was performed with 5 lg of total RNA and 5 U
of reverse transcriptase enzyme (SuperscriptRII, Invitrogen,
Carlsbad, CA, USA) in a final volume of 20 lL.
Quantitative PCR amplification of Tim44, COXVb and
F1-ATPase b-subunit (b-ATPase) was performed with spe-
cific reverse and forward primers at 300 nm with an
Applied Biosystem 7100. To monitor amplification, SYBR
Green QPCR Master Mix (Applied Biosystems, Foster
City, CA, USA) was used according to manufacturer’s
instructions. Primers for the amplification of Tim44,
COXVb, b-ATPase and the housekeeping gene TATA-box
binding protein (TBP) were as follows: Tim44 sense 5¢-TC
CATTCTCGCATCCTAGACATT-3¢, antisense 5¢-GTGC
CTGGAAGGTGATGATCA-3¢; COXVb sense 5¢-TGCG
CTCCATGGCATCT-3¢, antisense 5¢-CTTCTTTGCAGC
CAGCATGAT-3¢; b-ATPase sense 5¢-CCATCCTGGGTA
TGGATGAACT-3¢, antisense 5¢-GGCTGAGACAAGAA
ACGCTGTAT-3¢, TBP sense 5¢-CCTCACAGGTCAAAG
GTTTACAGTAC-3¢, antisense 5¢-GCTGAGGTTGCAG
GAATTGAA-3¢). PCR amplifications were denaturation at
95°C for 15 s, annealing at 60°C for 1 min and polymeriza-
tion at 72°C for 1.5 min (40 cycles). Samples were then
subjected to melting curve analysis. All reactions were per-
formed on RNA extracted from three independent cell cul-
tures and values were normalized for TBP used as
reference.
Mitochondrial protein import assay in situ
or into isolated mitochondria
The procedure for standard isolation of cell mitochondria
and in vitro import of radiolabeled precursors was previ-
ously described [109,110]. The chimeric proteins encoded by
plasmids was either Neurospora crassa ATPase subunit 9
fused to the dihydrofolate reductase (pSu9-DHFR) or a
fusion protein consisting of the 167 NH
2
-terminal amino
acids of the cytochrome b
2
precursor with a 19-residue
deletion in the sorting sequence and entire DHFR
[pb
2
(167)
D19
-DHFR]. Mitochondria were isolated as des-
cribed previously [11].
Briefly, 143B and rho
0
143B cells were washed twice
with cold NaCl ⁄ P
i
before being scraped in sucrose ⁄ imi-
dazole (SI) buffer (3 mm imidazol, pH 7.4, 0.23 gÆL
)1
sucrose). The cell suspension was then passed 40 times
through a Dounce homogenizer, centrifuged for 10 min
at 260 g (4°C), and the supernatant collected and centri-
fuged for 2 min at 14 000 g (4°C). The pellet was finally
washed once with SI buffer and mitochondria were resus-
pended in SEM buffer [250 mm sucrose, 1 mM EDTA,
10 mm morpholinopropanesulfonic acid (MOPS ⁄ KOH)
pH 7.2]. Radiolabelled proteins were synthesized by
in vitro translation in the presence of [
35
S]methionine
after in vitro transcription using SP6 polymerase and the
TNT Coupled Reticulocyte Lysate System (Promega)
according to the manufacturer’s instructions. Import of
precursor proteins used 30 lg of mitochondrial proteins
diluted in import buffer [3% (w ⁄ v) fatty acid-free BSA,
10 mm Mops; pH 7.2, 80 mm KCl, 5 mm MgCl
2
,2mm
KH
2
PO
4
and 5 mm methionine). Prior to the import
assay, samples were supplemented with 2 mm ATP,
10 mm succinate, 10 mm malate (all Sigma) and 5 mm
methionine. The import reaction of Su9-DHFR and
b
2
(167)
D
-DHFR precursors was performed for 10 min at
25°C, stopped by the addition of 1 lm valinomycin for
5 min and placed on ice. Each sample was divided into
two aliquots that were either treated or not with 40
lgÆmL
)1
proteinase K for 15 min at 4°C. Proteinase K
was inhibited by a protease inhibitor cocktail (Roche).
Mitochondria were subsequently reisolated by centrifuga-
tion for 2 min at 14 000 g), washed twice with SEM buf-
fer, then lysed in 0.5 m NaOH for 16 h. The import was
determined by the radioactivity counted in proteinase
K-treated samples (Hewlett Packard). To control that the
proteins were specifically imported into mitochondria,
membrane potential was eliminated by treatment with
1 lm valinomycin before the import assay and the values
subtracted from each test.
Colorimetric DNA binding assay
To assess the DNA binding activity of Sp1, PPARc, MyoD
and MEF-2 transcription factors, TransAM colorimetric
DNA binding assay (Active Motif, Carlsbad, CA, USA) were
performed based on the protocol described previously [75].
Briefly, 5 lg of nuclear proteins were incubated for 2 h
in a 96 well-plate coated with either a double strand
oligonucleotide containing the consensus sequence for
Sp1, PPARc, MyoD or MEF-2. DNA binding activity
was detected with respectively an anti-Sp1, anti-PPARc,
anti-MyoD and anti-MEF-2 Igs (all from Santa Cruz
Biotechnology) and revealed by a colorimetric reaction
with a HRP-conjugated secondary antibody. The enzy-
matic reaction was stopped and A
450
measured with a
spectrophotometer (BioRad, Hercules, CA, USA).
High salt nuclear protein extractions were prepared by
incubating cells (in 75 cm
2
flasks) on ice for 3 min with
10 mL cold hypotonic buffer (HB): 20 mm Hepes, 5 mm
NaF, 1 mm Na
2
MoO
4
, 0.1 mm EDTA. Cells were then har-
vested in 500 lL HB containing 0.2% (v ⁄ v) NP-40 (Sigma),
protease inhibitors (Roche) and phosphatase inhibitors
(1 mm Na
3
VO
4
,5mm NaF, 10 mm p-nitrophenylphos-
phate, 10 mm b-glycerophosphate). Cell lysates were centri-
fuged 30 s at 15 000 g and the sedimented nuclei were
resuspended in 50 lL HB containing 20% (v ⁄ v) glycerol,
protease ⁄ phosphatase inhibitors. Nuclear extracted proteins
L. Mercy et al. Mitochondrial biogenesis in mtDNA-depleted cells
FEBS Journal 272 (2005) 5031–5055 ª 2005 FEBS 5049
were obtained by the addition of 100 lL HB containing
20% (v ⁄ v) glycerol, 0.8 m NaCl and protease ⁄ phosphatase
inhibitors, and the protein concentration was determined
[108].
Western blotting analysis
Cells were washed with cold NaCl ⁄ P
i
and lysed in a buffer
containing 40 mm Tris, pH 7.5, 150 m m KCl, 1 mm EDTA,
1% (v ⁄ v) Triton X-100, a protease inhibitor cocktail
(Roche) and phosphatase inhibitors (250 mm NaVO
3
,
10 mm p-nitrophenylphosphate, 10 mm b-glycerophosphate
and 5 mm NaF). The clear lysates were collected and pro-
tein concentration was determined using BioRad protein
assay [108]. After adding sample buffer containing 50 mm
Tris ⁄ HCl, pH 6.8, 2% (v ⁄ v) SDS, 8% (v ⁄ v) glycerol and
0.4% (v ⁄ v) 2-mercaptoethanol, proteins were size-separated
by 4–12% Nu-PAGE gel (Invitrogen) and transferred to
PVDF membranes (Amersham Pharmacia Biotech). Blots
were blocked for 18 h at 4 °C with TBS [Tris 200 mm;
pH 7.4, 140 mm NaCl, 0.1% (v ⁄ v) Tween] containing 5%
(w ⁄ v) fat milk (Gloria, Vevey, Switzerland). After incuba-
tions with appropriate primary and secondary antibodies,
target proteins were visualized using ECL kit (Amersham
Biosciences).
For the detection of the various proteins, antibodies
against NRF-1 (dilution 1 : 2000), NRF-2 (dilution
1 : 2000), cyt c and Tom40 (both Santa Cruz Biotechno-
logy; dilutions 1 : 2000 and 1 : 1000, respectively), PGC-
1a (dilution 1 : 1000), Tfam (dilution 1 : 5000) and COXI
(Molecular Probes, dilution 1 : 1000) were used and blots
were probed with appropriate horseradish peroxydase-
conjugated secondary antibodies (Amersham Biosciences,
dilution 1 : 100 000). Blots were then washed (three times
for 20 min each) and proteins visualized using enhanced
chemiluminescence (Amersham Biosciences). Equal load-
ing was assessed using antibody raised against either TBP
(Santa Cruz; dilution 1 : 200), a-tubulin (Sigma, dilution
1 : 5000) or COXIV (Molecular Probes, dilution
1 : 1000). For cytochrome c abundance analysis, L929
and rho
0
L929 cells seeded in 25 cm
2
flasks (Costar) were
transiently transfected with either 5 lg of expression plas-
mids encoding K-CREB, M1-CREB, a dominant negative
form of CaMKIV (CaMKIVT200A), or an empty vector
(pGL2). After 48 h cells were harvested and processed
for western blot analysis. Protein signals were quantified
on films with TotalLab image master software (Amer-
sham Biosciences) and data were normalized for a-tubulin
signals used as a loading control.
Cellular ATP content
ATP contents were measured using a somatic cell ATP
assay kit (Sigma) based on the assay of ATP-driven luci-
ferin luciferase activity [111]. Briefly, cells were seeded at
50 000 cells per well in 12-multiwell plates, harvested at
4 °C, lysed with 400 lL of ATP releasing reagent and the
lysates were assayed for luciferase activity according the
manufacturer’s procedure in a Luminometer (Lumac, Land-
graaf, the Netherlands). Proteins were determined by the
Bradford assay [108] and results were calculated in relative
light units (RLU) per lg of protein and expressed arbitrar-
ily in percentages of controls.
Mitochondrial membrane potential
measurements
Mitochondrial membrane potential was assesed using the
Rhodamine 123 fluorescent probe [52,112]. L929, rho-L929,
143B and rho
0
143B cells, seeded in 12 well-plates (50 000
cells per well), were preincubated or not with FCCP
(10 lm) for 2 h before being loaded 30 min with Rhodamine
123 (500 nm). Cells were then washed with HBSS buffer
(8 gÆL
)1
NaCl, 0.4 g KCl, 60 mgÆL
)1
KH
2
PO
4
,60mgÆL
)1
NaH
2
PO
4
, pH 7.4, 100 mgÆL
)1
MgSO
4
,1gÆL
)1
glucose,
100 mgÆL
)1
MgCl
2
, 350 mgÆL
)1
NaHCO
3
, 140 mgÆL
)1
CaCl
2
) and lysed with passive lysis buffer (Promega) for
15 min. Lysates were centrifuged 3 min at 15 000 g. and
Rhodamine 123 fluorescence (excitatory wavelength,
485 nm; emission wavelength, 520 nm) was measured on
the supernatant with a spectrofluorimeter (FluoStar).
Statistical analysis
Data from at least three separate experiments were presen-
ted as means ± SD and analysed with anova I and Sche-
ffe
´
’s contrasts. Differences were considered statistically
significant if P < 0.05.
Acknowledgements
T. Arnould and A. De Pauw are Research Associate
and Research Assistant, respectively, of the Fonds
National de la Recherche Scientifique, Belgium
(FNRS). L. Mercy has a doctoral fellowships from the
Fonds pour la Recherche dans l’Industrie et l’Agricul-
ture (FRIA), Brussels, Belgium and S. Tejerina has a
doctoral fellowship from the Coope
´
ration Universitaire
au De
´
veloppement (CUD). This paper presents results
of the Belgian Programme on Interuniversity Attrac-
tion Poles (IAP) initiated by the Belgian State, Prime
Minister’s Office Science Policy Programming and the
Action de Recherche Concerte
´
e (ARC) funded by the
French-speaking community of Belgium. The scientific
responsibility is assumed by the authors. We thank
Prof J. Grooten (University of Ghent, Belgium) for the
rho-L929 and L929 cell lines, Dr G. Janssen (Leiden
University Medical Center, the Netherlands) and Prof
Attardi (California Institute of Technology, USA) for
Mitochondrial biogenesis in mtDNA-depleted cells L. Mercy et al.
5050 FEBS Journal 272 (2005) 5031–5055 ª 2005 FEBS
the generous gifts of 143B and rho
0
143B cell lines. The
4xNRF-1-luciferase reporter, anti-NRF-1, mtTFA-
RC4 ⁄ pGL3 and PGC-1a expression plasmids were a
generous gift from Dr Scarpulla (North-Western
University Medical School, Chicago, USA). The PGC-
1a antibody was kindly provided by Dr Kelly
(Washington University School, USA). We also thank
Dr Wiesner (University of Kho
¨
ln, Germany) for anti-
Tfam. All the CAT reporter plasmids were kindly
provided by Dr Zaid (Department of Biochemistry,
Stockholm, Sweden). The plasmids K-CREB and M1
CREB were a generous gift from Prof Greenberg
(Children’s Hospital, Department of Neurobiology,
Harvard Medical School, Boston, USA) and the
construct encoding the dominant negative mutant
CaMKIV (T200A) was from Prof K.A. Anderson and
Prof A.R. Means (Duke University, USA).
The plasmid pMsx2SS-luciferase that contains three
copies of YY1 sites upstream of the firefly luciferase
was a gift from Dr Shum (National Institute of Arthi-
tis and Muscoskeletal and Skin Diseases, National
Institute of Health, Bethesda, USA). 3xPPRE-luci-
ferase was a gift from Prof. Evans (The Salk Institute
for Biological Studies, San Diego, USA) and the plas-
mid containing the authentic a-inhibine promoter with
four CRE sites driving the expression of the luciferase
gene was from Dr Jameson (North-Western Univer-
sity, Evanston, USA). pGL3-mPGC-luc was a gener-
ous gift from Dr Herzig (Peptide Biology
Laboratories, Salk Institute for Biological Studies, La
Jolla, USA). We also thank Pr. Voos (Albert-ludwig-
Universita
¨
t, Freiburg, Germany) for the plasmids
pSu9-DHFR and pb
2
(167)
D19
-DHFR.
References
1 Wallace DC (1999) Mitochondrial diseases in man and
mouse. Science 283, 1482–1488.
2 Duchen MR (2004) Mitochondria in health and dis-
ease: perspectives on a new mitochondrial biology. Mol
Aspects Med 25, 365–451.
3 Nisoli E, Clementi E, Moncada S & Carruba MO
(2004) Mitochondrial biogenesis as a cellular signaling
framework. Biochem Pharmacol 67, 1–15.
4 Wei YH & Lee HC (2003) Mitochondrial DNA muta-
tions and oxidative stress in mitochondrial diseases.
Adv Clin Chem 37, 83–128.
5 Graham BH, Waymire KG, Cottrell B, Trounce IA,
MacGregor GR & Wallace DC (1997) A mouse model
for mitochondrial myopathy and cardiomyopathy
resulting from a deficiency in the heart ⁄ muscle isoform
of the adenine nucleotide translocator. Nat Genet 16,
226–234.
6 Virbasius JV & Scarpulla RC (1994) Activation of the
human mitochondrial transcription factor A gene by
nuclear respiratory factors: a potential regulatory link
between nuclear and mitochondrial gene expression in
organelle biogenesis. Proc Natl Acad Sci USA 91,
1309–1313.
7 Hansson A, Hance N, Dufour E, Rantanen A,
Hultenby K, Clayton DA, Wibom R & Larsson NG
(2004) A switch in metabolism precedes increased mito-
chondrial biogenesis in respiratory chain-deficient
mouse hearts. Proc Natl Acad Sci USA 101, 3136–3141.
8 Lee HC & Wei YH (2005) Mitochondrial biogenesis
and mitochondrial DNA maintenance of mammalian
cells under oxidative stress. Int J Biochem Cell Biol 37,
822–834.
9 Attardi G & Schatz G (1988) Biogenesis of mitochon-
dria. Annu Rev Cell Biol 4, 289–333.
10 Poyton RO & McEwen JE (1996) Crosstalk between
nuclear and mitochondrial genomes. Annu Rev Biochem
65, 563–607.
11 Mootha VK, Bunkenborg J, Olsen JV, Hjerrild M,
Wisniewski JR, Stahl E, Bolouri MS, Ray HN, Sihag
S, Kamal M et al. (2003) Integrated analysis of protein
composition, tissue diversity, and gene regulation in
mouse mitochondria. Cell 115 , 629–640.
12 Moyes CD (2003) Controlling muscle mitochondrial
content. J Exp Biol 206, 4385–4391.
13 Goffart S & Wiesner RJ (2003) Regulation and
co-ordination of nuclear gene expression during mito-
chondrial biogenesis. Exp Physiol 88, 33–40.
14 Virbasius CA, Virbasius JV & Scarpulla RC (1993)
NRF-1, an activator involved in nuclear–mitochondrial
interactions, utilizes a new DNA-binding domain con-
served in a family of developmental regulators. Genes
Dev 7, 2431–2445.
15 Scarpulla RC (1997) Nuclear control of respiratory
chain expression in mammalian cells. J Bioenerg Bio-
membr 29, 109–119.
16 Scarpulla RC (2002) Nuclear activators and coactiva-
tors in mammalian mitochondrial biogenesis. Biochim
Biophys Acta 1576, 1–14.
17 Scarpulla RC (2002) Transcriptional activators and
coactivators in the nuclear control of mitochondrial
function in mammalian cells. Gene 286, 81–89.
18 Gopalakrishnan L & Scarpulla RC (1994) Differential
regulation of respiratory chain subunits by a CREB-
dependent signal transduction pathway. Role of cyclic
AMP in cytochrome c and COXIV gene expression.
J Biol Chem 269, 105–113.
19 Puigserver P, Wu Z, Park CW, Graves R, Wright M &
Spiegelman BM (1998) A cold-inducible coactivator of
nuclear receptors linked to adaptive thermogenesis. Cell
92, 829–839.
20 Puigserver P, Adelmant G, Wu Z, Fan M, Xu J,
O’Malley B & Spiegelman BM (1999) Activation of
L. Mercy et al. Mitochondrial biogenesis in mtDNA-depleted cells
FEBS Journal 272 (2005) 5031–5055 ª 2005 FEBS 5051
PPARgamma coactivator-1 through transcription fac-
tor docking. Science 286, 1368–1371.
21 Lenka N, Vijayasarathy C, Mullick J & Avadhani NG
(1998) Structural organization and transcription regula-
tion of nuclear genes encoding the mammalian cyto-
chrome c oxidase complex. Prog Nucleic Acid Res Mol
Biol 61, 309–344.
22 Czubryt MP, McAnally J, Fishman GI & Olson EN
(2003) Regulation of peroxisome proliferator-activated
receptor gamma coactivator 1 alpha (PGC-1 alpha)
and mitochondrial function by MEF2 and HDAC5.
Proc Natl Acad Sci USA 100, 1711–1716.
23 Lescuyer P, Martinez P & Lunardi J (2002) YY1 and
Sp1 activate transcription of the human NDUFS8 gene
encoding the mitochondrial complex I TYKY subunit.
Biochim Biophys Acta 1574, 164–174.
24 Breen GA & Jordan EM (1997) Regulation of the
nuclear gene that encodes the alpha-subunit of the
mitochondrial F0F1-ATP synthase complex. Activation
by upstream stimulatory factor 2. J Biol Chem 272,
10538–10542.
25 Zaid A, Li R, Luciakova K, Barath P, Nery S &
Nelson BD (1999) On the role of the general transcrip-
tion factor Sp1 in the activation and repression of
diverse mammalian oxidative phosphorylation genes.
J Bioenerg Biomembr 31, 129–135.
26 Amuthan G, Biswas G, Ananadatheerthavarada HK,
Vijayasarathy C, Shephard HM & Avadhani NG
(2002) Mitochondrial stress-induced calcium signaling,
phenotypic changes and invasive behavior in human
lung carcinoma A549 cells. Oncogene 21, 7839–
7849.
27 Puigserver P & Spiegelman BM (2003) Peroxisome pro-
liferator-activated receptor-gamma coactivator 1 alpha
(PGC-1 alpha): transcriptional coactivator and meta-
bolic regulator. Endocr Rev 24, 78–90.
28 Akimoto T, Pohnert SC, Li P, Zhang M, Gumbs C,
Rosenberg PB, Williams RS & Yan Z (2005) Exercise
stimulates Pgc-1alpha transcription in skeletal muscle
through activation of the p38 MAPK pathway. J Biol
Chem 280, 19587–19593.
29 Suzuki H, Kumagai T, Goto A & Sugiura T (1998)
Increase in intracellular hydrogen peroxide and upregu-
lation of a nuclear respiratory gene evoked by impair-
ment of mitochondrial electron transfer in human cells.
Biochem Biophys Res Commun 249, 542–545.
30 Lee YK, Dell H, Dowhan DH, Hadzopoulou-Cladaras
M & Moore DD (2000) The orphan nuclear receptor
SHP inhibits hepatocyte nuclear factor 4 and retinoid
X receptor transactivation: two mechanisms for repres-
sion. Mol Cell Biol 20, 187–195.
31 Miranda S, Foncea R, Guerrero J & Leighton F (1999)
Oxidative stress and upregulation of mitochondrial bio-
genesis genes in mitochondrial DNA-depleted HeLa
cells. Biochem Biophys Res Commun 258, 44–49.
32 Nisoli E, Clementi E, Paolucci C, Cozzi V, Tonello C,
Sciorati C, Bracale R, Valerio A, Francolini M,
Moncada S & Carruba MO (2003) Mitochondrial
biogenesis in mammals: the role of endogenous nitric
oxide. Science 299, 896–899.
33 Freyssenet D, Di Carlo M & Hood DA (1999) Cal-
cium-dependent regulation of cytochrome c gene
expression in skeletal muscle cells. Identification of a
protein kinase c-dependent pathway. J Biol Chem 274,
9305–9311.
34 Ojuka EO, Jones TE, Han DH, Chen M, Wamhoff
BR, Sturek M & Holloszy JO (2002) Intermittent
increases in cytosolic Ca2+ stimulate mitochondrial
biogenesis in muscle cells. Am J Physiol Endocrinol
Metab 283, E1040–E1045.
35 Ojuka EO, Jones TE, Han DH, Chen M & Holloszy
JO (2003) Raising Ca2+ in L6 myotubes mimics
effects of exercise on mitochondrial biogenesis in
muscle. FASEB J 17, 675–681.
36 Duchen MR (2000) Mitochondria and calcium: from
cell signalling to cell death. J Physiol 529, 57–68.
37 Arnould T, Vankoningsloo S, Renard P, Houbion A,
Ninane N, Demazy C, Remacle J & Raes M (2002)
CREB activation induced by mitochondrial dysfunction
is a new signaling pathway that impairs cell prolifera-
tion. EMBO J 21, 53–63.
38 Biswas G, Adebanjo OA, Freedman BD, Anandathe-
erthavarada HK, Vijayasarathy C, Zaidi M, Kotlikoff
M & Avadhani NG (1999) Retrograde Ca2+ signaling
in C2C12 skeletal myocytes in response to mitochond-
rial genetic and metabolic stress: a novel mode of inter-
organelle crosstalk. EMBO J 18, 522–533.
39 Wu H, Kanatous SB, Thurmond FA, Gallardo T, Iso-
tani E, Bassel-Duby R & Williams RS (2002) Regula-
tion of mitochondrial biogenesis in skeletal muscle by
CaMK. Science 296, 349–352.
40 Chacinska A, Pfanner N & Meisinger C (2002) How
mitochondria import hydrophilic and hydrophobic pro-
teins. Trends Cell Biol 12, 299–303.
41 Geissler A, Rassow J, Pfanner N & Voos W (2001)
Mitochondrial import driving forces: enhanced trap-
ping by matrix Hsp70 stimulates translocation and
reduces the membrane potential dependence of
loosely folded preproteins. Mol Cell Biol 21,
7097–7104.
42 Craig EE, Chesley A & Hood DA (1998) Thyroid hor-
mone modifies mitochondrial phenotype by increasing
protein import without altering degradation. Am J
Physiol 275, C1508–C1515.
43 Grey JY, Connor MK, Gordon JW, Yano M, Mori M
& Hood DA (2000) Tom20-mediated mitochondrial
protein import in muscle cells during differentiation.
Am J Physiol Cell Physiol 279, C1393–C1400.
44 Takahashi M, Chesley A, Freyssenet D & Hood DA
(1998) Contractile activity-induced adaptations in the
Mitochondrial biogenesis in mtDNA-depleted cells L. Mercy et al.
5052 FEBS Journal 272 (2005) 5031–5055 ª 2005 FEBS
mitochondrial protein import system. Am J Physiol
274, C1380–C1387.
45 Hood DA & Joseph AM (2004) Mitochondrial assem-
bly: protein import. Proc Nutr Soc 63, 293–300.
46 Hood DA, Adhihetty PJ, Colavecchia M, Gordon
JW, Irrcher I, Joseph AM, Lowe ST & Rungi AA
(2003) Mitochondrial biogenesis and the role of the
protein import pathway. Medical Sci Sports Exerc 35,
86–94.
47 Desjardins P, Frost E & Morais R (1985) Ethidium
bromide-induced loss of mitochondrial DNA from pri-
mary chicken embryo fibroblasts. Mol Cell Biol 5,
1163–1169.
48 King MP & Attardi G (1996) Isolation of human cell
lines lacking mitochondrial DNA. Methods Enzymol
264, 304–313.
49 Jazayeri M, Andreyev A, Will Y, Ward M, Anderson
CM & Clevenger W (2003) Inducible expression of a
dominant negative DNA polymerase-gamma depletes
mitochondrial DNA and produces a rho0 phenotype.
J Biol Chem 278, 9823–9830.
50 Park SY, Chang I, Kim JY, Kang SW, Park SH,
Singh K & Lee MS (2004) Resistance of mitochon-
drial DNA-depleted cells against cell death: role of
mitochondrial superoxide dismutase. J Biol Chem
279, 7512–7520.
51 Arnould T, Mercy L, Houbion A, Vankoningsloo S,
Renard P, Pascal T, Ninane N, Demazy C & Raes M
(2003) mtCLIC is up-regulated and maintains a mito-
chondrial membrane potential in mtDNA-depleted
L929 cells. FASEB J 17, 2145–2147.
52 Buchet K & Godinot C (1998) Functional F1-ATPase
essential in maintaining growth and membrane poten-
tial of human mitochondrial DNA-depleted rho degrees
cells. J Biol Chem 273, 22983–22989.
53 Holmuhamedov EL (2003) Deletion of mtDNA dis-
rupts mitochondrial function and structure, but not
biogenesis. Mitochondrion 3, 13–19.
54 Schulze-Osthoff K, Beyaert R, Vandevoorde V,
Haegeman G & Fiers W (1993) Depletion of the
mitochondrial electron transport abrogates the cyto-
toxic and gene-inductive effects of TNF. EMBO J
12, 3095–3104.
55 Sherer TB, Trimmer PA, Parks JK & Tuttle JB (2000)
Mitochondrial DNA-depleted neuroblastoma (Rho
degrees) cells exhibit altered calcium signaling. Biochim
Biophys Acta 1496, 341–355.
56 Buckman JF, Hernandez H, Kress GJ, Votyakova TV,
Pal S & Reynolds IJ (2001) MitoTracker labeling in
primary neuronal and astrocytic cultures: influence of
mitochondrial membrane potential and oxidants.
J Neurosci Methods 104, 165–176.
57 Wu Z, Puigserver P, Andersson U, Zhang C, Adelmant
G, Mootha V, Troy A, Cinti S, Lowell B, Scarpulla
RC & Spiegelman BM (1999) Mechanisms controlling
mitochondrial biogenesis and respiration through the
thermogenic coactivator PGC-1. Cell 98, 115–124.
58 Mileykovskaya E, Dowhan W, Birke RL, Zheng D,
Lutterodt L & Haines TH (2001) Cardiolipin binds
nonyl acridine orange by aggregating the dye at
exposed hydrophobic domains on bilayer surfaces.
FEBS Lett 507, 187–190.
59 Jacobson J, Duchen MR & Heales SJ (2002) Intracellu-
lar distribution of the fluorescent dye nonyl acridine
orange responds to the mitochondrial membrane poten-
tial: implications for assays of cardiolipin and mito-
chondrial mass. J Neurochem 82, 224–233.
60 Joseph AM, Rungi AA, Robinson BH & Hood DA
(2004) Compensatory responses of protein import and
transcription factor expression in mitochondrial DNA
defects. Am J Physiol Cell Physiol 286, C867–
C875.
61 Li K, Neufer PD & Williams RS (1995) Nuclear
responses to depletion of mitochondrial DNA in
human cells. Am J Physiol 269, C1265–C1270.
62 Virbasius JV & Scarpulla RC (1991) Transcriptional
activation through ETS domain binding sites in the
cytochrome c oxidase subunit IV gene. Mol Cell Biol
11, 5631–5638.
63 Lezza AM, Pesce V, Cormio A, Fracasso F, Vecchiet J,
Felzani G, Cantatore P & Gadaleta MN (2001)
Increased expression of mitochondrial transcription
factor A and nuclear respiratory factor-1 in skeletal
muscle from aged human subjects. FEBS Lett 501,
74–78.
64 Escriva H, Rodriguez-Pena A & Vallejo CG (1999)
Expression of mitochondrial genes and of the transcrip-
tion factors involved in the biogenesis of mitochondria
Tfam, NRF-1 and NRF-2, in rat liver, testis and brain.
Biochimie 81, 965–971.
65 Clayton DA (2000) Transcription and replication of
mitochondrial DNA. Hum Reprod 15 (Suppl. 2), 11–17.
66 Garstka HL, Schmitt WE, Schultz J, Sogl B, Silakow-
ski B, Perez-Martos A, Montoya J & Wiesner RJ
(2003) Import of mitochondrial transcription factor A
(TFAM) into rat liver mitochondria stimulates tran-
scription of mitochondrial DNA. Nucleic Acids Res 31,
5039–5047.
67 Gugneja S & Scarpulla RC (1997) Serine phosphoryla-
tion within a concise amino-terminal domain in nuclear
respiratory factor 1 enhances DNA binding. J Biol
Chem 272, 18732–18739.
68 Chandel NS & Schumacker PT (1999) Cells depleted of
mitochondrial DNA (rho0) yield insight into physiolo-
gical mechanisms. FEBS Lett 454, 173–176.
69 Oblak E, Lachowicz TM, Luczynski J & Witek S
(2002) Lysosomotropic N,N-dimethyl a-amino acid
N-alkyl esters and their quaternary ammonium salts
as plasma membrane and mitochondrial ATPases
inhibitors. Cell Mol Biol Lett 7, 1121–1129.
L. Mercy et al. Mitochondrial biogenesis in mtDNA-depleted cells
FEBS Journal 272 (2005) 5031–5055 ª 2005 FEBS 5053
70 Hood DA (2001) Invited Review: contractile activity-
induced mitochondrial biogenesis in skeletal muscle.
J Appl Physiol 90, 1137–1157.
71 Mascaro C, Acosta E, Ortiz JA, Marrero PF, Hegardt
FG & Haro D (1998) Control of human muscle-type
carnitine palmitoyltransferase I gene transcription by
peroxisome proliferator-activated receptor. J Biol Chem
273, 8560–8563.
72 Louet JF, Le May C, Pegorier JP, Decaux JF & Girard
J (2001) Regulation of liver carnitine palmitoyltransfer-
ase I gene expression by hormones and fatty acids.
Biochem Soc Trans 29, 310–316.
73 Gulick T, Cresci S, Caira T, Moore DD & Kelly DP
(1994) The peroxisome proliferator-activated receptor
regulates mitochondrial fatty acid oxidative enzyme gene
expression. Proc Natl Acad Sci USA 91, 11012–11016.
74 Tsuboyama-Kasaoka N, Takahashi M, Kim H &
Ezaki O (1999) Up-regulation of liver uncoupling
protein-2 mRNA by either fish oil feeding or fibrate
administration in mice. Biochem Biophys Res Commun
257, 879–885.
75 Renard P, Ernest I, Houbion A, Art M, Le Calvez H,
Raes M & Remacle J (2001) Development of a sensitive
multi-well colorimetric assay for active NFkappaB.
Nucleic Acids Res 29, E21.
76 Pei L, Dodson R, Schoderbek WE, Maurer RA &
Mayo KE (1991) Regulation of the alpha inhibin
gene by cyclic adenosine 3¢,5¢-monophosphate after
transfection into rat granulosa cells. Mol Endocrinol
5, 521–534.
77 Song S, Zhang Y, Ma K, Jackson-Hayes L, Lavrentyev
EN, Cook GA, Elam MB & Park EA (2004) Peroxiso-
mal proliferator activated receptor gamma coactivator
(PGC-1a) stimulates carnitine palmitoyltransferase I
(CPT-Ia) through the first intron. Biochim Biophys
Acta 1679, 164–173.
78 Handschin C, Rhee J, Lin J, Tarr PT & Spiegelman
BM (2003) An autoregulatory loop controls peroxisome
proliferator-activated receptor gamma coactivator
1alpha expression in muscle. Proc Natl Acad Sci USA
100, 7111–7116.
79 Bonni A, Brunet A, West AE, Datta SR, Takasu MA
& Greenberg ME (1999) Cell survival promoted by the
Ras-MAPK signaling pathway by transcription-depen-
dent and – independent mechanisms. Science 286,
1358–1362.
80 Chatila T, Anderson KA, Ho N & Means AR
(1996) A unique phosphorylation-dependent mechan-
ism for the activation of Ca
2+
⁄ calmodulin-dependent
protein kinase type IV ⁄ GR. J Biol Chem 271, 21542–
21548.
81 Geissler A, Krimmer T, Bomer U, Guiard B, Rassow J
& Pfanner N (2000) Membrane potential-driven protein
import into mitochondria. The sorting sequence of
cytochrome b(2) modulates the deltapsi-dependence of
translocation of the matrix-targeting sequence. Mol
Biol Cell 11, 3977–3991.
82 Hill K, Model K, Ryan MT, Dietmeier K, Martin F,
Wagner R & Pfanner N (1998) Tom40 forms the
hydrophilic channel of the mitochondrial import pore
for preproteins. Nature 395, 516–521.
83 Rizzuto R, Brini M & Pozzan T (1994) Targeting
recombinant aequorin to specific intracellular orga-
nelles. Methods Cell Biol 40, 339–358.
84 Voisine C, Craig EA, Zufall N, von Ahsen O, Pfanner
N & Voos W (1999) The protein import motor of mito-
chondria: unfolding and trapping of preproteins are
distinct and separable functions of matrix Hsp70. Cell
97, 565–574.
85 Voos W, Martin H, Krimmer T & Pfanner N (1999)
Mechanisms of protein translocation into mitochon-
dria. Biochim Biophys Acta 1422, 235–254.
86 Park SY, Choi GH, Choi HI, Ryu J, Jung CY & Lee
W (2005) Depletion of mitochondrial DNA causes
impaired glucose utilization and insulin resistance in L6
GLUT4myc myocytes. J Biol Chem 280, 9855–9864.
86a Wei YH, Lee HC (2003) Mitochondrial DNA muta-
tions and oxidative stress in mitochondrial diseases.
Adv Clin Chem 37, 83–128.
86b Hood DA, Adhihetty PJ, Colavecchia M, Gordon JW,
Irrcher I, Joseph AM, Lowe ST, Rungi AA (2003)
Mitochondrial biogenesis and the role of the protein
import pathway. Med Sci Sports Exerc 35, 86–94.
87 Martin I, Giralt M, Vinas O, Iglesias R, Mampel T &
Villarroya F (1995) Co-ordinate decrease in the expres-
sion of the mitochondrial genome and nuclear genes
for mitochondrial proteins in the lactation-induced
mitochondrial hypotrophy of rat brown fat. Biochem J
308, 749–752.
88 Marusich MF, Robinson BH, Taanman JW, Kim SJ,
Schillace R, Smith JL & Capaldi RA (1997) Expression
of mtDNA and nDNA encoded respiratory chain pro-
teins in chemically and genetically-derived Rho0 human
fibroblasts: a comparison of subunit proteins in normal
fibroblasts treated with ethidium bromide and fibro-
blasts from a patient with mtDNA depletion syndrome.
Biochim Biophys Acta 1362 , 145–159.
89 Wang H & Morais R (1997) Up-regulation of nuclear
genes in response to inhibition of mitochondrial DNA
expression in chicken cells. Biochim Biophys Acta 1352,
325–334.
90 Gilkerson RW, Margineantu DH, Capaldi RA &
Selker JM (2000) Mitochondrial DNA depletion causes
morphological changes in the mitochondrial reticulum
of cultured human cells. FEBS Lett 474, 1–4.
91 Appleby RD, Porteous WK, Hughes G, James AM,
Shannon D, Wei YH & Murphy MP (1999) Quantita-
tion and origin of the mitochondrial membrane poten-
tial in human cells lacking mitochondrial DNA. Eur J
Biochem 262, 108–116.
Mitochondrial biogenesis in mtDNA-depleted cells L. Mercy et al.
5054 FEBS Journal 272 (2005) 5031–5055 ª 2005 FEBS
92 Truscott KN, Brandner K & Pfanner N (2003)
Mechanisms of protein import into mitochondria. Curr
Biol 13, R326–R337.
93 Foury F & Kucej M (2002) Yeast mitochondrial bio-
genesis: a model system for humans? Curr Opin Chem
Biol 6, 106–111.
94 Leary SC, Battersby BJ, Hansford RG & Moyes CD
(1998) Interactions between bioenergetics and mito-
chondrial biogenesis. Biochim Biophys Acta 1365,
522–530.
95 Larsson NG, Garman JD, Oldfors A, Barsh GS &
Clayton DA (1996) A single mouse gene encodes the
mitochondrial transcription factor A and a testis-
specific nuclear HMG-box protein. Nat Genet 13, 296–
302.
96 Davis AF, Ropp PA, Clayton DA & Copeland WC
(1996) Mitochondrial DNA polymerase gamma is
expressed and translated in the absence of mitochon-
drial DNA maintenance and replication. Nucleic Acids
Res 24, 2753–2759.
97 Herzig RP, Scacco S & Scarpulla RC (2000) Sequential
serum-dependent activation of CREB and NRF-1 leads
to enhanced mitochondrial respiration through the
induction of cytochrome c. J Biol Chem 275, 13134–
13141.
98 Louet JF, Hayhurst G, Gonzalez FJ, Girard J &
Decaux JF (2002) The coactivator PGC-1 is involved
in the regulation of the liver carnitine palmitoyltrans-
ferase I gene expression by cAMP in combination with
HNF4 alpha and cAMP-response element-binding
protein (CREB). J Biol Chem 277 , 37991–38000.
99 Kim HP, Roe JH, Chock PB & Yim MB (1999) Tran-
scriptional activation of the human manganese super-
oxide dismutase gene mediated by tetradecanoyl-
phorbol acetate. J Biol Chem 274, 37455–37460.
100 Zhang X, Odom DT, Koo SH, Conkright MD,
Canettieri G, Best J, Chen H, Jenner R, Herbolsheimer
E, Jacobsen E et al. (2005) Genome-wide analysis of
cAMP-response element binding protein occupancy,
phosphorylation, and target gene activation in human
tissues. Proc Natl Acad Sci USA 102, 4459–4464.
101 Wang YX, Zhang CL, Yu RT, Cho HK, Nelson MC,
Bayuga-Ocampo CR, Ham J, Kang H & Evans RM
(2004) Regulation of muscle fiber type and running
endurance by PPARdelta. PLoS Biol 2, e294.
102 Voos W, von Ahsen O, Muller H, Guiard B, Rassow
J & Pfanner N (1996) Differential requirement for
the mitochondrial Hsp70-Tim44 complex in unfolding
and translocation of preproteins. EMBO J 15,
2668–2677.
103 Schneider HC, Westermann B, Neupert W & Brunner
M (1996) The nucleotide exchange factor MGE exerts
a key function in the ATP-dependent cycle of
mt–Hsp70–Tim44 interaction driving mitochondrial
protein import. EMBO J 15, 5796–5803.
104 Wiedemann N, Kozjak V, Prinz T, Ryan MT, Meising-
er C, Pfanner N & Truscott KN (2003) Biogenesis of
yeast mitochondrial cytochrome c: a unique relation-
ship to the TOM machinery. J Mol Biol 327, 465–474.
105 King MP & Attardi G (1989) Human cells lacking
mtDNA: repopulation with exogenous mitochondria by
complementation. Science 246, 500–503.
106 Miller BG, Woods RI, Bohlen HG & Evan AP (1982)
A new morphological procedure for viewing micro-
vessels: a scanning electron microscopic study of the
vasculature of small intestine. Anat Rec 203, 493–503.
107 Seed B & Sheen JY (1988) A simple phase-extraction
assay for chloramphenicol acyltransferase activity. Gene
67, 271–277.
108 Bradford MM (1976) A rapid and sensitive method for
the quantitation of microgram quantities of protein
utilizing the principle of protein-dye binding. Anal
Biochem 72, 248–254.
109 Darley-Usmar VM (1987) The molecular aetiology of
human mitochondrial myopathies. Biochem Soc Trans
15, 102–103.
110 Pfanner N & Neupert W (1985) Transport of proteins
into mitochondria: a potassium diffusion potential is
able to drive the import of ADP ⁄ ATP carrier. EMBO
J 4, 2819–2825.
111 Arnould T, Michiels C, Alexandre I & Remacle J
(1992) Effect of hypoxia upon intracellular calcium
concentration of human endothelial cells. J Cell Physiol
152, 215–221.
112 Park KS, Nam KJ, Kim JW, Lee YB, Han CY, Jeong
JK, Lee HK & Pak YK (2001) Depletion of mitochon-
drial DNA alters glucose metabolism in SK-Hep1 cells.
Am J Physiol Endocrinol Metab 280, E1007–E1014.
Supplementary material
The following material is available for this article
online:
Fig. S1. Abundance of the mitochondrial population is
not decreased in mtDNA-depleted cells.
Fig. S2. PGC-1a expression analysis in mtDNA-deple-
ted cells.
Fig. S3. Tom40, the major pore of GIP is over-
expressed in mtDNA-depleted cells.
L. Mercy et al. Mitochondrial biogenesis in mtDNA-depleted cells
FEBS Journal 272 (2005) 5031–5055 ª 2005 FEBS 5055