Accurate modelling of the retention behaviour of peptides in gradient-elution hydrophilic interaction liquid chromatography
Bạn đang xem bản rút gọn của tài liệu. Xem và tải ngay bản đầy đủ của tài liệu tại đây (763.17 KB, 8 trang )
Journal of Chromatography A 1614 (2020) 460650
Contents lists available at ScienceDirect
Journal of Chromatography A
journal homepage: www.elsevier.com/locate/chroma
Accurate modelling of the retention behaviour of peptides in
gradient-elution hydrophilic interaction liquid chromatography
Liana S. Roca a,b,∗, Suzan E. Schoemaker a, Bob W.J. Pirok a,b, Andrea F.G. Gargano a,b,
Peter J. Schoenmakers a,b
a
b
Van ’t Hoff Institute for Molecular Sciences, Science Park 904, 1098 XH Amsterdam, the Netherlands
Centre for Analytical Science Amsterdam, Science Park 904, 1098 XH Amsterdam, the Netherlands
a r t i c l e
i n f o
Article history:
Received 16 August 2019
Revised 18 October 2019
Accepted 22 October 2019
Available online 23 October 2019
Keywords:
HILIC
Retention modelling
Bottom-up proteomics
Mass spectrometry
a b s t r a c t
The applicability of models to describe peptide retention in hydrophilic interaction liquid chromatography (HILIC) was investigated. A tryptic digest of bovine-serum-albumin (BSA) was used as a test sample. Several different models were considered, including adsorption, mixed-mode, exponential, quadratic
and Neue–Kuss models. Gradient separations were performed on three different HILIC stationary-phases
under three different mobile-phase conditions to obtain model parameters. Methods to track peaks for
specific peptides across different chromatograms are shown to be essential. The optimal mobile-phase
additive for the separation of BSA digest on each of the three columns was selected by considering the
retention window, peak width and peak intensity with mass-spectrometric detection. The performance of
the models was investigated using the Akaike information criterion (AIC) to measure the goodness-of-fit
and evaluated using prediction errors. The F-test for regression was applied to support model selection.
RPLC separations of the same sample were used to test the models. The adsorption model showed the
best performance for all the HILIC columns investigated and the lowest prediction errors for two of the
three columns. In most cases prediction errors were within 1%.
© 2019 The Authors. Published by Elsevier B.V.
This is an open access article under the CC BY license. ( />
1. Introduction
Proteomics is a field comprising of different techniques used to
identify and quantify the proteins present in cells, tissues and organisms [1]. A distinction can be made between top-down proteomics [2], where intact proteins are analysed, and bottom-up
proteomics [3], where proteins are first digested to yield peptides,
prior to analysis and interpretation. The identification and quantification is challenging, due to the high complexity of the sample,
especially in bottom-up proteomics, and the great differences in
the relative abundance of proteins in a cell proteome [4]. An indispensable analytical technique in this field is mass spectrometry
(MS). However, data quality can be detrimentally impacted if many
species are infused at the same time. Therefore, MS alone cannot
be used to analyse complex samples, such as whole-cell lysates.
For this reason, separation techniques are typically coupled to MS
analysis, providing the much needed simplification of the sample
prior to its introduction into the MS.
∗
Corresponding author at: Van ’t Hoff Institute for Molecular Sciences, Science
Park 904, 1098 XH Amsterdam, the Netherlands.
E-mail address: (L.S. Roca).
Liquid chromatography (LC) is one of the most frequently employed separation techniques, since it can be directly coupled to
MS. Moreover, for common LC modes employed, little or no additional sample preparation is needed. The most commonly used LC
separation mode for bottom-up proteomics is reversed-phase liquid chromatography (RPLC). In RPLC, analytes are separated based
on differences in partitioning between the hydrophilic (aqueous)
mobile phase and the hydrophobic stationary phase. To facilitate
timely elution of strongly retained analytes from the stationary
phase, the fraction of organic modifier can be gradually increased
using a gradient program. However, one limitation of RPLC is the
lack of separation based on the polar functional groups which are
abundantly present in peptides. Therefore, a complementary technique that would be able to retain polar compounds is needed to
extend the analysis of a proteomic sample. This is especially relevant for multi-dimensional separations, in which two (or three)
vastly different (“orthogonal”) retention mechanisms are employed
to greatly improve the separation of complex mixtures [5,6].
One method with a retention mechanism and selectivity that
is very different from that of RPLC is hydrophilic-interaction liquid chromatography (HILIC). HILIC was introduced as a separation
mode for polar compounds [7], but it is also used as a fractionation
/>0021-9673/© 2019 The Authors. Published by Elsevier B.V. This is an open access article under the CC BY license. ( />
2
L.S. Roca, S.E. Schoemaker and B.W.J. Pirok et al. / Journal of Chromatography A 1614 (2020) 460650
technique for bottom-up proteomics prior to a RPLC separation to
decrease sample complexity [8]. Whereas hydrophobic alkyl-based
stationary-phase chemistries are used in RPLC, HILIC employs a polar stationary phases, such as bare silica, or silica modified with
amide, amino or diol groups [9]. Charged stationary-phases can
also be used such as silica modified with cationic groups (e.g.
poly aspartamide) or zwitterionic groups (e.g. ZIC HILIC). The mobile phases in HILIC mainly comprise of non-polar organic solvents, with small percentages (e.g. 3%) of water or aqueous buffer.
The exact retention mechanism is still being investigated. However,
there is a general consensus that retention is based on partitioning
between an aqueous layer formed on the surface of the stationary
phase and the mostly organic bulk mobile phase, with electrostatic
interactions (ionic interactions and hydrogen bonding) also influencing the retention [7,10,11]. The exact magnitude of the different
interactions highly depends on the employed stationary and mobile phases, but also on the properties of the analyte.
The large influence on retention of the selected stationary
phase, mobile-phase solvent and additives, dramatically complicates method development for HILIC separations. In order to stimulate the proliferation of HILIC, computational tools for method
development are needed. Such tools generally rely on prediction
of retention times with respect to the combination of stationary
phase and mobile phase. Several models have been proposed for
predicting the retention times of peptides, based on their aminoacid composition, sequence and conformation [12–15], assessing
the chemical structure of the analyte to predict retention. However,
the development of such models depends heavily on large numbers of experiments using various mobile and stationary phases.
An alternative approach is based on establishing retention parameters of (unknown) analytes using the concept of so-called
gradient-scanning techniques [16]. Here, the retention times are
recorded for each analyte in a few experiments under pre-set conditions and the resulting data are fed into the underlying retention
model. Entirely theoretical models require a thorough understanding of the underlying retention mechanism, which is challenging
for HILIC. Alternatively, (semi-) empirical models can be used to
describe the data.
Computer-aided method development for HILIC has been extensively studied by several groups [17,18]. Recently, the feasibility
of accurate prediction of retention times of peaks eluting before,
during or after a gradient was demonstrated, using only a small
number of scouting measurements [19]. Several retention models
were investigated and the prediction performance was shown to
depend on the type of stationary-phase chemistry and the mobilephase components. In addition, while the method was found to
have great potential for smaller molecules, such as metabolites,
dyes and tea components, its application for predicting retention
times of peptides proved fruitless. However, in the above study
only a small number of peptide standards were included, which
were not representative of the peptides typically encountered in
bottom-up proteomics.
In this study, we investigate the prediction of retention times of
peptides for a larger number of combinations of stationary-phase
chemistries and mobile-phase additives. A more-complex sample
(Bovine serum albumin digest), is used that is much-more representative of a bottom-up-proteomics sample than is a set of
standard peptides. Also mass-spectrometric detection is employed.
Bovine serum albumin is attractive as a bench mark sample because it is easily available and it includes a sufficient number
of diverse peptides (>40). Moreover, we rigorously evaluate the
contemporary tools used to assess prediction performance. Computer aided method development for HILIC has been massively restricted by shortcomings in retention modelling on certain types
of columns (particularly amide) and for certain types of analytes,
especially peptides. The results of the present work remove these
restrictions. In addition, the results help understand the retention
behaviour in HILIC and they provide means to reduce the uncertainty in peptide identification. Finally, a number of general recommendations for HILIC separations of peptides are proposed.
2. Experimental
2.1. Materials
Milli-Q water (18.2 m ) was obtained from a purification system (Millipore, Bedford, MA, USA). Acetonitrile (ACN, MS grade),
2-propanol (IPA, HPLC grade) and toluene were purchased from
Biosolve Chimie (Dieuze, France). Ammonium formate (AF, BioUltra; ≥ 99%) and ammonium bicarbonate (Bioultra; ≥ 99.5%) were
purchased from Fluka Analytical (Buchs, Switzerland). Acetic acid
(glacial) was obtained from ACROS organics (Geel, Belgium).
The following chemicals were purchased from Sigma-Aldrich
(Darmstadt, Germany), bovine serum albumin (BSA, ≥96%), urea
(bioreagent, ≥ 98%), dithiothreitol (DTT, ≥ 99%), iodoacetamide
(IAA, ≥ 99%), trypsin (BRP), uracyl (≥ 99%), ammonium acetate
(AA, for molecular biology, ≥98%) trifluoroacetic acid (TFA, ≥99%),
Formic acid (FA, Analytical grade; 98%), SPE cartridges (3 mL, C18),
thiourea (GR for analysis ACS) and sodium hydroxide (for analysis).
2.2. Sample preparation
The peptide samples were obtained by trypsin digestion. Denatured protein (100 μL, 10 μg/μL) in urea (6 M) was reduced
with DTT (5 μL, 30 mg/mL in 25 mM ammonium bicarbonate) for
an hour at 37 °C. The protein was alkylated with IAA (20 μL,
36 mg/mL in 25 mM ammonium bicarbonate) for one hour in the
dark at room temperature. Then 20 μL of DTT and 900 μL of
25-mM ammonium-bicarbonate solution and finally trypsin (1:30
weight ratio trypsin:protein) were added. The protein was digested
overnight at 37 °C. The next day TFA (10%, 40 μL) was added to
acidify the sample to pH 2–3 before desalting the peptides using
SPE cartridges (C18). The peptide solution was freeze-dried and reconstituted in 80% ACN, 20% buffer (1 mg/mL) before use.
2.3. Instrumentation
The LC-MS measurements were performed on an Agilent 1100
Series LC system with a quaternary pump (G1311A), an autosampler (G1313A) (Agilent, Waldbronn, Germany) in combination
with a Micro-QTOF from Bruker (Bremen, Germany). The electrospray ionization (ESI) parameters used were end-plate offset
−500 V, capillary voltage 4.4 kV, nebuliser 1 bar, dry gas 8 L/min,
dry temperature 220 °C. Compass Data analysis from Bruker was
used to extract the m/z and retention time information. The dwell
volume of the LC system was experimentally determined to be
0.81 mL and the dead time for the HILIC columns was 0.33 mL,
measured using toluene and an Agilent DAD detector (1-μL flow
cell, 1290 Infinity diode-array detector (G4212A)).
A system comprised of an Eksigent Ekspert nanoLC 425 (Sciex,
Singapore) coupled to a TripleTOF 5600+ mass spectrometer
(Sciex, Singapore) was used for MS/MS measurements for sample
identification. The columns used during this investigation are listed
in Table 1.
2.4. Methods
2.4.1. HILIC separation of peptides
Three different columns were chosen for the HILIC separations,
W-silica (Waters), Z-silica (Zorbax) and amide. The effect of mobile phase additives on the retention and selectivity of the HILIC
column was investigated using formic acid or two buffers, 10 mM
L.S. Roca, S.E. Schoemaker and B.W.J. Pirok et al. / Journal of Chromatography A 1614 (2020) 460650
3
Table 1
Columns used for the separation of BSA digest.
Column
Brand and type of stationary phase
Selectivity
Designation
Dimensions (mm)
Particle size (μm)
˚
Pore size (A)
1
2
3
4
5
Waters, Acquity, BEH
Waters, Atlantis
Agilent, Zorbax, HILIC Plus
Phenomenex∗ , Kinetex
In house packed, Magic C18∗∗
Amide
Silica
Silica
RP
RP
Amide
W-silica
Z-silica
XB-C18
M-C18
2.1 × 150
2.1 × 150
2.1 × 150
4.6 × 150
0.075×100
1.7
3
1.8
3.5
5
130
100
95
100
100
∗
∗∗
Phenomenex (Torrance, CA, USA).
NanoLCMS Solutions (Oroville, CA, USA).
ammonium formate, pH 3, and 10 mM ammonium acetate, pH 6.
These conditions were selected based on the MS compatibility of
the volatile additives and their useful pH range (within the working pH range of the columns), and to observe the effect of using
a buffer compared to only an acidic environment. At acidic pH the
silanol groups present in the stationary phase will be protonated,
thus minimizing electrostatic interactions. All the HILIC columns
were chosen to have the same dimensions, but the particle size
varied (see Table 1). Bovine serum albumin (BSA) digested with
trypsin was used to provide a good range of peptides with varying properties and concentrations.
For each combination of mobile and stationary phase, six gradients were measured. Mobile-phase A was always 97% ACN with
3% water or buffer and B was 100% water or buffer. In the case of
formic acid 0.3% (volume) was added to both A and B. The initial condition, isocratic 100% A was held for 0.25 min. This was
followed by a linear gradient from 0% B to 40% B (amide and Zsilica column) or 50% (W-silica) in 10, 17, 30, 52, 70 or 80 min.
The final condition was maintained for 1 min (amide and Z-silica)
or 5 min (W-silica), after which the system was switched back to
the initial conditions in 1 min. The equilibration time was set to
30 min (amide) or 50 min (Z-silica and W-silica). The flow rate was
0.2 mL/min. The sample was dissolved in 80% ACN 20% buffer with
a concentration of 1 mg/mL. The injection volume was 5 μL for the
three shortest gradients and 10 μL for the three longest gradients
to overcome the problem of dilution.
In order to identify the peptides in the gradient runs, the same
sample was measured on C18 column 75 μm ID 10 cm length (MC18) coupled to a high-resolution mass spectrometer. The peptides
identified using MS/MS were compared to peptides measured on
the microQTOF and were considered a match if the m/z value was
within 0.02 of the MS/MS identified peptides. A list of 15 peptides
was constructed by comparing measurements with all stationaryphases and seven of these were selected to show the influence of
mobile-phase additives due to their similar intensity.
The separation method was developed initially for the amide
column and then adapted for the silica columns. A scouting gradient from 97% ACN to 40% ACN was used and the final solvent composition was adjusted to improve the peak spreading. The equilibration time was initially set to 20 min and then increased to
30 min. With this later duration significant variations were observed in the retention times for triplicate measurements. Therefore the column was considered to be well equilibrated. Changes
had to be made during measurements for the other columns. In
the case of the Z-silica column, a peak shift was noticed between triplicate measurements. Therefore, the equilibration time
after each run was increased. For the W-silica column, carry-over
and peak shifting were observed, and therefore the final percentage of aqueous eluent was increased and the equilibration time
was chosen the same as for the Z-silica column. The equilibration
time has previously [20] been correlated to the water uptake capability of the stationary phase, with faster equilibration corresponding to higher water uptake. The amide stationary phases were reported to have the highest water uptake followed by bare silica,
which was in line with our observations.
2.4.2. RPLC separation of peptides
BSA digest was separated on an RPLC column using the same
linear gradient lengths as for HILIC, with 0.1% FA in water and with
10 mM ammonium formate pH 3 buffer as mobile phase A and
80% ACN mobile-phase B. The flow-rate used was 0.4 mL/min since
the internal diameter was larger than that of the HILIC columns
(4.6 mm). The gradient ran from 5% to 60% B, followed by a 10 min
equilibration. We observed a slight decrease in retention when using buffer. However, the resolution between some peptides was increased.
2.5. Data processing and retention modelling
The data were processed using Compass Data Analysis from
Bruker and PIOTR [21]. A longer gradient (52 min or 70 min) was
chosen from each data set and the dissect option was used to obtain the m/z and retention-time list. The m/z values were assigned
to a peptide sequence using MS/MS measurements with the same
sample on the Sciex TripleTOF 5600+ MS. The MS confidence of
identification was chosen to be 95% or above and no modifications were considered. The observed ions in the HILIC measurements were matched to a peptide sequence if the value was within
0.02 m/z. Once the longer gradient was assigned, the same peptide
list was searched in the other gradients using extracted-ion chromatograms (EIC). A unique list for all the columns of 15 peptides
was obtained after processing all the data sets. Peak lists consisting of the retention time of each peptide for each gradient experiment were prepared for each column. These data were supplied to
the PIOTR program to fit the different retention models. The computational approach has been explained previously [19,21]. Briefly,
the retention models were used to calculate the model coefficients
and the goodness-of-fit values, to compute the F-test of regression,
and to predict retention. For the Z-silica and W-silica columns the
10-min gradient gave rise to a high degree of co-elution, which
hindered peak detection and diminished the accuracy of the extracted retention times. Therefore, only five gradients were used in
the analysis for these columns.
3. Results and discussion
3.1. Effect of additives in HILIC separation of peptides
Among the conditions explored – three different columns
(amide and two B type silica stationary phases) and three mobilephase additives (0.3% formic acid, 10 mM ammonium acetate pH 6,
10 mM ammonium formate pH3) – not all chromatograms showed
good chromatography, in terms of retention and peak shape. Therefore, we first set out to establish the optimal combinations of
columns and additives (Fig. 1). For this purpose, we compared
the peak width, peak intensity and elution window for each of
the conditions (see Table 2). The performance of the amide column was good with all three mobile-phase additives. When using a buffer (ammonium acetate and formate), slightly sharper
peaks were obtained. However, the intensity decreased by one order of magnitude. Retention was also affected by the use of buffers.
4
L.S. Roca, S.E. Schoemaker and B.W.J. Pirok et al. / Journal of Chromatography A 1614 (2020) 460650
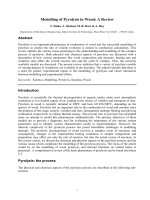
Fig. 1. Optimal conditions for the separation of BSA digest on the amide column (red, top), Z-silica column (blue, middle), W-silica column (purple, bottom). For details see
text. Analyte peptides: 1. m/z = 1002.5830, 2. m/z = 740.4014, 3. m/z = 509.2956, 4. m/z = 789.4716, 5. m/z = 689.3729, 6. m/z = 922.4880, 7. m/z = 571.8608. (For interpretation
of the references to colour in this figure legend, the reader is referred to the web version of this article.)
Table 2
Seven peptides that were used to assess the optimal mobile-phase additive for the HILIC separation. The 30 min gradient duration measurements were
used. FA = formic acid, AF = ammonium formate, AA = ammonium acetate.
Column/additive
Max tR (min)
Min tR (min)
Retention window (min)
Average peak height (counts) ×103
Average peak width (min)
Amide FA
Amide AF
Amide AA
W-silica FA
W-silica AF
W-silica AA
Z-silica FA
Z-silica AF
Z-silica AA
29.70
31.54
32.60
23.18
28.89
39.64
28.41
34.97
37.21
21.71
24.49
15.86
17.27
21.64
21.60
19.86
25.03
24.33
7.99
7.04
16.74
5.90
7.25
18.04
8.55
9.93
12.88
56.3
6.74
20.2
83.7
24.2
49.5
9.91
39.2
27.9
0.133
0.114
0.124
0.185
0.157
0.201
0.225
0.125
0.223
Formic acid gave rise to the lowest retention, followed by ammonium acetate and then ammonium formate (Fig. S1). This could be
explained by an expansion of the water layer when using buffers.
Dinh et al. [20] showed that when ammonium acetate (5–50 mM)
was added to the ACN/water mobile phase, the ions were adsorbed
on the surface of the stationary phase. The authors observed an increase in the water layer of up to 50% for bare silica phases. The
elution order was also found to vary with varying conditions. Due
to the higher signal intensity and adequate resolution, formic acid
was chosen as the optimal additive for the amide stationary phase.
The Z-silica column required a buffer for the elution and separation of the peptides (Fig. S2). Therefore, the separations using
formic acid as additive were not considered for modelling. The
elution order was the same with the two buffers. However, with
ammonium acetate the peaks were tailing and the resolution was
decreased. At pH = 6 a significant fraction of the silanol groups
will be dissociated, whereas some groups (arginines, lysines and
histidines) on the peptides may still be positively charged. This
creates a strong ion-exchange contribution to a mixed retention
mechanism, which may explain the tailing. Therefore, ammonium
formate was chosen as the optimal additive for the Z-silica column.
Finally, also the separations using the W-silica column required
a buffer (Fig. S3) [22]. Good peak shapes were obtained with both
buffers. The elution order was also the same, with the exception of
two peptides (3 and 5), which showed a decreased retention with
ammonium formate. Both peptides had a theoretical pI of about
9.7 (basic). McCalley showed previously that for this silica column
the retention of basic solutes increased when increasing the pH
L.S. Roca, S.E. Schoemaker and B.W.J. Pirok et al. / Journal of Chromatography A 1614 (2020) 460650
5
from 3 to 6 [23]. The number of negatively charged silanol groups
at the surface increases at higher pH, providing stronger interaction with the positively charged solutes. Ammonium acetate (pH 6)
gave higher retention and a better resolution. Hence, it was chosen
as the optimal buffer.
and KQTALVELLK were removed from the final results due to large
variations in the AIC values and prediction errors. The AIC values were calculated and predictions were performed using the inhouse-developed Matlab program PIOTR [21].
The AIC parameter is calculated as follows.
3.2. Retention modelling
AIC = 2 pm + n ln
The models used to fit the data were the exponential, mixedmode, adsorption, quadratic and Neue–Kuss models.
The exponential model has been shown to fit RPLC data
[24] and has the following form
where n is the number of input data points, pm is the number of
parameters of the model and SSQ is the sum of squared errors. By
using this value, we can compare models that have different numbers of parameters. A good fit is indicated by a small, often negative, AIC value. Each peptide considered gives an AIC value for each
model. Therefore, we considered the average values and the standard deviations across all peptides. The AIC value itself does not
provide any qualitative information about the fit. AIC values can
only be used to relatively compare a series of values. Even then,
as can also be seen in Fig. 3, the AIC values are not always conclusive, especially not when a large standard deviation is observed.
Therefore, we also considered the average error of prediction and
the F-test of regression to draw clear conclusions.
ln k = ln k0 − S
φ
(1)
where k0 represents the extrapolated retention of an analyte at
φ = 0 (100% water in case of RPLC) and S the so-called “solventstrength parameter”, describing the change in retention with increasing concentration (volume fraction) of strong solvent (φ ).
The adsorption model is typically used to describe normalphase separations [25].
ln k = ln k0 − n lnφ
(2)
Here, n is meant to represent the ratio between the surface occupied by the analyte molecules and the molecules of strong solvent.
The mixed-mode model is a combination of the previous two
models and is thought to take into account both partitioning and
adsorption [26].
ln k = ln k0 + S1 φ + S2 lnφ
(3)
The quadratic model was developed to characterize retention
over a larger range of mobile-phase compositions [27].
ln k = ln k0 + S1 φ + S2
φ2
(4)
The Neue–Kuss model is an empirical model that can easily be
integrated to predict retention under gradient conditions [28].
ln k = ln k0 + 2ln(1 + S2 φ ) −
S1 φ
1 + S2 φ
(5)
This study was conducted using retention times obtained from
gradient-elution runs. Thus, the retention models were applied for
gradient separations as described previously [19]. For the mixedmode and quadratic model the gradient equation cannot be solved.
Therefore, a numerical approach based on the Simpsons’ approximation was applied.
The PIOTR program was used to fit these different retention
models to the experimental data for each analyte. We have previously described this approach to establish the retention parameters [19,21]. Briefly, PIOTR utilizes a non-linear programming solver
which searches for the minimum residuals. In essence, the constants (e.g. lnk0 and S for the exponential model) are varied until the simulated result matches the experimental retention times
with a minimum of residual error. This is carried out within the
constraints of the applied gradient to record the experimental data.
The goodness of fit of the five models was determined using the
Akaike information criterion (AIC) [29]. The minimum number of
scouting gradients needed was three to fit all the models since the
quadratic, mixed-mode and Neue–Kuss contain three parameter
model coefficients. The retention time of the peptides under different gradient conditions were used as the input data. The data sets
contained 15 peptides, analysed with the three HILIC columns run
at optimal conditions as described in the previous section and one
RPLC column. The 15 peptides featured different properties with
regard to length, amino-acid composition, net charge, pI, and the
grand average of hydropathicity index (GRAVY). The properties of
the peptides can be found in Table 3. Peptides KVPQVSTPTLVEVSR
2π ∗ SSQ
n
+1
(6)
3.3. RPLC retention modelling
Separation of BSA digest with reversed-phase liquid chromatography was performed to facilitate the identification of the peptides
using existing libraries on the Triple TOF instrument. RPLC data
were also used to verify the functionality of the models and to
compare the selectivity with the HILIC separations. RPLC has been
extensively characterized [30] and the retention of the analyses can
be accurately described by an exponential model (Eq. (1)).
Using the same procedures for the data treatment as outlined
in Section 2.6 we calculated the goodness of fit and prediction errors with the five models. We observed that only the exponential, mixed-mode and quadratic models performed well, showing
low prediction errors ( ≤ 0.5%) and negative AIC values (Fig. 2).
The adsorption and Neue–Kuss models did not perform well. When
inspecting the models (Section 3.2), we observed that the three
equations that provided a good fit shared the terms of the exponential model, with one extra parameter in the case of the mixedmode and quadratic models. The mixed-mode and the quadratic
models can be viewed as the exponential model when considering only the first two parameters. This could be an indication that
the third parameter does not contribute significantly to the performance of the model. To test this hypothesis, we looked into the
influence of the third parameter by using the statistical F-test for
regression [31]. In contrast to the AIC value, this statistical F-test
does not assess the fit in general. Instead, it allows a comparison
of a model with a reduced version. For example, the exponential
model (Eq. (1)) can be seen as a reduced version of the quadratic
model (Eq. (4)), differing by one term. The F-test can be used to
compare the residual sum-of-squares of the full model (SSres, full )
with that of the reduced model (SSres, red ) and consequently determine the significance of the additional parameter. This is shown in
Eq. (7)
F=
SSres,
MSres,diff
=
MSres,full
f ull
− SSres,red /(d fred − d ffull )
SSres,full /d ffull
(7)
where MS denotes the mean squares and dfred and dffull are the degrees of freedom of the reduced and full model, respectively. Using
PIOTR, the cumulative distribution function of the F-distribution is
assessed to yield a p value. If the p value is statistically significant
(<0.05), then this indicates that the additional term (and thus the
full model) is statistically significant. It is good to emphasize that
this specific F-test provides no information on the goodness-of-fit.
6
L.S. Roca, S.E. Schoemaker and B.W.J. Pirok et al. / Journal of Chromatography A 1614 (2020) 460650
Table 3
Peptides used for the retention modelling; Properties were obtained from [32].
Sequence
m/z
Measured charge
MW
pI
GRAVY index
LGEYGFQ
GFQNALIVR
FWGK
KQTALVELLK
TDLTK
LVNELTEFAK
AWSVAR
STVFDK
GLVLIAF
LGEYGFQNALIVR
LVTDLTK
KVPQVSTPTLVEVSR
AEFVEVTK
LVVSTQTALA
QTALVELLK
407.193
509.296
537.282
571.861
577.319
582.319
689.373
696.356
732.465
740.401
789.472
820.473
922.488
1002.583
1014.619
2+
2+
1+
2+
1+
2+
1+
1+
1+
2+
1+
2+
1+
1+
1+
812.369
1016.575
536.274
1141.705
576.310
1162.621
688.364
695.347
731.456
1478.786
788.462
1638.928
921.479
1001.574
1013.61
4.00
9.75
8.75
8.59
5.50
4.53
9.79
5.55
5.52
6.00
5.84
8.75
4.53
5.52
6.00
−0.35
0.57
–
0.19
−1
0.13
0.26
−0.31
2.92
0.29
0.42
−0.06
0.17
1.39
0.64
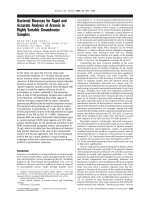
Fig. 2. BSA digest separation of XB-C18; left: average AIC values and right: errors in prediction expressed in % of mobile-phase B; 3 input gradients were used 17, 52 and
80 min duration and 30 min gradient was predicted.
All the values obtained were added in the supplementary information (Table S1). The minimum p values obtained were 0.26
for the mixed-mode and 0.51 for the quadratic model. From this it
can be concluded that the added contribution of the third parameter in the mixed-mode and quadratic models was not statistically
significant.
3.4. HILIC – goodness of fit
Firstly, we investigated how the number of input gradients affect the AIC values. We observed that the standard deviation decreased significantly when four gradients were used as input instead of three (Fig. S5), whereas only a slight additional decrease
was observed when five input gradients were used (Fig. S6). The
differences were more noticeable for the quadratic and Neue–Kuss
models. Based on these observations, we used four input gradients
to decide on the best model(s) to describe our data (Fig. 3).
Secondly, we investigated which model yielded the lowest AIC
average for each column. For the amide and Z-silica columns, the
lowest AIC values were obtained with the adsorption model with
relatively low standard deviations (2.15 and 1.18 respectively). For
the W-silica the lowest values were for the quadratic model. However, it showed a large standard deviation (11.04). The second lowest AIC average value was obtained with the adsorption model,
with a much lower standard deviation (3.88). Therefore, we concluded that for all columns the adsorption model could best be
used to accurately fit the data.
Fig. 3. AIC values and standard deviations for five models on three different
columns, obtained using gradients of 17, 52, 70 and 80 min duration.
3.5. HILIC – retention-time prediction
Prediction of retention times is an important tool in method
development. An accurate model and a small number of scouting
L.S. Roca, S.E. Schoemaker and B.W.J. Pirok et al. / Journal of Chromatography A 1614 (2020) 460650
7
The W-silica column showed a very high error of prediction
for the Neue–Kuss model and a large standard deviation for the
quadratic model. Therefore, these models were not further considered. When inspecting the other three models, the mixed-mode
model showed a larger standard deviation, whereas the exponential and adsorption models exhibited a relatively narrow range of
errors. The contribution of the third parameter in the mixed-mode
compared to the adsorption model was found to be insignificant,
with a lowest p value of 0.3. Among the exponential and adsorption models, the latter showed lower prediction errors (i.e. ≤
0.36%). Hence, it was considered the best model for prediction.
4. Concluding remarks
Fig. 4. The error in prediction of a 30 min gradient for the separation of BSA digest
expressed in mobile-phase B composition in the three HILIC columns. The input
gradients used were 17, 52, 80 min duration.
gradients may suffice to optimize a separation. We used prediction
of retention times for the three HILIC columns to validate the results obtained from the goodness-of-fit for the five tested models.
As previously, when investigating AIC values, we explored three or
four gradients as inputs and we attempted to predict one of the
measured gradients that were not used as an input. In Fig. 4 the results for the three-gradient-input are shown. The results obtained
with four-gradient-input data are shown in supplementary material (Fig. S7). We observed that there is no significant gain in accuracy from adding a fourth input gradient for prediction. Therefore,
only three measurements suffice for prediction. The column with
the lowest error of prediction was the amide column, followed by
W-silica and then Z-silica.
The amide column showed average prediction errors close to 0
for the adsorption (0.08%), quadratic (0.35%) and Neue–Kuss (0.2%)
models. However, the standard deviations for the latter two models were larger. The exponential model showed standard deviations
similar to the adsorption model. However, the average error was
larger (0.36%). The mixed-mode model showed errors in prediction
up to 0.8%. The significance of the third parameter to the model
performance was calculated for the quadratic compared to exponential model and mixed-mode compared to adsorption model.
There was no significant gain from adding a third parameter for
the adsorption model (lowest p value was 0.31). However, for six
of the thirteen peptides, the third factor in the quadratic model did
prove to be significant (p values ≤ 0.01). Ultimately, the adsorption
model was found to be the most suitable for retention-time prediction of peptides on the amide column. This model was previously
also found suitable for predicting the retention of small molecules
[19].
The Z-silica column was found to give rise to a systematic error, with all models showing an average prediction error close to
0.5 min. The exponential model showed an average prediction error closer to zero (1.36%). We evaluated the significance of the
third parameter in the quadratic model compared to the log-linear
model. The p values for all the peptides were above 0.05, with 0.1
being the minimal value, thus indicating no significant contribution. When comparing the adsorption model with the mixed-mode
model, no significance of the third parameter was observed either
(lowest p value was 0.44). The exponential model performed reasonably well. However, the adsorption model may still be preferred
since the difference in prediction error was just 0.5%.
In this work, we have investigated the retention of peptides in
HILIC and we have explored five models to fit the data. The performance of the models was characterized by the Akaike information
criterion (AIC) to determine the goodness of fit and evaluated using
prediction errors. Optimal separation for a BSA digest was obtained
using formic acid as additive for an amide column, ammonium formate (pH = 3) for a Z-silica (Zorbax) column, and ammonium acetate (pH = 6) for W-silica column (Waters-Atlantis). Equilibration
times were also different for the different stationary phases, with
the shortest time needed for the amide column.
RPLC experiments were performed as a benchmark to test the
modelling procedures, as well as to aid in identifying the peptides
in the protein digest sample. The best fit to the data was obtained
with the exponential model, as expected, but the mixed-mode and
quadratic models also performed adequately. By computing the Fstatistic for regression we noted that the third parameter of these
latter two models did not have a significant influence on the model
performance. Therefore, these models behave like the exponential
model and the added complexity has no significant benefits.
The goodness of fit values indicated that the adsorption model
was the most suitable to describe retention of peptides using the
three HILIC columns. At least four input gradients were needed
to obtain reliable model coefficients for the quadratic and Neue–
Kuss models, whereas three input gradients were sufficient for the
mixed-mode, adsorption and exponential models. The adsorption
model gave the lowest AIC values with the smallest standard deviations.
We were able to predict the retention times of peptides on all
three stationary-phases with errors below 2%. The amide column
had the smallest average errors in prediction with the adsorption
model (0.08%), followed by the W-silica column with average prediction errors of 0.78%. The Z-silica column showed higher prediction errors for all the models, exhibiting a systematic error. On this
latter column the prediction error for the adsorption model was
1.76%, while the lowest errors were observed for the exponential
model with 1.36%.
There have been previous studies for retention models applied
ˇ
in HILIC separations. Cesla
et al. [18] have concluded that for the
isocratic separation of malto-oligosaccharides in HILIC the mixedmodel provided the best fit of the data, yielding the lowest AIC
values and prediction errors. Tyteca et al. [17] proposed the same
model for isocratic separations of acidic, basic and neutral small
molecules. However, for gradient separations they found the Neue–
Kuss model to be more suitable, because it allowed analytical integration to obtain gradient retention times. The use of a large number of measurements used in the above mentioned experiments
could possibly explain the better functioning of the Neue–Kuss empirical model. However, for a limited number of scouting gradients Pirok et al. [19] showed a poor performance of the Neue–Kuss
model, with the adsorption model providing a better fit and yielding lower prediction errors for a variety of small molecules.
8
L.S. Roca, S.E. Schoemaker and B.W.J. Pirok et al. / Journal of Chromatography A 1614 (2020) 460650
Based on the results reported previously in a study involving
small-molecule analytes [19] and the results reported in this paper, we recommend that the adsorption model be used to describe
retention in HILIC, unless specific information is available to support the suitability of other models.
Declaration of Competing Interest
The authors declare that they have no known competing financial interests or personal relationships that could have appeared to
influence the work reported in this paper.
Acknowledgements
The STAMP project is funded under Horizon 2020 – Excellent
Science – European Research Council (ERC), Project 694151. The
sole responsibility of this publication lies with the authors. The European Union is not responsible for any use that may be made of
the information contained therein.
We acknowledge Stef R. A. Molenaar for his assistance with
computations.
Supplementary materials
Supplementary material associated with this article can be
found, in the online version, at doi:10.1016/j.chroma.2019.460650.
References
[1] A.A. Lobas, L.I. Levitsky, A. Fichtenbaum, A.K. Surin, M.L. Pridatchenko, G. Mitulovic, A.V. Gorshkov, M.V. Gorshkov, Predictive liquid chromatography of
peptides based on hydrophilic interactions for mass spectrometry-based proteomics, J. Anal. Chem. 72 (2017) 1375–1382, doi:10.1134/S1061934817140076.
[2] T.K. Toby, L. Fornelli, N.L. Kelleher, Progress in top-down proteomics and the
analysis of proteoforms, Annu. Rev. Anal. Chem. 9 (2017) 499–519, doi:10.1146/
annurev- anchem- 071015-041550.
[3] B. Zhan, J.R. Yates, M.-.C. Baek, Y. Zhang, B.R. Fonslow, Protein analysis by
shotgun/bottom-up proteomics, Chem. Rev. 113 (2013) 2343–2394, doi:10.
1021/cr3003533.
[4] R. Aebersold, M. Mann, Nature (2003) 422 01511, doi:10.1007/
978- 1- 4939- 7804- 5_9.
[5] M. Gilar, P. Olivova, A.E. Daly, J.C. Gebler, Orthogonality of separation in twodimensional liquid chromatography, Anal. Chem. 77 (2005) 6426–6434, doi:10.
1021/ac050923i.
[6] T. Kislinger, A.O. Gramolini, D.H. MacLennan, A. Emili, Multidimensional protein identification technology (MudPIT): technical overview of a profiling
method optimized for the comprehensive proteomic investigation of normal
and diseased heart tissue, J. Am. Soc. Mass Spectrom. (2005), doi:10.1016/j.
jasms.2005.02.015.
[7] A.J. Alpert, Hydrophilic-interaction chromatography for the separation of peptides, nucleic acids and other polar compounds, J. Chromatogr. A (1990),
doi:10.1016/S0 021-9673(0 0)96972-3.
[8] P.J. Boersema, N. Divecha, A.J.R. Heck, S. Mohammed, Evaluation and optimization of ZIC-HILIC-RP as an alternative MudPIT strategy, J. Proteome Res.
6 (2007) 937–946, doi:10.1021/pr060589m.
[9] P. Hemström, K. Irgum, Hydrophilic interaction chromatography, J. Sep. Sci. 29
(2006) 1784–1821, doi:10.1002/jssc.200600199.
[10] D.V. McCalley, Study of the selectivity, retention mechanisms and performance
of alternative silica-based stationary phases for separation of ionised solutes in
hydrophilic interaction chromatography, J. Chromatogr. A (2010), doi:10.1016/j.
chroma.2010.03.011.
[11] P. Jandera, Stationary and mobile phases in hydrophilic interaction chromatography: a review, Anal. Chim. Acta 692 (2011) 1–25, doi:10.1016/j.aca.2011.02.
047.
[12] T. Baczek, P. Wiczling, M. Marszałł, Y. Vander Heyden, R. Kaliszan, Prediction of
peptide retention at different HPLC conditions from multiple linear regression
models, J. Proteome Res. 4 (2005) 555–563, doi:10.1021/pr049780r.
[13] M. Gilar, A. Jaworski, Retention behavior of peptides in hydrophilic-interaction
chromatography, J. Chromatogr. A 1218 (2011) 8890–8896, doi:10.1016/j.
chroma.2011.04.005.
[14] O.V. Krokhin, P. Ezzati, V. Spicer, Peptide retention time prediction in hydrophilic interaction liquid chromatography: data collection methods and features of additive and sequence-specific models, Anal. Chem. 89 (2017) 5526–
5533, doi:10.1021/acs.analchem.7b00537.
[15] M. Taraji, P.R. Haddad, R.I.J. Amos, M. Talebi, R. Szucs, J.W. Dolan, C.A. Pohl,
Prediction of retention in hydrophilic interaction liquid chromatography using
solute molecular descriptors based on chemical structures, J. Chromatogr. A
1486 (2017) 59–67, doi:10.1016/j.chroma.2016.12.025.
[16] P.J. Schoenmakers, Á. Bartha, H.A.H. Billiet, Gradien elution methods for predicting isocratic conditions, J. Chromatogr. A 550 (1991) 425–447, doi:10.1016/
S0021- 9673(01)88554- X.
[17] E. Tyteca, A. Périat, S. Rudaz, G. Desmet, D. Guillarme, Retention modeling
and method development in hydrophilic interaction chromatography, J. Chromatogr. A 1337 (2014) 116–127, doi:10.1016/j.chroma.2014.02.032.
ˇ
ˇ
[18] P. Cesla,
N. Vanková,
J. Krˇenková, J. Fischer, Comparison of isocratic retention
models for hydrophilic interaction liquid chromatographic separation of native
and fluorescently labeled oligosaccharides, J. Chromatogr. A 1438 (2016) 179–
188, doi:10.1016/j.chroma.2016.02.032.
[19] B.W.J. Pirok, S.R.A. Molenaar, R.E. van Outersterp, P.J. Schoenmakers, Applicability of retention modelling in hydrophilic-interaction liquid chromatography for
algorithmic optimization programs with gradient-scanning techniques, J. Chromatogr. A 1530 (2017) 104–111, doi:10.1016/j.chroma.2017.11.017.
[20] N.P. Dinh, T. Jonsson, K. Irgum, Water uptake on polar stationary phases under
conditions for hydrophilic interaction chromatography and its relation to solute retention, J. Chromatogr. A 1320 (2013) 33–47, doi:10.1016/j.chroma.2013.
09.061.
[21] B.W.J. Pirok, S. Pous-Torres, C. Ortiz-Bolsico, G. Vivó-Truyols, P.J. Schoenmakers, Program for the interpretive optimization of two-dimensional resolution,
J. Chromatogr. A 1450 (2016) 29–37, doi:10.1016/j.chroma.2016.04.061.
[22] J.C. Heaton, J.J. Russell, T. Underwood, R. Boughtflower, D.V. McCalley, Comparison of peak shape in hydrophilic interaction chromatography using acidic
salt buffers and simple acid solutions, J. Chromatogr. A 1347 (2014) 39–48,
doi:10.1016/j.chroma.2014.04.026.
[23] D.V. McCalley, Study of retention and peak shape in hydrophilic interaction
chromatography over a wide pH range, J. Chromatogr. A 1411 (2015) 41–49,
doi:10.1016/j.chroma.2015.07.092.
[24] L.R. Snyder, J.W. Dolan, J.R. Gant, Gradient elution in high-performance
liquid chromatography, J. Chromatogr. A 165 (1979) 3–30, doi:10.1016/
s0 021-9673(0 0)85726-x.
[25] L.R. Snyder, H. Poppe, Mechanism of solute retention in liquid—solid chromatography and the role of the mobile phase in affecting separation: competition versus “sorption,”, J. Chromatogr. A 184 (1980) 363–413, doi:10.1016/
S0 021-9673(0 0)93872-X.
[26] G. Jin, Z. Guo, F. Zhang, X. Xue, Y. Jin, X. Liang, Study on the retention equation
in hydrophilic interaction liquid chromatography, Talanta 76 (2008) 522–527,
doi:10.1016/j.talanta.2008.03.042.
[27] P.J. Schoenmakers, H.A.H. Billiet, R. Tijssen, L. De Galan, Gradient selection in
reversed-phase liquid chromatography, J. Chromatogr. A 149 (1978) 519–537,
doi:10.1016/S0 021-9673(0 0)810 08-0.
[28] U.D. Neue, H.J. Kuss, Improved reversed-phase gradient retention modeling, J.
Chromatogr. A 1217 (2010) 3794–3803, doi:10.1016/j.chroma.2010.04.023.
[29] H. Akaike, A new look at the statistical model identification, IEEE Trans. Autom.
Control 19 (1974) 716–723, doi:10.1109/TAC.1974.1100705.
[30] D. Carr, The handbook of analysis and purification of peptides and proteins by
reversed-phase HPLC, GraceVydac 3 (2002), doi:10.1109/MAP.1972.27137.
[31] G.E.P. Box, J.S. Hunter, W.G. Hunter, Statistics for Experimenters, second ed.,
Wiley, 2005.