Strategy for stereospecific characterization of natural triacylglycerols using multidimensional chromatography and mass spectrometry
Bạn đang xem bản rút gọn của tài liệu. Xem và tải ngay bản đầy đủ của tài liệu tại đây (4.91 MB, 9 trang )
Journal of Chromatography A 1641 (2021) 461992
Contents lists available at ScienceDirect
Journal of Chromatography A
journal homepage: www.elsevier.com/locate/chroma
Strategy for stereospecific characterization of natural triacylglycerols
using multidimensional chromatography and mass spectrometry
Marika Kalpio∗, Kaisa M. Linderborg, Mikael Fabritius, Heikki Kallio, Baoru Yang
Food Chemistry and Food Development, Department of Life Technologies, University of Turku, FI-20014 Turku, Finland
a r t i c l e
i n f o
Article history:
Received 8 December 2020
Revised 4 February 2021
Accepted 9 February 2021
Available online 12 February 2021
Keywords:
chiral chromatography
direct inlet tandem mass spectrometry
enantiomeric separation
sample recycling
sea buckthorn
triacylglycerol
a b s t r a c t
Stereoisomeric determination of individual triacylglycerols (TAGs) in natural oils and fats is a challenge
due to similar physicochemical properties of TAGs with different fatty acid combinations. In this study,
we present a strategy to resolve the enantiomeric composition of nutritionally important TAGs in sea
buckthorn (Hippophaë rhamnoides) as an example food matrix. The targeted strategy combines 1) fatty
acid profiling with GC, 2) separation of TAGs with RP-HPLC, 3) stereospecific separation with chiralphase HPLC and 4) structural characterization with MS. Three major asymmetric diacid- and triacid-TAG
species were analyzed in sea buckthorn pulp oil. Off-line coupling of RP-HPLC and chiral-phase HPLC
allowed separation of several TAG regioisomers and enantiomers, which could not be resolved using onedimensional techniques. Enantiomeric ratios were determined and specific structural analysis of separated
TAGs was performed using direct inlet ammonia negative ion chemical ionization method.
Of the TAG 16:0/16:1/16:1 palmitic acid (C16:0) was located predominantly in a primary position and
the enantiomeric ratio of TAG sn-16:1-16:1-16:0 to sn-16:0-16:1-16:1 was 70.5/29.5. Among the TAGs
16:0/16:0/18:2 and 16:0/16:0/16:1, only ca 5% had C16:0 in the sn-2 position, thus, ca 95% were symmetric
sn-16:0-18:2-16:0 and sn-16:0-16:1-16:0. The enantiomeric ratio of triacid-TAGs containing C16:0 and two
unsaturated fatty acids (palmitoleic C16:1, oleic C18:1 or linoleic acids C18:2) could not be resolved due to
lack of commercial enantiopure reference compounds. However, it became clear that the targeted strategy
presented offer unique and convenient method to study the enantiomeric structure of individual TAGs.
© 2021 The Authors. Published by Elsevier B.V.
This is an open access article under the CC BY license ( />
1. Introduction
Scientists over decades have investigated research strategies on
the fatty acids in the three sn-positions of triacylglycerols (TAGs) in
natural fats and oils [1]. These methods of analysis are of importance, as both the fatty acids and their specific distribution in TAGs
influence the nutritional value as well as the biochemical and technological properties of fats and oils [2–7]. Unique, species-specific
structures are formed in TAG biosynthesis, in which three acyltransferases specifically esterify each of the hydroxyl positions of
the glycerol backbone resulting in non-random fatty acid combinations [8].
Studies introducing methods for stereospecific analysis of TAGs
rely largely on enzymatic [9] and chemical [10–12] hydrolysis
∗
Corresponding author. Phone: +358 29 450 50 0 0, ORCID: 0 0 0 0-0 0 02-71957825.
E-mail address: marika.kalpio@utu.fi (M. Kalpio).
followed by different chromatographic and chiral separations of
mono- or diacyl-sn-glycerols [13–15]. As a result, these methodologies unveil the total fatty acid composition in each stereospecific
positions, sn-1, sn-2 and sn-3 [1], and the composition of individual TAGs is neglected. If the TAG species are pre-fractioned before
stereospecific analysis, the method will also give information about
stereochemistry of the selected TAG species [16,17]. However, the
amount of sample required is quite high due to several analytical
pretreatment steps followed by gas chromatographic analysis, and
the acyl migration after enzymatic hydrolysis poses a serious risk
for compromised results [13,18]. Yet, analysis of the enantiomeric
proportions of the individual TAGs is still an extremely challenging
task due to the enormous number of different TAG species with
similar physicochemical properties (including fairly similar or identical chromatographic and spectroscopic behavior), characteristic in
natural fats and oils.
The direct separation of enantiomers using chiral stationary
phases has been primarily applied to separate asymmetric TAGs
/>0021-9673/© 2021 The Authors. Published by Elsevier B.V. This is an open access article under the CC BY license ( />
M. Kalpio, K.M. Linderborg, M. Fabritius et al.
Journal of Chromatography A 1641 (2021) 461992
in previous studies [19]. It is commonly known that enantiomeric
separation of the two isomers is generated when there is a
three-point interaction between the compounds and chiral stationary phase [20]. However, the chiral interactions and the retention mechanisms are not fully understood. Furthermore, the
chiral behavior of TAGs and their elution order are still to be
investigated. Gotoh and co-authors screened nine chiral stationary phases for the enantiomeric separation of rac-16:0-16:0-18:1
[21]. Only CHIRALCEL OD-RH silica column coated with cellulose
tris-(3,5-dimethylphenylcarbamate) resulted in enantiomeric separation when methanol was used as the mobile phase. Baseline
separation was not achieved without sample recycling. The same
chiral selector has been applied to study different TAG structures by other researchers [19,22–27] using methanol or hexaneisopropanol as eluents. However, a limited number of studies
have been carried out by using natural TAGs as sample material
[23,24,26,27].
Recently, researchers have shown increasing interest in simultaneous separation of TAGs enantiomers and regioisomers [24,28,29].
Due to the co-elution, several columns in series or sophisticated
stationary phases have been used. Nevertheless, it is impossible to
determine the enantiomeric ratio of all enantiomers even when extracted ion chromatograms of each mass-to-charge ratio are used
[28]. Despite progress in stereospecific analysis of TAGs, no universal column-solvent combination for complete chromatographic
separation of TAGs in mixtures has been introduced. Thus, to
study the enantiomeric ratio of selected TAGs, fractions as pure
as possible are required. Multidimensional techniques are gaining importance also in chiral separations [30]. RP-HPLC as the
first dimension and silver ion chromatography as the second dimension has enabled excellent resolution of the TAG regioisomers
[31]. Before chiral-phase HPLC, an achiral RP-HPLC separation is
commonly used, and also sample recycling HPLC has been applied to enhance the separation efficiency [23,25,26]. For complete
separation, on-line two dimensional HPLC, i.e. RP-HPLC or silver
ion HPLC together with chiral-phase HPLC is suggested [32] but
no practical application of such approach has been published so
far.
Recently, we demonstrated a direct chiral-phase recycling HPLC
method that enabled the enantiomeric separation of 17 intact
racemic TAGs with fatty acids of C12–C22 and 0–6 double bonds
without any derivatization steps [22,25]. The purpose of the
present study was to prove that the chiral-phase recycling HPLC
method together with RP-HPLC and MS detection can be used as a
targeted strategy to resolve the stereospecific composition of asymmetric TAGs extracted from natural samples. Pulp oil of sea buckthorn (Hippophaë rhamnoides L.) was selected as an example of oil
of plant origin. All parts of the sea buckthorn plant are rich in
bioactive fractions, of which the seed and pulp oils are among the
most valuable products [33,34]. The pulp oil contains more saturated fatty acids than the seed oil, but has still rather high concentration of palmitoleic acid (C16:1) [35]. Evidently, pulp oil contains asymmetric TAGs with saturated fatty acids, mostly palmitic
acid (C16:0), and the unsaturated C16:1. C16:1, not common in
plant oils, is considered to be a bioactive molecule with potential significance for dietary management of obesity, fatty liver, insulin resistance, and diabetes [36]. Our special aim was to determinate the enantiomeric ratio of sn-16:0-16:1-16:1 to sn-16:116:1-16:0 and sn-16:0-16:0-16:1 to sn-16:1-16:0-16:0 using a multidimensional chromatographic approach with MS. These methodologies are crucial in order to unearth the molecular level information of TAG structures supporting the research in chemistry and biochemistry of lipids. In addition, they are also important to facilitate the research in human nutrition and metabolism
as well as the development of tailored food products and
nutraceuticals.
2. Experimental methods
2.1. Sample materials
Three Russian cultivars (‘Prozcharachnaya’, ‘Botanicheskaya’ and
‘Trofimovskaya’) of sea buckthorn (Hippophaë rhamnoides L. ssp.
mongolica) grown in Finland (60° 23’ N 22° 09’ E, altitude 2 m, Satava, Turku) were selected as samples. The berries were picked optimally ripe, frozen and stored at –20°C immediately after harvesting until analysis. Two fatty acid methyl ester mixtures, GLC reference standard 68D (Nu-Chek-Prep, Elysian, MN) and Supelco 37
Component Fatty Acid Methyl Ester Mix (Sigma-Aldrich, St. Louis,
MO) were used as external standards in the fatty acid analyses. The
TAG reference compounds containing TAGs with ECN (equivalent
carbon numbers = total number of acyl carbons – 2 × number of
double bonds [37]) 40–48 are listed in the supplementary material
(SM) Table S1. A/B/C denotes a TAG containing three different fatty
acids in unknown stereoisomeric (sn) positions. Sn-A-B-C indicates
a TAG in which the stereospecific positions sn-1, sn-2 and sn-3 of
fatty acids are defined to be A, B, and C, respectively. Rac-A-B-C
indicates a racemic mixture of enantiomers sn-A-B-C + sn-C-B-A
in equimolar ratios. A-B-C, again, denotes a stereoisomeric pair of
TAGs in which the fatty acids A and C in the outer positions can
occupy randomly the sn-1 and sn-3 positions, not necessarily in
equimolar ratios as in rac-A-B-C. All solvents were either pro analysis, HPLC grade or MS grade and used without further purification.
2.2. Extraction of pulp oil and isolation of triacylglycerols
Whole seeds of sea buckthorn berries were separated from pulp
(fruit flesh and skin) with tweezers after breaking the berries gently under liquid nitrogen. Extraction of oil from lyophilized berry
pulp was performed according to the Folch procedure [38] with
modifications described in our previous study [39]. TAGs were
solid-phase extracted from the total lipids using Sep-Pak Vac 6 cc
silica (500 mg) cartridges (Waters, Dublin, Ireland) [39].
2.3. Fatty acid analysis
The TAG fractions of the pulp oil samples were transesterified into fatty acid methyl esters by a sodium methoxide method
[40] and the fatty acid methyl esters were analyzed using a gas
chromatograph coupled with a flame ionization detector. Instrumentation and chromatographic settings were as previously described [39] with slightly different column oven programming;
hold 130°C for 1 min, increase to 170°C at 4.5°C/min, with no hold,
then increase to 220°C at 10°C/min, then hold for 3.5 min, increase
to 230°C at 10°C/min, then hold for 11 min, and finally increase to
240°C at 60°C/min, and hold for 3 min. The peaks of the fatty acid
methyl esters were identified by comparing their retention times
with those of reference mixtures mentioned in subsection “Sample materials” and the quantitative correction factors were calculated. All chromatographic data was analyzed with LabSolutions v.
5.93 (Shimadzu, Kyoto, Japan). Quantification was carried out by
using the correction factors by calculating the area percentages (%)
of each fatty acid methyl ester.
2.4. Multidimensional liquid chromatography
To increase the number of the resolved TAG species, a combination of the two different separation modes and recycling HPLC
were applied. An achiral-chiral two-dimensional HPLC in off-line
2
M. Kalpio, K.M. Linderborg, M. Fabritius et al.
Journal of Chromatography A 1641 (2021) 461992
mode utilizing one achiral C18 column and two polysaccharidebased chiral stationary phases were used to obtain as pure TAG
fractions as possible.
In the first dimension, TAGs were separated by an achiral Ascentis C18 column (250 × 4.6 mm, 5 μm, Supelco, Bellefonte, PA)
using Shimadzu Prominence preparative HPLC-UV instrumentation
consisting of a SIL-20A autosampler, an LC-20AB pump, a CTO10AC column oven, and a DGU-20A5 degasser (Kyoto, Japan). Injection volume was 20 μL, and TAGs were separated at 25°C using a
flow rate 1 mL/min. In a linear solvent gradient the amount of acetone in acetonitrile was increased from 40 to 90% in 50 min. TAGs
were recorded at 205 nm with SPD-20A UV-detector, and the fractions were collected automatically using a fraction collector FRC10A. In order to have sufficient amount of material, the fractionation was repeated up to five times and the corresponding fractions
were pooled, evaporated to dryness and re-dissolved in an appropriate volume of hexane.
Three main fractions (Fig. 2) collected were selected according
to mass spectral characterization for analysis on the second dimension, which was chiral-phase recycling HPLC. The HPLC instrumentation used for chiral separation was the same as that used in the
RP-mode, and the instrument parameters were the same as previously published [25]. Briefly, separations were carried out with two
CHIRALCEL OD-RH [cellulose tris (3,5-dimethylphenylcarbamate),
150 × 4.6 mm, 5 μm, Chiral Technologies Europe, Illkirch, France]
columns. The CS3080 Sample Peak RecyclerTM (Chiralizer Services,
Newtown, PA) including a controlling device and a high-pressure
10-port valve was connected to the system to improve the enantiomeric separation by rerunning the partially separated compounds after the first column via the UV detector to the second column. After recycling system, another absorbance detector
(Waters 486 Tunable Absorbance Detector, Millipore Corp., Milford,
MA) was connected in line to ensure that only the peaks of interest
were collected (SM Figure S1). Due to the unforeseeable chromatographic resolution of the fractions analyzed, a manual switching
between the columns was used, and fractionation result was simulated on chromatogram afterwards. Once a desired resolution was
attained and the later peak in the peak pair was passed through
the UV detector, the position of valve was not changed allowing
the separated peaks to elute through the later detector after which
they were collected. Before fractionation of the actual samples, performance of the fraction collecting procedure was ensured with
reference compounds, and the chromatogram is presented in SM
Figure S2.
mode and the scan time was set at 400 ms. This method produces
diagnostically useful molecular and fragment ions, [M–RCO2 ]+ , for
structural characterization. For each chromatographic peak, TAGs
were identified using reference compounds (SM Table S1), [M+H]+
and [M–RCO2 ]+ ions, and the area of the eleven most abundant
TAG species in the chromatogram were calculated as a percentage
of the total area of all TAG peaks.
TAG molecular weight distribution of sea buckthorn pulp oil
was determined with the direct inlet ammonia negative ion chemical ionization MS (NICI-MS). The NICI-MS scan data was also used
to create a product ion scan method for each selected pseudomolecular [M–H]– ion. A Thermo Scientific TSQ 80 0 0 EVO mass
spectrometer (Thermo Fisher Scientific, Waltham, MA) was used
as described previously [42]. Briefly, 1 μL of the TAG fraction obtained from the solid phase extraction was pipetted onto the rhenium wire tip of the direct exposure probe. The probe tip containing the sample was placed directly inside the ion source of the
mass spectrometer via the vacuum interlock. MS scans between
m/z 40 0–10 0 0 were acquired in quadruplicate. The relative molar
proportions of different molecular weight species were calculated
using abundances of the [M–H]– ions. The amount of naturally occurring 13 C was taken into account when the proportions of TAGs
were calculated.
The TAG molecular weight distribution of sea buckthorn pulp
oil determined with direct inlet ammonia NICI-MS was compared
to the random distribution of fatty acids in TAGs. The random distribution of fatty acids in the glycerol molecule was mathematically modelled using a RANDTAGS calculation program [43]. In
practice, the amount of the most prevalent fatty acids presented in
Fig. 1A was entered into RANDTAGS (v 1.0) program, which computed abundance TAGs based on random combination and distribution of fatty acids.
The positional distribution of fatty acids in ten sea buckthorn
pulp oil TAG sub-fractions obtained after separation with achiralchiral two-dimensional HPLC were analyzed with the ammonia
NICI-MS/MS as described previously [42]. Fragmentation of [M–H]–
ions was performed using collision-induced dissociation with argon gas, which favors dissociation of fatty acids from sn-1/3 positions. Product ions were scanned between m/z 100–650 to determine the primary (sn-1/3) and secondary (sn-2) positions of
fatty acids. Calculations of the TAG regioisomer abundances were
based on the relative proportions of [M–H–FA–100]– and [RCO2 ]–
ions, and the results were calculated using MSPECTRA 1.4 software
[44,45].
2.5. Mass spectrometric analyses
3. Results and discussion
Before the stereospecific analysis, structural features of TAGs extracted from the sea buckthorn pulp oil, were preliminary characterized to select asymmetric TAGs. An optimized UHPLC-MS
method with atmospheric pressure chemical ionization (UHPLCAPCI-MS) [41] was applied to analyze the ECNs and the regioisomeric composition of TAGs. The instrumentation consisted of a
Waters Acquity UHPLC coupled to a Waters Quattro Premier triple
quadrupole MS equipped with an APCI source (Waters Corp., Milford, MA). RP-UHPLC separation was carried out using BEH C18 column (100 × 2.1 mm, 1.7 μm, Waters Corp., Milford, MA). The flow
rate was 0.4 mL/min and in a binary solvent gradient the amount
of acetone in acetonitrile was increased from 0 to 70% in 22 min.
For the MS detection, the effluent was entirely directed to the APCI
ion source. The MS working conditions were as follows: corona
current 15 μA, cone voltage 30 V, extractor 5, the cone and desolvation gas flows were 47 and 250 L/h, respectively, and the probe
and source temperatures were 450°C and 120°C, respectively. Full
scan mass spectra (m/z 40 0–10 0 0) were collected in positive ion
3.1. Fatty acid composition
Resolution and identification of the nine most abundant fatty
acid methyl esters derived of the sea buckthorn pulp oil TAGs are
presented in SM Figure S3. Because the fatty acid compositions
of the three different cultivars were relatively similar (SM Figure
S4A), the fatty acid compositions were averaged for subsequent
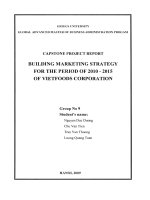
interpretations (Fig. 1A). The fatty acid profile of sea buckthorn
pulp oil of H. rhamnoides ssp. mongolica was similar to that determined by Yang & Kallio, 2006 [46]. The most abundant fatty
acid was C16:1, which comprised over 40% of the total fatty acid
pool, followed by C16:0 (32%). Only fatty acids present at > 0.2%
(area percentage) of total fatty acids are reported, including an
unidentified fatty acid (on average, 1.5%) with average retention
time of 15.8 min (SM Figure S3). The nine fatty acids result in a total number of 729 (x=y3 ) theoretically possible TAGs including all
regio- and enantiomers [19], which demonstrates the complexity of
TAGs.
3
M. Kalpio, K.M. Linderborg, M. Fabritius et al.
Journal of Chromatography A 1641 (2021) 461992
Fig. 1. Characterization of triacylglycerol composition of sea buckthorn pulp oil. (A) Average fatty acid composition of sea buckthorn pulp oil of the three cultivars of H.
rhamnoides ssp. mongolica. (B) Molecular weight distribution of sea buckthorn pulp oil from the direct inlet ammonia NICI-MS results and calculated as random distribution
of fatty acids (RANDTAGS).
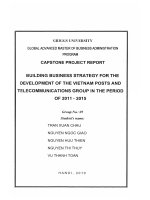
unsaturated fatty acids i.e. fractions 5, 8 and 9 indicated by red
lines in Fig. 2 were subjected to chiral separation.
Ammonia NICI-MS data was compared with random distribution of fatty acids (see SM Table S2) according to ECN values in
Fig. 1B. The main difference of molecular weight distribution in
sea buckthorn pulp oil analyzed with direct inlet ammonia NICIMS, compared to random distribution of fatty acids, was seen in
the amount of ACN:DB (number of acyl carbons:number of double bonds) 48:2 (ECN 44). The major ACN species of TAGs were 48,
50 and 52. Similar pattern of molecular weight distribution was
presented by Yang & Kallio, 2006 [46]. The major ACN:DB species
of TAGs of sea buckthorn pulp oil were 48:2 (ECN 44), 50:3 (ECN
44), 50:2 (ECN 46) and 48:1 (ECN 46), respectively, which constitute 72.9% of all TAG species detected. The same major ACN:DB
species resulted from the RANDTAGS calculation constituted 57.4%
of the total TAGs. The total number of possible TAGs calculated
by RANDTAGS [43] was 84 (SM Table S2) with the most abundant TAGs including 16:0/16:1/16:1, 16:0/16:0/16:1, 18:1/16:0/16:1
and 18:2/16:0/16:1 (47.3%).
3.2. Triacylglycerol composition of sea buckthorn pulp oil
The separation of TAGs of sea buckthorn pulp oil into eleven
ECN groups in the first dimension is illustrated in Fig. 2. It shows
a representative total ion chromatogram obtained with the UHPLCAPCI-MS method and proportions of the eleven most abundant
molecular weight (ECN) species (area-%). ECN 44 and ECN 46 were
the most abundant ECN species composing 72.2% of all TAGs. Identifications are listed in Table 1. The TAG profiles of the three different cultivars were relatively similar (SM Figure S4B).
The chromatographic profile and the mass spectral data revealed the existence of overlapping TAGs (Table 1). The UHPLCAPCI-MS method resulted in relatively fast but tentative identification of each TAG species of the sea buckthorn pulp oil. Analysis of
the positive ion APCI mass spectra confirmed the TAGs with C16:1.
All mass spectral data was in agreement with the results of the gas
chromatographic analysis of fatty acid methyl esters. From the four
most abundant TAG species, fraction 2 contained only all unsaturated TAGs (16:1-16:1-16:1, 16:1-18:2-16:1 and 18:2-18:2-16:1),
fraction 5 contained mainly 16:1-16:1-16:0 and 16:0/16:1/18:2,
fraction 8 composed mostly of 16:0/16:1/18:1 and 16:0/18:1/18:2,
and the main TAG species in fraction 9 were 16:0/16:0/16:1 and
16:0/16:0/18:2 (Table 1). Less abundant TAG species or fractions
which comprised of only unsaturated fatty acids (like fraction 2)
were not further analyzed. Thus, based on mass spectral data, TAG
fractions which contained asymmetric TAGs with saturated and
3.3. Chiral resolution and identification of targeted triacylglycerols
Fractions 5, 8 and 9 were further separated by using chiral columns and the sample recycling system. Progress of enantiomeric separation is illustrated in Fig. 3. The chiral-phase recycling HPLC method enabled successfully the further separation of
4
M. Kalpio, K.M. Linderborg, M. Fabritius et al.
Journal of Chromatography A 1641 (2021) 461992
1st dimension: Reversed-phase C18 column
5;
31.1%
8;
9;
13.2%
15.9%
Relative abundance (%)
2;
13.7%
4;
7.6%
6;
2.1%
1;
2.2%
ECN
40
3;
4.8%
42 42
7;
2.4%
44 44 44 46 46 46
2nd dimension: Two chiral columns
5-1-a
5-1-b
5-2-a
8-1-a 8-1-b
10;
2.5%
11;
3.5%
Time (min)
48 48
9-1
9-2
8-2-b
8-2-a
5-2-b
Fig. 2. 1st dimension: Separation of TAGs using reversed-phase column (UHPLC-APCI-MS total ion chromatogram). The fractions indicated by red lines were collected on
the first dimension and re-injected to the enantioselective column on the second dimension. 2nd dimension: Stereospecific separation of fractions using chiral columns with
recycling HPLC. Sub-fractions are marked with corresponding numbers and letters.
all TAGs examined. Depending on the number of peaks in each
fraction and their separation efficiency, they were either separated
all in one run or in the separate runs. From the three TAG fractions
collected in the first dimension, altogether 10 new sub-fractions
were obtained after enantiomeric separations in the second dimension (Fig. 2).
From fraction 5 altogether four sub-fractions were obtained and
collected in two separate enantioselective runs. With fraction 8 the
separation was faster and all four new fractions were collected
in one run (Fig. 3). After seven column passes there were two
clear peaks separated from fraction 9 and the sub-fraction 9-1 was
collected. The sample recycling was continued but after 14 column passes there was only small shoulder detected and also the
sub-fraction 9-2 was collected. Molecular weight distribution of
TAGs in all the collected fractions were confirmed with ammonia
NICI-MS, and the regiospecific composition of TAGs of all the subfractions were determined with ammonia NICI-MS/MS (Table 2,
SM Table S3).
Some of the fragments listed in SM Table S3 were not abundant (seen) in all parallel spectra due to the compromised sample
amount, which prevented the calculations with MSPECTRA for subfraction 5-2-b. Both sub-fraction 5-1-a and 5-1-b composed mostly
of 16:1-16:1-16:0 indicating that they contain asymmetric TAGs.
According to our previous study, sn-16:1-16:1-16:0 elutes before
sn-16:0-16:1-16:1 [25] and the chiral chromatographic elution behavior and separation profile of the sub-fractions 5-1-a and 5-1-b
was similar with the reference compound rac-16:1-16:1.16:0 [25].
Thus, the sub-fraction 5-1-a contained mainly sn-16:1-16:1-16:0
and 5-1-b sn-16:0-16:1-16:1 with enantiomeric ratio 70.5/29.5.
The main [M–H]– ion in sub-fractions 8-1-a and 8-1-b was
829.8 indicating TAGs with 50 acyl carbons and 2 double bonds.
Again, in sub-fractions 8-2-a and 8-2-b the main [M–H]– ion was
855.8, which indicates TAGs with 52 acyl carbons and 3 double
bonds. Also all these fractions contained triacid-TAG species, in
which unsaturated fatty acids (C16:1 or C18:1 or C18:2 or C18:1,
respectively) were in the sn-2 position. As previously known, in
plant oils mainly unsaturated fatty acids are esterified in the position sn-2, whereas in animal fats sn-2 position contains mainly
saturated fatty acids [47]. There is only a limited amount of information available related to the elution order and chiral chromatographic behavior of triacid-TAGs [28]. In theory, they contain
six isomers, which include three regioisomers, each consisting of a
pair of enantiomers, thus complicating the enantioseparation. Due
to the lack of knowledge related to enantioseparation of triacidTAGs and the incomplete separation of the sub-fractions between
8-1-a and 8-1-b as well as 8-2-a and 8-2-b, no stereospecific identification can be made on the TAG molecular species in these fractions based on current chiral chromatographic results.
Separation of fraction 9 was effective. Already after seven column passes there was two peaks separated. Their MS/MS analysis was also quite straightforward probably due to the symmetric TAGs, which contained only two fatty acids, unsaturated fatty
acids (C16:1 or C18:2) predominantly in the sn-2 position and saturated C16:0 in the positions sn-1 and sn-3. Only ca 5% had C16:0
in the sn-2 position. The sub-fraction 9-1 contained mainly 16:018:2-16:0 and the sub-fraction 9-2 contained 16:0-16:1-16:0.
It is apparent according to Table 2 that sea buckthorn pulp oil
contains many asymmetric TAGs with three different fatty acids.
Chiral chromatographic studies with structured ABC-type TAG reference compounds are needed to obtain more information about
elution order and chromatographic behavior of TAGs with three
different fatty acids. Another improvement to study enantiomeric
ratio of individual TAGs would be the multidimensional chromatography in online mode. However, there may be restrictions for
mobile phase to be used in such analysis, because many commonly
used LC eluents are not applicable with chiral columns. In future
research, concentration of the fraction has to be higher in order
to obtain sufficient amount of samples for further analytical steps.
Also separation of symmetric TAG from asymmetric TAGs prior to
chiral analysis would simplify the enantiomeric resolution.
5
M. Kalpio, K.M. Linderborg, M. Fabritius et al.
Table 1
Ions observed in the UHPLC-APCI-MS spectra and their possible identifications. Numbers of fractions further analyzed are bolded.
tR (min)
[M+H]+ m/z
Fragments [M-RCO2]+ and possible DAGs m/z
1
13.42
825.7
799.6
2
15.04
801.7
827.7
853.7
547.8 [16:1-16:1]
3
15.50
827.7
801.7
853.7
4
16.65
855.7
881.7
829.7
5
17.03
803.7
829.7
6
17.46
829.7
7
18.30
883.7
8
18.71
9
10
11
545.8 [14:0-18:3]
Possible TAGs
599.7 [18:2-18:2]
547.7 [16:1-16:1];
[14:0-18:2]
545.7 [14:0-18:3]
549.7 [16:0-16:1]
575.8 [16:0-18:2];
[16:1-18:1]
547.8 [16:1-16:1];
[14:0-18:2]
601.8 [18:1-18:2];
[18:0-18:3]
573.7; [16:0-18:3];
[16:1-18:2]
575.7 [16:0-18:2];
[16:1-18:1]
573.8 [16:0-18:3];
[16:1-18:2]
549.8 [16:0-16:1]
547.8 [16:1-16:1]
573.8 [16:1-18:2]
575.8 [16:0-18:2]
547.8 [16:1-16:1];
[14:0-18:2]
549.7 [16:0-16:1]
551.7 [16:0-16:0]
573.8 [16:0-18:3];
[16:1-18:2]
857.7
601.8 [18:1-18:2]
603.8 [18:1-18:1]
549.7 [16:0-16:1]
831.7
857.7
19.20
805.7
831.7
577.8 [16:0-18:1];
[16:1-18:0]
549.8 [16:0-16:1]
575.8 [16:0-18:2];
[16:1-18:1]
551.7 [16:0-16:0]
575.8 [16:0-18:2];
[16:1-18:1]
549.8 [16:0-16:1]
20.30
20.79
859.7
833.7
577.8 [16:0-18:1]
577.8 [16:0-18:1]
603.8 [18:1-18:1]
551.8 [16:0-16:0]
6
547.7 [16:1-16:1];
[14:0-18:2]
573.8 [16:1-18:2]
571.8 [16:1-18:3]
575.8 [16:0-18:2];
[16:1-18:1]
549.8 [16:0-16:1]
597.7 [18:2-18:3]
601.8 [18:1-18:2]
571.8;
521.7
[16:1-18:3];
[14:0-16:1]
575.7;
599.7
[16:1-18:1];
[18:2-18:2]
521.7;
575.7
[14:0-16:1];
[16:0-18:2];
[16:1-18:1]
14:0-18:3-18:2;
16:1-16:1-18:3
16:1-16:1-16:1;
16:1-18:2-16:1;
18:2-18:2-16:1
16:0/16:1/18:3;
14:0/16:1/18:2;
16:0/18:2/18:3;
16:1/18:1/18:3
16:1/18:1/18:2;
18:1/18:2/18:2;
16:1/16:1/18:1
16:1-16:1-16:0;
16:0/16:1/18:2
16:0/16:1/18:2;
16:1/16:1/18:1;
16:0/16:0/18:3
18:1/18:1/18:2;
18:1/18:1/16:1
16:0-16:1/18:1;
16:0/18:1/18:2
16:0/16:0/16:1;
16:0/16:0/18:2
16:0-18:1-18:1
16:0/16:0/18:1
Journal of Chromatography A 1641 (2021) 461992
#
M. Kalpio, K.M. Linderborg, M. Fabritius et al.
Journal of Chromatography A 1641 (2021) 461992
Fig. 3. HPLC-UV chromatograms of chirally separated fractions 5, 8 and 9. (A) Fraction 5 separated and collected fractions 5-1-a, 5-1-b. (B) Fraction 5 separated and collected
fractions 5-2-a and 5-2-b. (C) Fraction 8 separated and collected fractions 8-1-a, 8-1-b, 8-2-a and 8-2-b. (D) Fraction 9 separated and collected fractions 9-1 and 9-2.
7
M. Kalpio, K.M. Linderborg, M. Fabritius et al.
Journal of Chromatography A 1641 (2021) 461992
Table 2
Collected fractions, chiral chromatographic and NICI-MS results, and proposed enantiomers with relative abundances calculated using MSPECTRA software.
Fract.
tR of
Collected
Peak (min)
No of
Column
Passes
Enantiomeric
Ratio
(Area-%)
[M–H]– ACN:DB
[M–H]– ACN:DB
827.8 50:3
5
5-1-a
283.7
14
70.5
801.8 48:2
801.8 48:2
5-1-b
288.1
14
29.5
801.8 48:2
5-2-a
324.1
15
76.0
827.8 50:3
5-2-b
328.3
15
24.0
827.8 50:3
8
8-1-a
188.5
8
43.1
829.8 50:2
829.8 50:2
8-1-b
191.7
8
56.9
829.8 50:2
8-2-a
326.5
13
25.0
855.8 52:3
8-2-b
330.9
13
75.0
855.8 52:3
9
9-1
177.4
7
65.7
803.8 48:1
829.8 50:2
9-2
332.3
14
34.3
803.8 48:1
Proposed Enantiomers
Relative Abundance ± Std
sn-16:1-16:1-16:0
16:1-16:0-16:1
sn-16:0-16:1-16:1
16:1-16:0-16:1
16:1-16:0-18:2
16:0-16:1-18:2
16:1-18:2-16:0
97.0 ± 6.0 (n=4)
3.0 ± 6.0
96.5 ± 6.0 (n=3)
3.5 ± 6.0
2.2 ± 4.3 (n=4)
30.1 ± 8.9
67.7 ± 6.9
traces of the same enantiomers
16:1-16:0-18:1
16:0-16:1-18:1
16:1-18:1-16:0
16:1-16:1-18:0
16:1-18:0-16:1
16:1-16:0-18:1
16:0-16:1-18:1
16:1-18:1-16:0
16:0-18:2-18:1
18:2-16:0-18:1
16:0-18:1-18:2
16:1-18:2-18:0
18:2-16:1-18:0
16:1-18:0-18:2
16:1-18:1-18:1
18:1-16:1-18:1
16:0-18:2-18:1
18:2-16:0-18:1
16:0-18:1-18:2
0 (n=4)
27.1 ± 1.3
72.9 ± 1.3
0.8 ± 0.9 (n=4)
0.05 ± 0.09
0.001 ± 0.001
52.3 ± 8.9
46.9 ± 18.6
33.8 ± 15.2 (n=3)
0
66.2 ± 15.2
0
0.6 ± 1.2 (n=4)
0.3 ± 0.6
1.4 ± 2.8
1.2 ± 2.4
51.9 ± 32.8
11.8 ± 16.6
32.8 ± 21.9
16:0-16:0-18:2
16:0-18:2-16:0
16:1-16:0-16:0
16:0-16:1-16:0
6.7 ± 5.6
93.3 ± 5.6
4.2 ± 2.4
95.8 ± 2.4
855.8 52:3
829.8 50:2
4. Conclusions
analytical chemistry of lipids and lipidomics as well as improve the
knowledge of the detailed molecular structure of nutritionally important TAGs.
A targeted strategy using mass spectral characterization and
achiral-chiral off-line two-dimensional HPLC for analysis of stereospecific structures of individual triacylglycerols in nutritionally
important natural oils was demonstrated. The methodology was
applied to study enantiomeric composition of targeted TAGs extracted from sea buckthorn pulp oil. The first dimension (RP-HPLC)
separated the TAGs into eleven fractions based on ECN values.
UHPLC-APCI-MS was applied to determine the molecular weight
distribution, relative abundance of each of these fractions and preliminary regiospecific composition. The three TAG fractions, representing 60% of the total TAGs, were further separated into ten subfractions on the second dimension (chiral-phase recycling HPLC),
although baseline separation was not achieved between all the
sub-fractions. Analysis of these sub-fractions with direct inlet NICIMS/MS enabled determination of regioisomeric and enantiomeric
composition of TAGs. The enantiomeric ratio of TAG sn-16:1-16:116:0 to TAG sn-16:0-16:1-16:1 was 70.5/29.5. Another prevalent
palmitoleic acid-containing TAG species 16:0/16:0/16:1, contained
mainly (96%) symmetric TAG 16:0-16:1-16:0. The results are consistent with results of earlier study by Yang and Kallio, which suggested that palmitic acid mainly locate in the positions sn-1 or sn-3
in sea buckthorn plant oil [46].
This analytical strategy leads to revelation of stereospecific
structural information of natural TAGs – impossible to obtain by
other methods available so far. The methodology can still be further developed by improving the chromatographic separation of regioisomers of TAGs before stereospecific separation. Consequently,
the use of presented methodology to study enantiomeric composition of individual TAGs can remarkably contribute to the field of
Declaration of Competing Interest
The authors declare that they have no known competing financial interests or personal relationships that could have appeared to
influence the work reported in this paper.
CRediT authorship contribution statement
Marika Kalpio: Formal analysis, Investigation, Methodology,
Data curation, Writing - original draft, Writing - review & editing,
Visualization. Kaisa M. Linderborg: Supervision, Resources, Writing - review & editing, Funding acquisition. Mikael Fabritius: Formal analysis, Methodology, Writing - review & editing. Heikki
Kallio: Conceptualization, Supervision, Writing - review & editing.
Baoru Yang: Supervision, Writing - review & editing, Project administration, Funding acquisition.
Acknowledgements
Jani Sointusalo is acknowledged for assistance with recycling
and fractioning systems. The Finnish Cultural Foundation, the
Academy of Finland (Chiral lipids in chiral nature: a novel strategy
for regio- and stereospecific research of human milk and omega-3
lipids, decision No. 310982), Finnish Academy of Science and Letters; Vilho, Yrjö and Kalle Väisälä Fund, and the University of Turku
Graduate School (Doctoral Programme in Molecular Life Sciences)
are thanked for their financial support.
8
M. Kalpio, K.M. Linderborg, M. Fabritius et al.
Journal of Chromatography A 1641 (2021) 461992
Supplementary materials
[25] M. Kalpio, M. Nylund, K.M. Linderborg, B. Yang, B. Kristinsson, G.G. Haraldsson, H. Kallio, Enantioselective chromatography in analysis of triacylglycerols
common in edible fats and oils, Food Chem 172 (2015) 718–724, doi:10.1016/j.
foodchem.2014.09.135.
[26] T. Nagai, N. Watanabe, K. Yoshinaga, H. Mizobe, K. Kojima, I. Kuroda,
Y. Odanaka, T. Saito, F. Beppu, N. Gotoh, Abundances of triacylglycerol positional isomers and enantiomers comprised of a dipalmitoylglycerol backbone
and short- or medium-chain fatty acids in bovine milk fat, J. Oleo Sci. 64
(2015) 943–952, doi:10.5650/jos.ess15040.
[27] T. Nagai, K. Ishikawa, K. Yoshinaga, A. Yoshida, F. Beppu, N. Gotoh, Homochiral
asymmetric triacylglycerol isomers in egg yolk, J. Oleo Sci. 66 (2017) 1293–
1299, doi:10.5650/jos.ess17128.
[28] T. Nagai, T. Kinoshita, E. Kasamatsu, K. Yoshinaga, H. Mizobe, A. Yoshida,
Y. Itabashi, N. Gotoh, Simultaneous separation of triacylglycerol enantiomers
and positional isomers by chiral high performance liquid chromatography coupled with mass spectrometry, J. Oleo Sci. (2019), doi:10.5650/jos.ess19122.
ˇ
ˇ
[29] T. Rezanka,
I. Kolouchová, A. Cejková,
T. Cajthaml, K. Sigler, Identification
of regioisomers and enantiomers of triacylglycerols in different yeasts using
reversed- and chiral-phase LC–MS, J. Sep. Sci. 36 (2013) 3310–3320, doi:10.
10 02/jssc.20130 0657.
[30] I. Ali, Mohd. Suhail, H.Y. Aboul-Enein, Advances in chiral multidimensional liquid chromatography, TrAC Trends Anal. Chem 120 (2019) 115634, doi:10.1016/
j.trac.2019.115634.
[31] P.J. Kalo, A. Kemppinen, Regiospecific analysis of TAGs using chromatography,
MS, and chromatography-MS, Eur. J. Lipid Sci. Technol. 114 (2012) 399–411.
ˇ
[32] T. Rezanka,
I. Kolouchová, L. Nedbalová, K. Sigler, Enantiomeric separation of
triacylglycerols containing very long chain fatty acids, J. Chromatogr. A. 1557
(2018) 9–19, doi:10.1016/j.chroma.2018.04.064.
[33] B. Yang, M. Kortesniemi, Clinical evidence on potential health benefits of
berries, Curr. Opin. Food Sci. 2 (2015) 36–42, doi:10.1016/j.cofs.2015.01.002.
[34] L.M. Bal, V. Meda, S.N. Naik, S. Satya, Sea buckthorn berries: A potential source
of valuable nutrients for nutraceuticals and cosmoceuticals, Food Res. Int. 44
(2011) 1718–1727, doi:10.1016/j.foodres.2011.03.002.
[35] B. Yang, H.P. Kallio, Fatty acid composition of lipids in sea buckthorn (Hippophaë rhamnoides L.) berries of different origins, J. Agric. Food Chem. 49
(2001) 1939–1947, doi:10.1021/jf001059s.
[36] M.E. Frigolet, R. Gutiérrez-Aguilar, The role of the novel lipokine palmitoleic
acid in health and disease, Adv. Nutr. 8 (2017) 173S–181S, doi:10.3945/an.115.
011130.
[37] D. Firestone, Liquid chromatographic method for determination of triglycerides
in vegetable oils in terms of their partition numbers: summary of collaborative
study, J. AOAC Int. 77 (1994) 954–957.
[38] J. Folch, M. Lees, G.H. Sloane Stanley, A simple method for the isolation and
purification of total lipides from animal tissues, J. Biol. Chem. 226 (1957)
497–509.
[39] A.L. Vuorinen, M. Kalpio, K.M. Linderborg, M. Kortesniemi, K. Lehto, J. Niemi,
B. Yang, H.P. Kallio, Coordinate changes in gene expression and triacylglycerol composition in the developing seeds of oilseed rape (Brassica napus) and
turnip rape (Brassica rapa), Food Chem 145 (2014) 664–673, doi:10.1016/j.
foodchem.2013.08.108.
[40] W.W. Christie, A simple procedure for rapid transmethylation of glycerolipids
and cholesteryl esters, J. Lipid Res. 23 (1982) 1072–1075.
[41] H. Leskinen, J.-P. Suomela, H. Kallio, Quantification of triacylglycerol regioisomers in oils and fat using different mass spectrometric and liquid chromatographic methods, Rapid Commun. Mass Spectrom. 21 (2007) 2361–2373.
[42] M. Fabritius, K.M. Linderborg, M. Tarvainen, M. Kalpio, Y. Zhang, B. Yang, Direct
inlet negative ion chemical ionization tandem mass spectrometric analysis of
triacylglycerol regioisomers in human milk and infant formulas, Food Chem
328 (2020) 126991, doi:10.1016/j.foodchem.2020.126991.
[43] H. Kallio, K. Yli-Jokipii, J.P. Kurvinen, O. Sjövall, R. Tahvonen, Regioisomerism
of triacylglycerols in lard, tallow, yolk, chicken skin, palm oil, palm olein, palm
stearin, and a transesterified blend of palm stearin and coconut oil analyzed
by tandem mass spectrometry, J. Agric. Food Chem. 49 (2001) 3363–3369.
[44] H. Kallio, P. Rua, Distribution of the major fatty acids of human milk between
sn-2 and sn-1,3 positions of triacylglycerols, J. Am. Oil Chem. Soc. 71 (1994)
985–992.
[45] J.-P. Kurvinen, P. Rua, O. Sjövall, H. Kallio, Software (MSPECTRA) for automatic
interpretation of triacylglycerol molecular mass distribution spectra and collision induced dissociation product ion spectra obtained by ammonia negative
ion chemical ionization mass spectrometry, Rapid Commun. Mass Spectrom.
15 (2001) 1084–1091.
[46] B. Yang, H. Kallio, Analysis of triacylglycerols of seeds and berries of sea
buckthorn (Hippophaë rhamnoides) of different origins by mass spectrometry and tandem mass spectrometry, Lipids 41 (2006) 381–392, doi:10.1007/
s11745- 006- 5109- 3.
[47] M. Lísa, H. Velínská, M. Holcˇ apek, Regioisomeric characterization of triacylglycerols using silver-ion HPLC/MS and randomization synthesis of standards, Anal.
Chem. 81 (2009) 3903–3910.
Supplementary material associated with this article can be
found, in the online version, at doi:10.1016/j.chroma.2021.461992.
References
[1] H. Brockerhoff, Stereospecific analysis of triglycerides, Lipids 6 (1971) 942–956.
[2] A. Alfieri, E. Imperlini, E. Nigro, D. Vitucci, S. Orrù, A. Daniele, P. Buono,
A. Mancini, Effects of plant oil interesterified triacylglycerols on lipemia and
human health, Int. J. Mol. Sci. (2017) 19, doi:10.3390/ijms19010104.
[3] B. Butinar, M. Bucar-Miklavcic, V. Valencic, P. Raspor, Stereospecific analysis
of triacylglycerols as a useful means to evaluate genuineness of pumpkin seed
oils: lesson from virgin olive oil analyses, J. Agric. Food Chem. 58 (2010) 5227–
5234, doi:10.1021/jf904542z.
[4] L. Cossignani, D. Montesano, M.S. Simonetti, F. Blasi, Authentication of Coffea
arabica according to Triacylglycerol Stereospecific Composition, J. Anal. Methods Chem. 2016 (2016) 7482620, doi:10.1155/2016/7482620.
[5] S. Indelicato, D. Bongiorno, R. Pitonzo, V. Di Stefano, V. Calabrese, S. Indelicato, G. Avellone, Triacylglycerols in edible oils: Determination, characterization, quantitation, chemometric approach and evaluation of adulterations, J.
Chromatogr. A. 1515 (2017) 1–16, doi:10.1016/j.chroma.2017.08.002.
[6] T. Karupaiah, K. Sundram, Effects of stereospecific positioning of fatty acids
in triacylglycerol structures in native and randomized fats: a review of their
nutritional implications, Nutr. Metab. 4 (2007) 16.
[7] K.M. Linderborg, H.P.T. Kallio, Triacylglycerol fatty acid positional distribution
and postprandial lipid metabolism, Food Rev. Int. 21 (2005) 331–355.
[8] R.A. Coleman, D.P. Lee, Enzymes of triacylglycerol synthesis and their regulation, Prog. Lipid Res. 43 (2004) 134–176, doi:10.1016/S0163-7827(03)0 0 051-1.
[9] H. Brockerhoff, A stereospecific analysis of triglycerides, J. Lipid Res. 6 (1965)
10–15.
[10] C.C. Becker, A. Rosenquist, G. Hølmer, Regiospecific analysis of triacylglycerols using allyl magnesium bromide, Lipids 28 (1993) 147–149, doi:10.1007/
BF02535779.
[11] H. Brockerhoff, Stereospecific analysis of triglycerides: an alternative method,
J. Lipid Res. 8 (1967) 167–169.
[12] W.W. Christie, J.H. Moore, A Semimicro method for the stereospecific analysis
of triglycerides, Biochim. Biophys. Acta BBA - Lipids Lipid Metab. 176 (1969)
445–452, doi:10.1016/0 0 05-2760(69)90211-2.
[13] W.W. Christie, B. Nikolova-Damyanova, P. Laakso, B. Herslof, Stereospecific
analysis of triacyl-sn-glycerols via resolution of diastereomeric diacylglycerol
derivatives by high-performance liquid chromatography on silica, J. Am. Oil
Chem. Soc. 68 (1991) 695–701.
[14] P. Laakso, W.W. Christie, Chromatographic resolution of chiral diacylglycerol derivatives: potential in the stereospecific analysis of triacyl-sn-glycerols,
Lipids 25 (1990) 349–353.
[15] T. Takagi, Y. Ando, Stereospecific analysis of triacyl-sn-glycerols by chiral high-performance liquid chromatography, Lipids 26 (1991) 542–547.
[16] G. Semporé, J. Bézard, Determination of molecular species of oil triacylglycerols
by reversed-phase and chiral-phase high-performance liquid chromatography,
J. Am. Oil Chem. Soc. 68 (1991) 702–709, doi:10.1007/BF02662156.
[17] S. Boukhchina, J. Gresti, H. Kallel, J. Bézard, Stereospecific analysis of TAG from
sunflower seed oil, J. Am. Oil Chem. Soc. 80 (2003) 5–8.
[18] J.A. Laszlo, D.L. Compton, K.E. Vermillion, Acyl migration kinetics of vegetable
oil 1,2-Diacylglycerols, J. Am. Oil Chem. Soc. 85 (2008) 307–312, doi:10.1007/
s11746- 008- 1202- 5.
ˇ
[19] T. Rezanka,
K. Pádrová, K. Sigler, Regioisomeric and enantiomeric analysis of
triacylglycerols, Anal. Biochem. 524 (2017) 3–12, doi:10.1016/j.ab.2016.05.028.
[20] W.H. Pirkle, T.C. Pochapsky, Considerations of chiral recognition relevant to the
liquid chromatography separation of enantiomers, Chem. Rev. 89 (1989) 347–
362, doi:10.1021/cr0 0 092a0 06.
[21] N. Gotoh, S. Wada, T. Nagai, Separation of asymmetric triacylglycerols into their
enantiomers by recycle high-performance liquid chromatography, Lipid Technol 23 (2011) 105–108, doi:10.1002/lite.201100105.
[22] M. Kalpio, J.D. Magnússon, H.G. Gudmundsson, K.M. Linderborg, H. Kallio,
G.G. Haraldsson, B. Yang, Synthesis and enantiospecific analysis of enantiostructured triacylglycerols containing n-3 polyunsaturated fatty acids, Chem.
Phys. Lipids. 172 (2020) 104937, doi:10.1016/j.chemphyslip.2020.104937.
[23] T. Nagai, H. Mizobe, I. Otake, K. Ichioka, K. Kojima, Y. Matsumoto, N. Gotoh,
I. Kuroda, S. Wada, Enantiomeric separation of asymmetric triacylglycerol by
recycle high-performance liquid chromatography with chiral column, J. Chromatogr. A. 1218 (2011) 2880–2886.
[24] M. Lísa, M. Holcˇ apek, Characterization of triacylglycerol enantiomers using chiral HPLC/APCI-MS and synthesis of enantiomeric triacylglycerols, Anal. Chem.
85 (2013) 1852–1859.
9