Experimental and theoretical investigation of high- concentration elution bands in ion-pair chromatography
Bạn đang xem bản rút gọn của tài liệu. Xem và tải ngay bản đầy đủ của tài liệu tại đây (783.61 KB, 10 trang )
Journal of Chromatography A 1656 (2021) 462541
Contents lists available at ScienceDirect
Journal of Chromatography A
journal homepage: www.elsevier.com/locate/chroma
Experimental and theoretical investigation of high- concentration
elution bands in ion-pair chromatography
Marek Les´ ko a, Jörgen Samuelsson a, Krzysztof Kaczmarski b,∗, Torgny Fornstedt a,∗
a
b
Department of Engineering and Chemical Sciences, Karlstad University, SE, 651 88 Karlstad, Sweden
Department of Chemical Engineering, Rzeszów University of Technology, PL, 35 959 Rzeszów, Poland
a r t i c l e
i n f o
Article history:
Received 16 April 2021
Revised 3 September 2021
Accepted 5 September 2021
Available online 10 September 2021
Keywords:
Ion pair chromatography
Overloaded profiles
Multilayer adsorption model
Implicit model
Electrostatic theory
a b s t r a c t
The effective separation of many solutes, including pharmaceuticals, can be performed using an ion-pair
reagent (IPR) in the mobile phase. However, chromatographic separation and mathematical modelling
are a challenge in ionpair chromatography (IPC), especially in preparative mode, due to the complicated
chromatographic process. In this study, we present a retention mechanism and a mathematical model
that predict overloaded concentration profiles in IPC using a system with X-Bridge C18 as stationary phase
and tetrabutylammonium bromide in the 0 - 15 mM concentration range as the IPR. Two different mobile
phases were used: (i) 15/85 [v/v] acetonitrile/water, (ii) 25/75 methanol/water. The model compounds
were sodium salts of organic compounds with sulfonic acid functions. The analytical and preparative
elution profiles were obtained for specified conditions. The analytical data were utilized to calculate the
difference in electrical potential between the surface and bulk solution using firm electrostatic theory. In
the preparative mode in a certain range of IPR concentrations, complicated U-shaped overloaded profiles
were observed. In the other considered cases, Langmuir overloaded elution profiles were recorded. A
multilayer adsorption model was derived, which is consistent with the dynamic ion exchange models. The
model assumes that lipophilic IPR adsorbs on the stationary phase, creating charged active sites that serve
as exchange sites for the solutes. The molecules of the solute can adsorb on the already formed IPR layer.
It was also assumed that a subsequent layer of solute can form on the formed layer of complexes due
to interactions between the solute molecules. The model takes into account the electrostatic attraction
and repulsion of the molecules, depending on the considered situation. The proposed model allowed
prediction of the overloaded concentration profiles with very good agreement for the model solute and
followed the progression from Langmuirian, through U-shaped, to again Langmuirian profiles.
© 2021 The Author(s). Published by Elsevier B.V.
This is an open access article under the CC BY license ( />
1. Introduction
Ion-pair chromatography (IPC) was developed for almost 40
years ago for the purpose of separating polar charged compounds
that otherwise are not retained on the hydrophobic RPLC surfaces.
In ion-pair chromatography (IPC) a lipophilic ion-pair reagent (IPR)
is added to the mobile phase for separation of polar/charged
solutes in high resolution reversed-phase liquid chromatography
(RPLC) systems [1]. The analytical mode of IPC quickly became
popular, but the preparative mode of IPC (prep-IPC) has not gained
as much popularity, one of the reasons being that the collected
fractions will contain large amounts of IPR. However, if the prepIPC method is the best alternative, as example for the next genera-
∗
Corresponding authors
E-mail addresses: (K. Kaczmarski), Torgny.Fornstedt
@kau.se (T. Fornstedt).
tion drugs molecule class oligonucleotides [2-4] it is worth adding
a final polishing step for removing the IPR with a final purification
step.
IPC is frequently used for separating inorganic and organic ions,
peptides as well as oligonucleotides, for both purification and analytical purposes, and the retention mechanism of IPC has been discussed for years [1, 5]. Generally, two different underlying mechanisms are considered: (i) ion-pair formation occurs in the mobilephase eluent, binding the complex to the non-polar stationary
phase [5, 6]; (ii) ion-pair formation occurs between the solute and
lipophilic IPR bonded to the stationary phase [7]. The simpler ionpair adsorption model developed by Schill et al. also assumes that
the ion pairs are adsorbed to the stationary phase but leaves open
whether the ion pairs are formed in the mobile phase or during
the adsorption process [8]. To describe these mechanisms, stoichiometric models, electrostatic models, or combined stoichiometric–
electrostatic models have been proposed [9-12].
/>0021-9673/© 2021 The Author(s). Published by Elsevier B.V. This is an open access article under the CC BY license ( />
M. Le´sko, J. Samuelsson, K. Kaczmarski et al.
Journal of Chromatography A 1656 (2021) 462541
Stoichiometric models use simple ideal equilibrium theory to
estimate the formation of ion pairs in solution or on the stationary
phase [8, 9]. Even though stoichiometric models lack firm foundations in physical chemistry, they can still be used to predict the retention rather well. The non-stoichiometric models adopt different
versions of the Stern–Gouy–Chapman theory regarding electrical
double layers formed by a surface excess of adsorbed IPR ions on
the stationary phase. The solute is attracted by the charged interface, in that way increasing the retention [10 - 12]. Purely electrostatic models disregard the ion-pairing process in the bulk eluent;
these models are also often referred to as dynamic ion-exchange
models. A universal retention mechanism of IPC that can explain
all phenomena taking place during the chromatographic process
would be highly desirable. Unfortunately, due to the complexity of
the chromatographic process, such a model has not yet been proposed.
Most IPC studies concern the analytical mode of IPC, but only
a few describe the overloaded or preparative mode. As far as we
know, there is a particular lack of studies addressing the modeling
of overloaded concentration profiles. Such models would be highly
desirable because they could be used in the rationalization and optimization of chromatographic resolutions.
IPC has become increasingly important in recent years because
of the trend toward biological drugs in the pharmaceutical area,
and much larger complex molecules often require the use of one
or another IPR in the eluent. It has previously been shown how
additive components, if more or less strongly adsorbed, can generate the strangest peak deformations in analytical and especially
preparative liquid chromatography [13]. These effects are difficult
to predict even when neutral components have been separated and
a rule of thumb was developed to avoid the effects in separations
of neutral components in liquid chromatography [13] as well as in
the more complex mode, supercritical fluid chromatography [14].
There are strong indications these very strange deformations are
exacerbated in IPC [13] and with fundamental studies such as this
one, in the future we might be able to give guidance on avoiding
such peak deformations in IPC.
The unusual band shapes were previously observed in the adsorption of Tröger’s base enantiomers on the chiral stationary
phases in HPLC [15] and in TLC for organic acids [16]. The results
of these studies were successfully interpreted by a multilayer adsorption model. There are indications that the strange band shapes
with round U shapes observed in IPC might also result from multilayer adsorption.
For overloaded cases, as in IPC used in production, the simple
models generally used often neglect all types of ion-pair formation
[17]. Recently, overloaded elution profiles for peptide separation
were successfully described by also considering ion-pair formation
in the mobile phase [18]. However, the model could only handle single charge-peptides; for three-charged peptides, the problem
become too complicated.
The aim of this study is to develop a model for predicting overloaded concentration profiles in IPC. For this purpose, a model
chromatographic system was used to separate organic sulfonic
acids using as tetrabutylammonium bromide as the mobile phase
IPR. The study consists of an analytical and overloaded section; in
the former section the solutes retention as well as the columns
surface potentials are investigated as a function of the IPR. In the
overloaded section, models for the prediction of the overloaded
concentration profiles was developed and validated.
mathematical models allowing prediction of the retention factor
[5-12]. These models have their sources in physical chemistry and
usually use the concept of the difference in electrical potential between the surface and bulk solution. In preparative mode, in addition to predicting the retention, it is also very important to predict
the shape of the overloaded concentration profiles, because optimal separation conditions are achieved when band profiles overlap each other to some degree [19]. Thus, modeling the preparative mode is much more difficult than modeling analytical chromatography due to the nonlinear relationship between the solute
adsorbed and dissolved in the mobile phase and other competition
occurring at high solute concentrations. Moreover, unlike analytical chromatography, in which the appropriate equation for calculating the retention factor is usually derived, in this mode, a dynamic column simulation model must be connected with an appropriate description of the adsorption/desorption process. This is
especially challenging in IPC, whose multicomponent system, usually with a complex mechanism, requires a sophisticated mathematical description.
Section 2.1 briefly describes one of the most popular electrostatic theories, based on the Gouy–Chapman theory, for the interpretation of analytical retention times in IPC [20]. Section 2.2 deals
with the basic part of the study: predicting the overloaded concentration profiles in IPC; the assumptions, derivation, and mathematical model of the preparative mode will be presented there in
detail.
2.1. Analytical ion-pair chromatography
According to the electrostatic model of Ståhlberg et al. [11,
20], based on the Gouy–Chapman theory, the retention factor of
a charged solute, E, in the presence of an ion-pair reagent, H, can
be described using this relationship:
k = φ exp −
G0E + zE F ψ 0
RT
(1)
where φ is the phase ratio, zE F ψ 0 the electrostatic energy, G0E
the free energy of adsorption without the electrostatic energy, T
the temperature, R the gas constant, F Faraday’s constant, zE the
charge of the solute, E, and k the retention factor of compound
E. The general idea of this model is that the adsorption of the
charged solute on the stationary phase depends on two factors: (1)
the electrostatic attraction to or repulsion from the surface of the
stationary phase, which is governed by the electrostatic potential
of the surface and the charge of the ionic form of the solute; and
(2) the free energy of adsorption when the electrostatic potential
equals zero. Thus, using Eq. (1), it is possible to define the retention factor, k0 , at a reference composition of the IPR in the mobile
phase, with the difference in electrostatic potential between the
mobile and stationary phases being set to zero. In this condition,
the retention factor, k0 , is equal to φ exp(− G0E /RT ). Eq. (1) can
be rearranged so that it is possible to estimate the electrostatic
potential as a function of the retention factors of solutes:
0
=
RT k0
ln
zE F
k
(2)
In the above discussed model the formation of ion-pairs in solution is not considered and according to Ståhlberg and Häglund
this is a valid simplification when using tetrabutylammonium ion
as IPR [12].
2. Theory
2.2. Overloaded ion-pair chromatography
In analytical mode, the most important thing is to predict the
retention times of the eluted solutes. There are several theories
concerning the interpretation of the mechanism of IPC and the
For correct modeling of the overloaded concentration profiles
in the IPC case, an appropriate model is required. As in classical
2
M. Le´sko, J. Samuelsson, K. Kaczmarski et al.
Journal of Chromatography A 1656 (2021) 462541
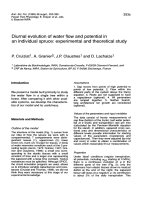
Fig. 1. Schematic illustration of the equilibria (a) considered when modeling the adsorption mechanism of SBS in the presence of the ion-pairing reagent (IPR) according
to the multilayer adsorption model (b). The IPR, H, adsorbs to the surface of the stationary phase L, while the compounds of the solute, E, adsorb to already adsorbed H or
is the ratio of the adsorption sites
form the next layer of E. The excess of anions over IPR, X, can adsorb to the layer of H. K denotes the association equilibrium constant;
occupied by an appropriate combination of compounds to the saturation capacity.
nonlinear chromatography, phenomena generally neglected in linear chromatography can be important, phenomena such as lateral
interaction between adsorbed solutes or multilayer adsorption [16,
19]. In addition, in IPC, complexes between the IPR and solute can
form in the mobile phase and then adsorb. We tested several models and found the best agreement between experiment and theory
when multilayer adsorption was assumed. However, including in
the model the possibility of complex formation between IPR and
solute did not improve the model’s accuracy. On the other hand, a
model that neglected multilayer adsorption and accepted the complex formation failed to correctly model overloaded IPC in our case.
Here, a new 3-layer ion pair model is proposed. The model
is based on several surface adsorption-desorption reactions, see
Fig. 1a. In formulating the equations of the model, we assume that
the process of the ion-pairing takes place on the stationary phase
and it is responsible for observed shapes of the overloaded concentration profiles. This is consistent with postulated so-called dynamic ion exchange models [6, 7] which assume that the lipophilic
ions first adsorb to the stationary phase and thus dynamically create charged active sites. These sites serve as exchange sites for the
solute ions. In the following equation H, E and X are the IPR, the
solute, and the excess of anions as compared to the IPR coming
from the inorganic salt as the counter-ion for the IPR, respectively.
The following reactions are considered (see Fig. 1a): (1) adsorption
of H to the stationary phase L, (2) accumulation of E to the already
established layer of H on the column, (3) the accumulation of X
to the already established layer of H on the column and finally (4)
the accumulation of E to the already established layer of HE on the
column. In other words, we have up to three layers on the surface
of the stationary phase: first layer of H second layer of E on the
H-layer and X on H-layer and third layer of E on the HE-layer. The
schematic illustration of the model is presented in Fig. 1b. Moreover, on the base of the electrostatic theory, it was assumed, that
affinity of adsorption of the H is decreasing with the increase of
its concentration in the stationary phase. It is caused by electrostatic repulsion of the positively charged compound off the positively charged layer. Similarly, the model assumes that the affinity
of the adsorption of the E and X is increasing with the increase
of the H concentration on the stationary phase. It is due to the
electrostatic attraction of oppositely charged ions of solute to the
dynamically formed ion pair layer on the stationary phase.
Under the above assumption the ratio of the free adsorption
sites to the saturation capacity 0 can be expressed by the following equation:
0
=1−
H
−
HE
−
HE2
−
HX
(3a)
where: H , HE , HE2 and HX are the ratios of the sites occupied by the: H, first layer of E on the H-layer, two layers of the
E on the H-layer, and X on the layer of the H-layer to the saturation capacity, respectively. Here, the electrostatic contribution is
handled by modifying the equilibrium constants and introducing a
3
M. Le´sko, J. Samuelsson, K. Kaczmarski et al.
Journal of Chromatography A 1656 (2021) 462541
new electrostatic modified equilibrium constant Ti .
TH = KH exp(−S1
H
)
(3b)
THE = KHE exp(S2
H
)
(3c)
THX = KHX exp(S3
H
)
d qE
d
= qs (
dt
dt
d qX
d
= qs
dt
dt
(3d)
THE2 = KHE2
The constants Ki are the equilibrium constants (see Fig. 1a) of
the adsorption processes for each considered cases to model the
repulsion constants S1 , S2, and S3 are introduced these expressing the strength of the repulsion or attraction of the IPR, solute,
and anions adsorption, respectively. Observe that the adsorption
constant THE2 does not contain any exponential factor, because the
complex HEL is uncharged and would not repell futher adsorption
of the the solute E.
The retention mechanism for multi-layer adsorption using the
definitions described using Eqs. (3) can be described as mass balances for a specific layer. In all equations additional layers are going to be described using Langmuiur adsorption model or electrostatic modified Langmuir adsorption isotherm, that is using the
electrostatic equilibrium constants described in Eqs. (3b-3d).
For 0 – only IPR can adsorb due to hydrophobic interaction.
− k−H
0
H
) = −kH CH
0
H
−
0
H
H
= (kHCH
dt
− k−H
0
−(kHXCX
H
− k−HX
−kHE CE
H
−
H
) − (kHECE
HX
HE
) = kH CH
− kHX CX
THE
H
− k−HE
0
−
H
−
HE
HX
H
HE
HE
dt
= (kHECE
= kHE CE
for
d
HE 2
HE2
dt
and
H
H
− k−HE
HE
−
HX
HE
) − (kHE2 CE
− kHE2 CE
THE
HE
− k−HE2
HE
−
HE2
HE2
)
HE
− k−HE2
HE2
) = kHE2 CE
HE
−
HE2
THE2
HX
dt
= kHX CX
H
−
HX
(7)
H+
HE +
HE2
+
HX )
= CX THX
(15)
HE
(16)
H
=
HE2
=0
(17)
= 1 + CH,
H
=
H,
HX
+ CX,
inlet TH
follows from the solution of the set
inlet THXCH,inlet TH
−1
(18)
0CH,inlet TH
(19)
=
HCX,inlet THX
(20)
H
+
HX
)
qE (t = 0 ) = 0
In the above equations CH , CE, and CX are the concentration of the
H, E and X in the mobile phase, respectively. In Fig. 1a the adsorption equilibrium constants (KH , KHE , …) for all the reactions
are presented. Similary we could define the rate constant for the
adsorption process is ki (kH , kHE , …) and the rate constant for
the desorption process is k-i (k-H , k-HE , …). Please, observe that
Ki = ki /k-i .
The concentration change of the adsorbed compounds (qi ) are:
d qH
d
= qs (
dt
dt
= CE THE2
qH (t = 0 ) = qs (
(8)
THX
(14)
H
where CH, inlet and CX, inlet are the concentration of H and X introduced with the mobile phase into the column inlet, respectively.
Finely the initial conditions are:
and
d
= CE THE
0
HX
– adsorption/desorption of solute
= (kHE2 CE
(12)
and
(6)
THE2
−1
(13)
0
Initial value of 0 ,
of tree equation:
(5)
for the HE , – on adsorbed in second layer solute the next solute
particle can adsorb due to hydrophobic interaction
d
(11)
It should be noticed that above set of equations are implicit where
H is a function of
H , see Eq. (3b). In others words, the amount
of adsorbed IPR depends on the IPR already adsorbed on the surface of the stationary phase due to repulsion from the charged
layer.
The model requires to define the initial condition. For t = 0, it
was assumed equilibrium:
TH
HX
(10)
HX
= CH TH
HE2
)
THX )
)
1 + TH cH + TH THE cH cE + TH THX cH cX + TH TE THE2 cH cE2
=
HE
for: H – we must consider H, E and X adsorb due to ion-ion interaction
d
HE2
The expression for each case of the occupying active places by the
considered components are:
(4)
TH
+2
Assuming infinitely fast surface pseudo-reaction process, aka the
steady state approximation, the left-hand sides of Eqns. (4 - 8) are
equal to zero. From these equations connected with Eq. (3a), after
simple algebraic manipulations we obtain:
(3e)
d 0
= −(kHCH
dt
HE
qX (t = 0 ) = qs (
(21)
(22)
HX
)
(23)
The kinetic adsorption model was solved with transport dispersive model [19]:
∂ Ci u ∂ Ci 1 − εt ∂ qi
∂ 2Ci
+
+
= DL 2
∂ t εt ∂ t
εt ∂ t
∂x
(24)
where u (m s−1 ) is the superficial velocity, εt is the total porosity,
DL (m2 s−1 ) is the axial dispersion coefficient.
(9)
4
M. Le´sko, J. Samuelsson, K. Kaczmarski et al.
Journal of Chromatography A 1656 (2021) 462541
3. Experimental
enough adsorption rates, i.e., kH , kHE , kHX , and kHE2 , is equivalent to solving the ED model using the implicit isotherm. In our
case, for adsorption rates greater than about 10 0 0, the solutions of
Eqs. (24) and (9)–(11) were almost the same.
It should be also noted that the typical initial and boundary
conditions used in simulating the column dynamics had to be
modified in our case. It was assumed that the concentration of E
in the mobile phase equals zero at the initial time, so the surface
concentrations HE and HE2 also equal zero at the initial moment. The values of the surface concentrations 0 , H , and HX
at t = 0 followed from the concentration of H and X in the mobile
phase in the steady state.
The presented model contains eight parameters (qs , KH , KHE ,
KHE2 , KHX , S1 , S2 , S3 ) estimated based on four or five overloaded
concentration profiles depending on the considered case. The concentration profiles chosen during the estimation covered different
IPR concentrations and peak shapes so that the estimations always
included Langmuir-type peaks obtained at the lowest IPR concentration in the mobile phase, U-shaped peaks, and two or three
Langmuir-type peaks obtained at the higher concentration of IPR.
The estimation was done based on concentration profiles obtained
at the highest injection volume. The parameters of the model were
estimated with the inverse method using the stochastic simulated
annealing method [23] with the minimum value of temperature established on 0.001 and accuracy of optimum calculation at 10−5 .
In the considered cases, due to the many existing local minimums,
faster deterministic methods such as the Levenberg–Marquardt algorithm do not give satisfactory results; therefore, the stochastic
method was found to be more effective in this case.
3.1. Chemicals and column
The mobile phase consisted of gradient-grade MeOH purchased
from Fisher Scientific (Loughborough, UK) or gradient-grade MeCN
purchased from VWR International (Radnor, PA, USA) and deionized water with a resistivity of 18.2 M cm from a Milli-QPlus 185
water purification system (Merck Millipore, Darmstadt, Germany).
As solutes, we used sodium salts of the sulfonic acids: sodium benzenesulfonate (SBS), p-toluenosulfonic acid monohydrate (SPTS),
sodium 2-naphtalenesulfonate (S2NS), 1,5-naphthalenedisulfonic
acid disodium salt (S15NS), and 2,6-naphthalenedisulfonic acid disodium salt (S26NS). The IPR used in this study was tetrabutylammonium bromide (TBuABr). The constant ionic strength of the mobile phase was maintained by adding sodium chloride. All solutes,
the IPR and salts were purchased from Sigma-Aldrich (St. Louis,
MO, USA). The column was a 100 × 2.1 mm XBridge C18 from Waters Corporation (Milford, MA, USA with an average particle diameter of 5.0 μm. According to the vender, in the unbound phase the
average pore diameter was 147 A˚ and the surface area was 192 m2
g–1 .
3.2. Instrumentation and procedure
Experiments were performed on an Acquity H-Class Bio System
from Waters (Milford, MA, USA) with a quaternary solvent manager, an autosampler with a 50-μL flow-through needle, a stillair column oven equipped with a mobile phase pre-heater, and
a PDA detector with a 500-nL flow cell. The extra volume from
the autosampler to the detector was 23 μL. Two different mobile
phases were used: 1) 15/85 [v/v] MeCN/water, and 2) 25/75 [v/v]
MeOH/water. Tetrabutylammonium bromide was chosen as the IPR.
The concentrations of the IPR in both mobile phases were: 0, 1, 1.5,
2, 3, 5, 7.5, 10, 12.5, and 15 mM. The constant ionic strength of the
mobile phases was maintained at 15 mM by adding an appropriate
amount of sodium chloride. The final prepared mobile phase was
filtered through a 0.20-μm filter before use. The solutes were dissolved in the mobile phase at concentrations of 0.0010 g L–1 and
1.0 or 1.1 g L–1 for analytical and preparative injections, respectively. The injection volume was 2 μL for analytical injections; for
the preparative investigations, the injected volumes were 10, 20,
and 30 μL. The signal was detected at 210 and 250 nm. At least two
replicates were always made. The mobile flow rate in all experiments was 0.25 mL min–1 . The temperature of the column oven
and the heat exchanger prior the column inlet was 25°C.
4. Results and discussion
The aim of this study is to develop theory and methods allowing prediction of the retention and shape of the overloaded
concentration profiles in IPC. For this purpose, a model chromatographic system was considered in which several sodium salts of
the sulfonic acids were eluted, with the mobile phases containing
tetrabutylammonium bromide as the IPR. The analytical and overloaded concentration profiles were obtained for the studied chromatographic system.
The study has three parts: analytical and overloaded.
Section 4.1 presents the analytical mode, in which the surface
potential for a considered experimental condition is estimated. In
Section 4.2, the overloaded concentration profiles are presented
at various IPR concentrations. In Section 4.3, the results for the
overloaded concentration profiles predicted using the mathematical model are presented in the SBS case and the profiles shapes
are investigated. The particular aspects and challenges of modeling
preparative ion pair chromatography are also discussed there.
3.3. Method of estimating the model parameters and simulation
The model for predicting the overloaded concentration profiles
was solved using the method of orthogonal collocation on the finite element described by Kaczmarski et al [21]. As discussed in
Section 2.2, it should be noted that the proposed model is implicit because the amount of adsorbed H depends on the amount
of H already adsorbed. Thus, the model requires application of the
appropriate procedure for solving the equations. Detailed information about solving such problems can be found in Kaczmarski et al.
[22]. To simulate the column dynamics, Eq. (24) (see Section 2.2)
must be coupled with an appropriate equation that describes the
equilibrium between the concentrations of solute in the mobile
and stationary phases; this equation can also be the implicit equation. If the rate of the adsorption–desorption process is infinitely
fast, then the model is known as the equilibrium–dispersive (ED)
model. It is worth emphasizing that solving the ED model using implicit isotherm equations is not easy. However, the solution
of Eq. (24) using adsorption kinetics, i.e., Eqs. (9)–(11), for large
4.1. Analytical investigation
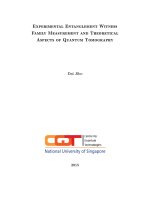
The variation in the retention factor of the studied solutes with
the amount tetrabutylammonium bromide (TBuABr) in the eluent
is presented in Fig. 2a for MeOH containing eluent (25/75 [v/v]
MeOH/water) and in Fig. 2c for MeCN containing eluent (15/75
[v/v] MeCN/water). NaCl was added to the eluents in order to keep
the ionic strength constand in all experiments, see Section 3.2 for
details. As can be seen, in both Fig. 2a and c, the retention increased with increasing the IPR in the mobile phase according to
a parabolic curvature, as expected. The increase in solute retention depends on the solute’s characteristics, mainly on the solute
lipophilicity and the number of charges that the solute have in ionized form. The smallest retention was observed in the SBS case. Increasing the solute lipophilicity increased the retention. SPTS had
5
M. Le´sko, J. Samuelsson, K. Kaczmarski et al.
Journal of Chromatography A 1656 (2021) 462541
Fig. 2. The dependence of the: a) retention factor and b) surface potential as function of concentration of IPR in the mobile phase. The mobile phase was 25/75 [v/v]
MeOH/water. Subplots c) and d) are the same as those in a), and b) except the mobile phase was 15/85 [v/v] MeCN/water.
higher retention than did SBS, while S2NS was the strongest retained because it had the highest lipophilicity of the solutes considered here. S15NS and S26NS were similar, displaying almost the
same increase in retention factor as when increasing the IPR in
the mobile phase. S15NS and S26NS differed from S2NS only in
having one more sulfone group, which significantly reduced their
lipophilicity. Moreover, SPTS and especially S2NS displayed simultaneous adsorption onto the stationary phase together with the
IPR. The other studied compounds were very weakly retained, using only the mobile phase without the IPR.
Using Eq. (2) we can estimate the surface potential for all these
experiments. Note, that the retention of some solutes at zero IPR
concentration cannot be used, due to the weak adsorption of these
solutes to the phase without IPR. A small error in the reading of k0
will manifest itself in large errors in the estimated surface potential. On the other hand, due to the nonlinear nature of the adsorption of IPR, selecting a reference state at a high IPR concentration
would not properly represent the surface potential. To solve these
issues, we calculated the surface potential at low concentrations
using a solute that has good retention, S2NS. Then we used this
surface potential in estimating k0 values for the rest of the solutes.
The estimated surface potential is plotted in Fig. 2b and d for the
mobile phase containing MeOH and MeCN, respectively. For both
the MeOH and MeCN cases, we can see that the surface potential
is more or less the same for all solutes. This indicates that the electrostatic model describes the retention well for the systems under
investigation. This also indicates that ion-pair formation in solution
in our cases are not crucial to describe the retention of the solutes.
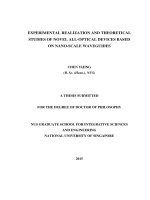
to approximately 3 mM IPR in the mobile phase, the concentration profiles were U shaped. Above this concentration, the profiles
were again Langmuirian. In the case of U-shaped profiles, the left
part of the peak decreased while the right part increased with increasing IPR concentration in the mobile phase. This phenomenon
was observed for all solutes. The only difference was in the IPR
concentration range in which the U-shaped profiles appeared, and
this was connected with the retention of the solutes. For solutes
more retained than SBS, for example, SPTS, the U-shaped profiles
could be observed at lower concentrations of IPR, and then at still
lower concentrations, they again became Langmuirian. In the case
of S2NS (not shown), characterized by very high retention in comparison with the other compounds, the shape was Langmuirian
throughout almost the entire studied IPR concentration range. Only
at 0.5 mM IPR could a small distortion of the concentration profile
be observed, with U-shaped peaks appearing between 0 and 0.5
mM IPR in the mobile phase. In the case of S15NS and S16NS, the
concentration profile distortion was observed at a slightly higher
IPR concentration than for SBS; in this case, the solute retention
was lower than for SBS at a lower IPR concentration in the mobile
phase.
4.3. Prediction of overloaded profiles - multilayer adsorption model
The interesting change in the profile shape was the basis for
deriving and validating the mathematical model for predicting
the overloaded concentration profiles. The considerations were
started from SBS which retention is negligible at 0 mM concentration IPR.The main idea of the postulated model presented
in Section 2.2 is the assumption that ion pairs are created on
the surface of the stationary phase and further interact with the
molecules of the solute, which leads to multilayer adsorption. This
is consistent with what is postulated in the dynamic exchange
models in the literature [6, 7] dynamic exchange models.
We have also tested several different models and found that the
best agreement between experiment and theory is obtained when
multilayer adsorption is assumed, see Fig. 1a. The proposed model
does not include ion pair formation in the mobile phase which
indicate that accouting this phenomenon should not improve the
prediction of the overloaded profiles. The models that were investigated and failed to describe the elution profiles were: (1) adsorption of the IPR to the phase followed by adsorption of the solute
4.2. Overloaded concentration profiles
Overloaded concentration profiles were obtained for all considered solutes and mobile phases. The experiments were conducted at several IPR concentrations spanning from 0.5 to 15 mM
with constant ionic strength of the mobile phase (see Section 3.2).
Fig. 3 presents examples of the overloaded concentration profiles
obtained for SBS, SPTS, and S15NS using a methanol/water mobile
phase containing 0.5, 1.5, 2, and 5 mM tetrabutylammonium bromide. As can be seen, the shape of the overloaded concentration
profiles changed with increasing IPR concentration in the mobile
phase. In the case of SBS with a small concentration of IPR (about
0.5 mM), the concentration profiles were Langmuirian in shape. Up
6
M. Le´sko, J. Samuelsson, K. Kaczmarski et al.
Journal of Chromatography A 1656 (2021) 462541
Fig. 3. Overloaded concentration profiles of SBS in first row (a -d), SPTS, in second row (e-h), S15NS in third row (i –l), were obtained at 0.5, 1, 2 and 5 mM ion-pair reagent
(IPR). The examples cover the different shapes of the obtained profiles, starting from Langmuirian profiles, through U-shaped profiles, to Langmuirian profiles once again
with increasing IPR concentration in the mobile phase. The injection volumes were 30, 20, and 10 μL; the mobile phase was 25/75 [v/v] MeOH/water.
Fig. 4. Experimental (solid lines) and calculated (dotted lines) concentration profiles of SBS eluted with 25/75 [v/v] MeOH/water containing: a) 0.5, b) 1, c) 1.5, d) 2, e)
5, f) 10 mM ion-pair reagent in the mobile phase. The injection volume was 30 μL. The parameters were estimated based on the concentration profiles obtained at IPR
concentrations: 0.5, 2, 5, and 10 mM.
to the already adsorbed IPR (2) as (1) but also considering the adsorption of X to the established H-layer and (3) as (1) but with an
additional layer of solute layer formed on the already established
HE-layer on the column. The lattar is without considering the adsorption of X to the established H-layer. It could be concluded that
witthout including the second solute layer as well as the adsorption of X to the established H-layer, it is impossible to predict correctly overloaded concentration profiles.
Fig. 4 presents the final results of predicting the overloaded
concentration using the discussed model. The figure shows overloaded concentration profiles of SBS obtained for MeOH eluent.
Even though the experiment was conducted using IPR concentrations up to 15 mM in the final estimations of the model parameters, only concentration profiles obtained for IPR concentrations
up to 10 mM were taken (see Table S1 in Supplementary mate-
rials). In this range (0.5–10 mM), the model predicts overloaded
concentration profiles of SBS that agree very well with experimental results. The analogous results displaying the same agreement
with experimental results in predicting the concentration profiles
of SBS eluted with MeCN eluent can be seen in Fig. S1; the model
parameters are presented in Table S2 (see Supplementary materials).
It should be noted, that the model predicts complicated U –
shaped profiles (see Fig. 4 and Fig. S1) and can follow from Langmuirian peaks to Langmuirian peaks through U – shaped peaks
without any change in the mathematical equations and values of
its parameters. This very valuable property of the model emphasizes its correctness, in our opinion. However, an unfavorable feature of the model is the lack of very good agreement or difficulties
in finding model parameters when modeling include the highest
7
M. Le´sko, J. Samuelsson, K. Kaczmarski et al.
Journal of Chromatography A 1656 (2021) 462541
Fig. 5. The adsorbed concentration profiles of: a) ion-pair reagent (H), b) SBS (E), and c) X as a function of the H and E concentrations. The mobile phase was 25/75 [v/v]
MeOH/water.
IPR concentrations, i.e., 12.5 and 15 mM, see Fig. S2 in Suplementary materials. In general, the model cannot accurately describe the
concentration profiles in the highest IPR concentration region and
there is a deterioration in prediction in all regions of IPR when
the consideration includes the H concentration from 0 to 15 mM.
The reason for this is probably that existence of a secondary sites,
i.e. the adsorption of IPR on the C18 stationary phase is somewhat more complicated with heterogenous adsorption. Here, the
adsorption is derived using electrostatic modified Langmuir models, see Section 2.2. Previous result have shown that often the adsorption of a charged molecules is best described using a more
heterogeneous model [24]. It should be noted that tetrabutylammonium bromide has four alkyl chains. The model does not recognize the way of the adsorption. The IPR can adsorb on the C18
phase in several different ways, and this probably dominates more
at higher IPR concentrations. Based on the equations, the description appears complex, but it is nevertheless insufficient to model
such complicated processes as IPC.
The proposed model predicts overloaded concentration profiles
in the SBS case with acceptable agreement with experimental results and can be useful in modeling other single charged com-
pounds which are unretained or only slightly retained without any
IPR present in the eluent. It should be noticed that analyzed problem in prediction of concentration profiles is difficult due to unusual shapes. The proposed model should also give good agreement in the cases when usual shapes of the concentration profiles are observed. In the case there would be problems with the
accuracy of the prediction of concentration profiles, for examples
when difficult shapes would be considered or wide range of IPR
concentration will be included, the model can be used separately
for different concentration of IPR. In such way an almost the perfect agreement between experimental and simulated concentration
profiles was obtained for SBS. Thus, the correlation of the model
parameters with concentration of IPR can be done and increase the
applicability of the model.
The consideration was limited to the SBS case. The other compounds (i.e., SPTS, S2NS, and S15NS) display retention without IPR
in the mobile phase or are two changed, which entails changing
the assumptions and rewriting the model; this case is not considered here.
Fig. 5 shows the corresponding adsorbed isotherm for the
MeOH eluent. Fig. 5a) for H, Fig. 5b) for SBS (E) and Fig. 5c) for X is
8
M. Le´sko, J. Samuelsson, K. Kaczmarski et al.
Journal of Chromatography A 1656 (2021) 462541
plotted as a function of the concentration of H and E in the mobile
phase. The adsorption isotherm were calculated using the determined model parameters presented in Table S1. The analogical figure for the MeCN eluent is presented in Fig. S3 (see Supplementary
material). As can be seen, the calculated amount of adsorbed H is
drastically increased with the increase of H in the mobile phase
(see Fig. 5a). It takes place up to approximately 4 mM of the H
in the eluent then beyond this range the increase is leveled out
more. This is caused by saturation of available active sites and the
repulsion of H molecules from the adsorbed H layer. The adsorption of H increase also with the increase of the E concentration in
the mobile phase. This is observed because an adsorption of E, will
decrease the: H . As mentioned before H is responsible for the
repulsion, see Eq. (3b) of H molecules thereby inhibiting the ability
to H adsorption on the stationary phase.
Fig. 5b shows the plot analogous to that in Fig. 6a, but this time
the adsorption of SBS is considered. In this case, the amount of adsorbed solute increased with the increasing concentrations of IPR
and solute in the mobile phase. Here the explanation is rather obvious: the increasing amount of SBS in the mobile phase caused
the increase in its adsorption, while the increasing number of H
molecules in the mobile phase caused the increase in the H layer
on which the solute could adsorb. Fig. 5c presents the adsorption
of X. As can be seen, the adsorption of X increased with the increasing IPR concentration due to the increasing H layer on the stationary phase; thus, more sites became available for X. The drastic
increase in X adsorption could be observed at the lower IPR concentration in the mobile phase and was connected with the abovediscussed H adsorption in this region. The adsorption isotherm
for X was more or less constant, and started decreasing with increasing IPR in the mobile phase. This was due to the decreasing
growth in available adsorption sites on the surface of adsorbed H
molecules as well as the decreasing concentrations of X in the mobile phase. Note that the model takes into account only the excess
of negatively charged ions over the IPR concentration, so for a high
concentration of IPR there is a low concentration of X. As can also
be seen, the number of adsorbed anions decreased with the increasing SBS concentration, due to increased solute adsorption and
fewer available sites on the H layer.
It should be also emphasized that the analyzed problem is very
complicated due to the solution of the model and estimation of
its parameters. As stated above, the mathematical model is implicit. The amount of adsorbed IPR depends directly on its already
adsorbed amount. This requires the use of a special method for
solving the model. Moreover, estimating the model parameters requires the use of the stochastic simulated annealing method due
to existence of many local minimums.
ized form. We found that a simple electrostatic model based on
the Gouy–Chapman theory that does not consider ion pair formation in solution could be used to describe the retention. The determined electrostatic potential as a function of IPR concentration
were found to be larger in the MeCN case, resulted in a more sensitive system to IPR changes especially for solutes with multiple
charges.
In contrast to the analytical mode, in which typical and expected IPC results were obtained, the overloaded mode resulted
in interesting overloaded concentration profiles. The shapes of the
overloaded concentration profiles changed with increasing IPR concentration in the mobile phase. In the case of SBS with a low concentration of IPR (about 0.5 mM), the concentration profiles were
Langmuirian in shape. Then, up to approximately 3 mM IPR in the
mobile phase, the concentration profiles were U-shaped. Above this
concentration, the profiles were again Langmuirian. This pattern
was observed for all solutes, which differed only in the IPR concentration range in which the U-shaped profiles appeared; this range
was directly connected with the retention of the solutes.
To predict the overloaded concentration profiles, a multilayer
electrostatic modified adsorption model was derived. The model
assumed that lipophilic IPR would adsorb on the stationary phase,
creating the charged active sites serving as exchange sites for the
solute. The solute would then adsorb on the already formed IPR
layer. It was also found that subsequent adsorption layer of solute
could form on the already formed complex due to hydrophobic
interaction between the solute molecules. The excess of the anions over the IPR had to be included in the model equations. The
electrostatic contribution were account for by introducing electrostatic attraction and repulsion of the molecules, depending on the
considered situation. The prediction was limited to SBS, for which
good agreement with experimental results was obtained.
Here, we have demonstrated that the applied methodology and
mathematical model, including the proposed description of the adsorption/desorption process, led to good agreement between simulated and experimental results. The model allowed us to predict
overloaded concentration profiles for SBS with good accuracy over
a wide range of IPR concentrations in the mobile phase in the
studied cases.
5. Conclusion
Marek Les´ ko: Conceptualization, Methodology, Investigation,
Validation, Formal analysis, Resources, Writing – original draft,
Writing – review & editing, Visualization. Jörgen Samuelsson:
Conceptualization, Methodology, Validation, Formal analysis, Writing – review & editing. Krzysztof Kaczmarski: Conceptualization,
Methodology, Investigation, Software, Validation, Formal analysis,
Data curation, Writing – review & editing, Supervision. Torgny
Fornstedt: Conceptualization, Data curation, Writing – review &
editing, Supervision, Project administration, Funding acquisition.
Declaration of Competing Interest
The authors declare that they have no known competing financial interests or personal relationships that could have appeared to
influence the work reported in this paper.
CRediT authorship contribution statement
In this study we considered ion-pair chromatography (IPC). Attention was focused on numerically modeling the overloaded concentration profiles to develop the models and tools needed for this
type of chromatography.
The mobile phase consisted of two eluents (i.e., 25/75 [v/v]
MeOH/water and 15/85 MeCN/water) containing the ion-pair
reagent (IPR), which was tetrabutylammonium bromide. The concentration of IPR in the mobile phase ranged from 0 to 15 mM
while the ionic strength was kept at a constant 15 mM by addition
of NaCl to the eluents. The model solutes were the sodium salts of
sulfonic acids and a XBridge C18 column was used.
The retention factors of the eluted solutes increased with increasing the IPR in the mobile phase according to a parabolic
curve, as expected. The increased retention of the solute was dependent on the nature of the solute: i.e., on the solute’s lipophilicity and on the number of charges that the molecules had in ion-
Acknowledgements
This work was supported by the Swedish Knowledge Foundation via the KKS SYNERGY project “BIO-QC: Quality Control and Purification for New Biological Drugs” (grant number 20170059) and
by the Swedish Research Council (VR) via the project “Fundamental
Studies on Molecular Interactions aimed at Preparative Separations
and Biospecific Measurements” (grant number 2015-04627).
9
M. Le´sko, J. Samuelsson, K. Kaczmarski et al.
Journal of Chromatography A 1656 (2021) 462541
Supplementary materials
[12] J. Ståhlberg, I. Hägglund, Adsorption isotherm of tetrabutylammonium ion and
its relation to the mechanism of ion pair chromatography, Anal. Chem. 60
(1988) 1958–1964.
[13] T. Fornstedt, P. Forssén, D. Westerlund, System peaks and their impact in liquid chromatography, TrAC Trends Anal. Chem. (2016), doi:10.1016/j.trac.2016.
01.008.
[14] E. Glenne, J. Samuelsson, H. Leek, P. Forssén, M. Klarqvist, T. Fornstedt, Systematic investigations of peak distortions due to additives in supercritical fluid
chromatography, J. Chromatogr. A. 1621 (2020) 461048, doi:10.1016/j.chroma.
2020.461048.
[15] K. Mihlbachler, K. Kaczmarski, A. Seidel-Morgenstern, G. Guiochon, Measurement and modeling of the equilibrium behavior of the Troger’s base enantiomers on an amylose-based chiral stationary phase, J. Chromatogr. A. 955
(2002) 35–52, doi:10.1016/s0021- 9673(02)00228- 5.
[16] Krzysztof Kaczmarski, Mieczysław Sajewicz, Wojciech Prus, Teresa Kowalska,
Analyte-analyte interactions, effect on TLC band formation, Encyclopedia of
Chromatography, Marcel Dekker, Inc, 2004 by.
˚
[17] D. Asberg,
M. Les´ ko, T. Leek, J. Samuelsson, K. Kaczmarski, T. Fornstedt, Estimation of nonlinear adsorption isotherms in gradient elution RP-LC of peptides
in the presence of an adsorbing additive, Chromatographia 80 (2017) 961–966,
doi:10.1007/s10337- 017- 3298- y.
˚
[18] D. Asberg,
A. Langborg Weinmann, T. Leek, R.J. Lewis, M. Klarqvist, M. Les´ ko,
K. Kaczmarski, J. Samuelsson, T. Fornstedt, The importance of ion-pairing in
peptide purification by reversed-phase liquid chromatography, J. Chromatogr.
A. 1496 (2017) 80–91, doi:10.1016/j.chroma.2017.03.041.
[19] G. Guiochon, D.G. Shirazi, A. Felinger, A.M. Katti, Fundamentals of Preparative
and Nonlinear Chromatography, 2nd ed., Academic Press, Boston, MA, 2006.
[20] J. Ståhlberg, The Gouy—Chapman theory in combination with a modified Langmuir isotherm as a theoretical model for ion-pair chromatography, J. Chromatogr. A. 356 (1986) 231–245, doi:10.1016/S0 021-9673(0 0)91485-7.
[21] K. Kaczmarski, M. Mazzotti, G. Storti, M. Morbidelli, Modeling fixed-bed adsorption columns through orthogonal collocations on moving finite elements,
Comput. Chem. Eng. 21 (1997) 641–660, doi:10.1016/S0 098-1354(96)0 030 0-6.
[22] K. Kaczmarski, D. Antos, Calculation of chromatographic band profiles with
an implicit isotherm, J. Chromatogr. A. 862 (1999) 1–16, doi:10.1016/
S0 021-9673(99)0 0901-2.
[23] K. Kaczmarski, D. Antos, Use of simulated annealing for optimization of chromatographic separations, Acta Chromatogr. 17 (2006) 20–45.
[24] J. Samuelsson, A. Franz, B.J. Stanley, T. Fornstedt, Thermodynamic characterization of separations on alkaline-stable silica-based C18 columns: Why basic
solutes may have better capacity and peak performance at higher pH, J. Chromatogr. A. 1163 (2007) 277–189, doi:10.1016/j.chroma.2007.06.026.
Supplementary material associated with this article can be
found, in the online version, at doi:10.1016/j.chroma.2021.462541.
References
[1] T. Cecchi, Ion pairing chromatography, Crit. Rev. Anal. Chem. 38 (2008) 161–
213, doi:10.1080/10408340802038882.
[2] E. Valeur, S.M. Guéret, H. Adihou, R. Gopalakrishnan, M. Lemurell, H. Waldmann, T.N. Grossmann, A.T. Plowright, New modalities for challenging targets
in drug discovery, Angew. Chem. Int. Ed. 56 (2017) 10294–10323, doi:10.1002/
anie.201611914.
[3] M. Enmark, J. Bagge, J. Samuelsson, L. Thunberg, E. Örnskov, H. Leek,
F. Limé, T. Fornstedt, Analytical and preparative separation of phosphorothioated oligonucleotides: columns and ion-pair reagents, Anal Bioanal. Chem.
412 (2020) 299–309, doi:10.10 07/s0 0216- 019- 02236- 9.
[4] M. Enmark, S. Harun, J. Samuelsson, E. Örnskov, L. Thunberg, A. Dahlén,
T. Fornstedt, Selectivity limits of and opportunities for ion pair chromatographic separation of oligonucleotides, J. Chromatogr. A 1651 (2021) 462269,
doi:10.1016/j.chroma.2021.462269.
[5] J.H. Knox, G.R. Laird, Soap chromatography—a new high-performance liquid
chromatographic technique for separation of ionizable materials: dyestuff intermediates, J. Chromatogr. A. 122 (1976) 17–34, doi:10.1016/S0 021-9673(0 0)
82234-7.
[6] C. Horvath, W. Melander, I. Molnar, P. Molnar, Enhancement of retention by
ion-pair formation in liquid chromatography with nonpolar stationary phases,
Anal. Chem. 49 (1977) 2295–2305, doi:10.1021/ac50022a048.
[7] N.E. Hoffman, J.C. Liao, Reversed phase high performance liquid chromatographic separations of nucleotides in the presence of solvophobic ions, Anal.
Chem. 49 (1977) 2231–2234, doi:10.1021/ac50022a030.
[8] A. Tilly-Melin, Y. Askemark, K.G. Wahlund, G. Schill, Retention behavior of carboxylic acids and their quaternary ammonium ion pairs in reversed phase
chromatography with acetonitrile as organic modifier in the mobile phase,
Anal. Chem. 51 (1979) 976–983, doi:10.1021/ac50043a045.
[9] C. Horvath, W. Melander, I. Molnar, Liquid chromatography of ionogenic substances with nonpolar stationary phases, Anal. Chem. 49 (1977) 142–154,
doi:10.1021/ac50 0 09a044.
[10] F.F. Cantwell, Retention model for ion-pair chromatography based on doublelayer ionic adsorption and exchange, J. Pharm. Biomed. Anal. 2 (1984) 153–164,
doi:10.1016/0731-7085(84)80066-7.
[11] Á. Bartha, J. Ståhlberg, Electrostatic retention model of reversed-phase ion-pair
chromatography, 9th Danube Symp. Chromatogr. 668 (1994) 255–284, doi:10.
1016/0021-9673(94)80116-9.
10