Báo cáo khoa học: "TrustRank: Inducing Trust in Automatic Translations via Ranking" pptx
Bạn đang xem bản rút gọn của tài liệu. Xem và tải ngay bản đầy đủ của tài liệu tại đây (237.86 KB, 10 trang )
Proceedings of the 48th Annual Meeting of the Association for Computational Linguistics, pages 612–621,
Uppsala, Sweden, 11-16 July 2010.
c
2010 Association for Computational Linguistics
TrustRank: Inducing Trust in Automatic Translations via Ranking
Radu Soricut
Language Weaver, Inc.
6060 Center Drive, Suite 150
Los Angeles, CA 90045
Abdessamad Echihabi
Language Weaver, Inc.
6060 Center Drive, Suite 150
Los Angeles, CA 90045
Abstract
The adoption of Machine Translation tech-
nology for commercial applications is
hampered by the lack of trust associated
with machine-translated output. In this pa-
per, we describe TrustRank, an MT sys-
tem enhanced with a capability to rank the
quality of translation outputs from good to
bad. This enables the user to set a quality
threshold, granting the user control over
the quality of the translations.
We quantify the gains we obtain in trans-
lation quality, and show that our solution
works on a wide variety of domains and
language pairs.
1 Introduction
The accuracy of machine translation (MT) soft-
ware has steadily increased over the last 20 years
to achieve levels at which large-scale commercial
applications of the technology have become feasi-
ble. However, widespread adoption of MT tech-
nology remains hampered by the lack of trust as-
sociated with machine-translated output. This lack
of trust is a normal reaction to the erratic trans-
lation quality delivered by current state-of-the-
art MT systems. Unfortunately, the lack of pre-
dictable quality discourages the adoption of large-
scale automatic translation solutions.
Consider the case of a commercial enterprise
that hosts reviews written by travellers on its web
site. These reviews contain useful information
about hotels, restaurants, attractions, etc. There
is a large and continuous stream of reviews posted
on this site, and the large majority is written in En-
glish. In addition, there is a large set of potential
customers who would prefer to have these reviews
available in their (non-English) native languages.
As such, this enterprise presents the perfect oppor-
tunity for the deployment of a large-volume MT
solution. However, travel reviews present specific
challenges: the reviews tend to have poor spelling,
loose grammar, and broad topics of discussion.
The result is unpredictable levels of MT quality.
This is undesirable for the commercial enterprise,
who is not content to simply reach a broad audi-
ence, but also wants to deliver a high-quality prod-
uct to that audience.
We propose the following solution. We develop
TrustRank, an MT system enhanced with a ca-
pability to rank the quality of translation outputs
from good to bad. This enables the user to set a
quality threshold, granting the user control over
the quality of the translations that it employs in
its product. With this enhancement, MT adop-
tion stops being a binary should-we-or-shouldn’t-
we question. Rather, each user can make a per-
sonal trade-off between the scope and the quality
of their product.
2 Related Work
Work on automatic MT evaluation started with the
idea of comparing automatic translations against
human-produced references. Such comparisons
are done either at lexical level (Papineni et al.,
2002; Doddington, 2002), or at linguistically-
richer levels using paraphrases (Zhou et al., 2006;
Kauchak and Barzilay, 2006), WordNet (Lavie and
Agarwal, 2007), or syntax (Liu and Gildea, 2005;
Owczarzak et al., 2007; Yang et al., 2008; Amig
´
o
et al., 2009). In contrast, we are interested in per-
forming MT quality assessments on documents for
which reference translations are not available.
Reference-free approaches to automatic MT
quality assessment, based on Machine Learning
techniques such as classification (Kulesza and
Shieber, 2004), regression (Albrecht and Hwa,
2007), and ranking (Ye et al., 2007; Duh, 2008),
have a different focus compared to ours. Their ap-
proach, which uses a test set that is held constant
and against which various MT systems are mea-
612
sured, focuses on evaluating system performance.
Similar proposals exist outside the MT field, for
instance in syntactic parsing (Ravi et al., 2008). In
this case, the authors focus on estimating perfor-
mance over entire test sets, which in turn is used
for evaluating system performance. In contrast,
we focus on evaluating the quality of the trans-
lations themselves, while the MT system is kept
constant.
A considerable amount of work has been done
in the related area of confidence estimation for
MT, for which Blatz et al. (2004) provide a good
overview. The goal of this work is to identify small
units of translated material (words and phrases)
for which one can be confident in the quality of
the translation. Related to this goal, and closest to
our proposal, is the work of Gamon et al. (2005)
and Specia et al. (2009). They describe Ma-
chine Learning approaches (classification and re-
gression, respectively) aimed at predicting which
sentences are likely to be well/poorly translated.
Our work, however, departs from all these works
in several important aspects.
First, we want to make the quality predic-
tions at document-level, as opposed to sentence-
level (Gamon et al., 2005; Specia et al., 2009), or
word/phrase-level (Blatz et al., 2004; Ueffing and
Ney, 2005). Document-level granularity is a re-
quirement for large-scale commercial applications
that use fully-automated translation solutions. For
these applications, the need to make the distinction
between “good translation” and “poor translation”
must be done at document level. Otherwise, it is
not actionable. In contrast, quality-prediction or
confidence estimation at sentence- or word-level
fits best a scenario in which automated translation
is only a part of a larger pipeline. Such pipelines
usually involve human post-editing, and are useful
for translation productivity (Lagarda et al., 2009).
Such solutions, however, suffer from the inherent
volume bottleneck associated with human involve-
ment. Our fully-automated solution targets large
volume translation needs, on the order of 10,000
documents/day or more.
Second, we use automatically generated train-
ing labels for the supervised Machine Learning
approach. In the experiments presented in this pa-
per, we use BLEU scores (Papineni et al., 2002)
as training labels. However, they can be substi-
tuted with any of the proposed MT metrics that use
human-produced references to automatically as-
sess translation quality (Doddington, 2002; Lavie
and Agarwal, 2007). In a similar manner, the
work of (Specia et al., 2009) uses NIST scores,
and the work of (Ravi et al., 2008) uses PARSE-
VAL scores. The main advantage of this approach
is that we can generate quickly and cheaply as
many learning examples as needed. Additionally,
we can customize the prediction models on a large
variety of genres and domains, and quickly scale
to multiple language pairs. In contrast, solutions
that require training labels produced manually by
humans (Gamon et al., 2005; Albrecht and Hwa,
2007) have difficulties producing prediction mod-
els fast enough, trained on enough data, and cus-
tomized for specific domains.
Third, the main metric we use to assess the per-
formance of our solution is targeted directly at
measuring translation quality gains. We are inter-
ested in the extrinsic evaluation of the quantitative
impact of the TrustRank solution, rather than in
the intrinsic evaluation of prediction errors (Ravi
et al., 2008; Specia et al., 2009).
3 Experimental Framework
3.1 Domains
We are interested in measuring the impact of
TrustRank on a variety of genres, domains, and
language pairs. Therefore, we set up the exper-
imental framework accordingly. We use three
proprietary data sets, taken from the domains of
Travel (consumer reviews), Consumer Electron-
ics (customer support for computers, data storage,
printers, etc.), and HighTech (customer support for
high-tech components). All these data sets come
in a variety of European and Asian language pairs.
We also use the publicly available data set used
in the WMT09 task (Koehn and Haddow, 2009)
(a combination of European parliament and news
data). Information regarding the sizes of these data
sets is provided in Table 2.
3.2 Metrics
We first present the experimental framework de-
signed to answer the main question we want to
address: can we automatically produce a ranking
for document translations (for which no human-
produced references are available), such that the
translation quality of the documents at the top of
this ranking is higher than the average translation
quality? To this end, we use several metrics that
can gauge how well we answer this question.
613
The first metric is Ranking Accuracy (rAcc),
see (Gunawardana and Shani, 2009). We are inter-
ested in ranking N documents and assigning them
into n quantiles. The formula is:
rAcc[n] = Avg
n
i=1
TP
i
N
n
=
1
N
× Σ
n
i=1
TP
i
where TP
i
(True-Positive
i
) is the number of
correctly-assigned documents in quantile i. Intu-
itively, this formula is an average of the ratio of
documents correctly assigned in each quantile.
The rAcc metric provides easy to understand
lowerbounds and upperbounds. For example, with
a method that assigns random ranks, when using 4
quantiles, the accuracy is 25% in any of the quan-
tiles, hence an rAcc of 25%. With an oracle-based
ranking, the accuracy is 100% in any of the quan-
tiles, hence an rAcc of 100%. Therefore, the per-
formance of any decent ranking method, when us-
ing 4 quantiles, can be expected to fall somewhere
between these bounds.
The second and main metric is the volume-
weighted BLEU gain (vBLEU∆) metric. It mea-
sures the average BLEU gain when trading-off
volume for accuracy on a predefined scale. The
general formula, for n quantiles, is
vBLEU∆[n] = Σ
n−1
i=1
w
i
× (BLEU
1 i
− BLEU)
with w
i
=
i
n
Σ
n−1
j=1
j
n
=
i
Σ
n−1
j=1
j
=
2i
n(n−1)
where BLEU
1 i
is the BLEU score of the first
i quantiles, and BLEU is the score over all the
quantiles. Intuitively, this formula provides a
volume-weighted average of the BLEU gain ob-
tained while varying the threshold of acceptance
from 1 to n-1. (A threshold of acceptance set to
the n-th quantile means accepting all the transla-
tions and therefore ignore the rankings, so we do
not include it in the average.) Without rankings
(or with random ranks), the expected vBLEU∆[n]
is zero, as the value BLEU
1 i
is expected to be
the same as the overall BLEU for any i. With ora-
cle ranking, the expected vBLEU∆[n] is a positive
number representative of the upperbound on the
quality of the translations that pass an acceptance
threshold. We report the vBLEU∆[n] values as
signed numbers, both within a domain and when
computed as an average across domains.
The choice regarding the number of quantiles
is closely related to the choice of setting an ac-
ceptance quality threshold. Because we want the
solution to stay unchanged while the acceptance
quality threshold can vary, we cannot treat this as
a classification problem. Instead, we need to pro-
vide a complete ranking over an input set of doc-
uments. As already mentioned, TrustRank uses a
regression method that is trained on BLEU scores
as training labels. The regression functions are
then used to predict a BLEU-like number for each
document in the input set. The rankings are de-
rived trivially from the predicted BLEU numbers,
by simply sorting from highest to lowest. Ref-
erence ranking is obtained similarly, using actual
BLEU scores.
Although we are mainly interested in the rank-
ing problem here, it helps to look at the error pro-
duced by the regression models to arrive at a more
complete picture. Besides the two metrics for
ranking described above, we use the well-known
regression metrics MAE (mean absolute error) and
TE (test-level error):
MAE =
1
N
× Σ
N
k=1
|predBLEU
k
− BLEU
k
|
TE = predBLEU − BLEU
where BLEU
k
is the BLEU score for document
k, predBLEU
k
is the predicted BLEU value, and
predBLEU is a weighted average of the predicted
document-level BLEU numbers over the entire set
of N documents.
3.3 Experimental conditions
The MT system used by TrustRank (TrustRank-
MT) is a statistical phrase-based MT system sim-
ilar to (Och and Ney, 2004). As a reference point
regarding the performance of this system, we use
the official WMT09 parallel data, monolingual
data, and development tuning set (news-dev2009a)
to train baseline TrustRank-MT systems for each
of the ten WMT09 language pairs. Our system
produces translations that are competitive with
state-of-the-art systems. We show our baseline-
system BLEU scores on the official development
test set (news-dev2009b) for the WMT09 task in
Table 1, along with the BLEU scores reported for
the baseline Moses system (Koehn and Haddow,
2009).
For each of the domains we consider, we par-
tition the data sets as follows. We first set aside
3000 documents, which we call the Regression
set
1
. The remaining data is called the training MT
1
For parallel data for which we do not have document
614
From Eng Fra Spa Ger Cze Hun
Moses 17.8 22.4 13.5 11.4 6.5
TrustRank-MT 21.3 22.8 14.3 9.1 8.5
Into Eng Fra Spa Ger Cze Hun
Moses 21.2 22.5 16.6 16.9 8.8
TrustRank-MT 22.4 23.8 19.8 13.3 10.4
Table 1: BLEU scores (uncased) for the
TrustRank-MT system compared to Moses
(WMT09 data).
set, on which the MT system is trained. From the
Regression set, we set aside 1000 parallel docu-
ments to be used as a blind test set (called Regres-
sion Test) for our experiments. An additional set
of 1000 parallel documents is used as a develop-
ment set, and the rest of 1000 parallel documents
is used as the regression-model training set.
We have also performed learning-curve exper-
iments using between 100 and 2000 documents
for regression-model training. We do not go into
the details of these experiments here for lack of
space. The conclusion derived from these exper-
iments is that 1000 documents is the point where
the learning-curves level off.
In Table 2, we provide a few data points with
respect to the data size of these sets (tokenized
word-count on the source side). We also report the
BLEU performance of the TrustRank-MT system
on the Regression Test set.
Note that the differences between the BLEU
scores reported in Table 1 and the BLEU scores
under the WMT09 label in Table 2 reflect dif-
ferences in the genres of these sets. The offi-
cial development test set (news-dev2009b) for the
WMT09 task is news only. The regression Test
sets have the same distribution between Europarl
data and news as the corresponding training data
set for each language pair.
4 The ranking algorithm
As mentioned before, TrustRank takes a super-
vised Machine Learning approach. We automat-
ically generate the training labels by computing
BLEU scores for every document in the Regres-
sion training set.
boundaries, we simply simulate document boundaries after
every 10 consecutive sentences.
LP MT set Regression set
Train Train Test BLEU
WMT09
Eng-Spa
41Mw 277Kw 281Kw 41.0
Eng-Fra 41Mw 282Kw 283Kw 37.1
Eng-Ger 41Mw 282Kw 280Kw 23.7
Eng-Cze 1.2Mw 241Kw 242Kw 10.3
Eng-Hun 30Mw 209Kw 206Kw 14.5
Spa-Eng 42Mw 287Kw 293Kw 40.1
Fra-Eng 44Mw 305Kw 308Kw 37.9
Ger-Eng 39Mw 269Kw 267Kw 29.4
Cze-Eng 1.0Mw 218Kw 219Kw 19.7
Hun-Eng 26Mw 177Kw 176Kw 24.0
Travel
Eng-Spa 4.3Mw 123Kw 121Kw 31.2
Eng-Fra 3.5Mw 132Kw 126Kw 27.8
Eng-Ita 3.4Mw 179Kw 183Kw 22.5
Eng-Por 13.1Mw 83Kw 83Kw 41.9
Eng-Ger 7.0Mw 69Kw 69Kw 27.6
Eng-Dut 0.7Mw 89Kw 84Kw 41.9
Electronics
Eng-Spa 7.0Mw 150Kw 149Kw 65.2
Eng-Fra 6.5Mw 129Kw 129Kw 55.8
Eng-Ger 5.9Mw 139Kw 140Kw 42.1
Eng-Chi
7.1Mw 135Kw 136Kw 63.9
Eng-Por 2.0Mw 124Kw 115Kw 47.9
HiTech
Eng-Spa 2.8Mw 143Kw 148Kw 59.0
Eng-Ger 5.1Mw 162Kw 155Kw 36.6
Eng-Chi 5.6Mw 131Kw 129Kw 60.6
Eng-Rus 2.8Mw 122Kw 117Kw 39.2
Eng-Kor 4.2Mw 129Kw 140Kw 49.4
Table 2: Data sizes and BLEU on Regression Test.
4.1 The learning method
The results we report here are obtained using
the freely-available Weka engine
2
. We have
compared and contrasted results using all the
regression packages offered by Weka, includ-
ing regression functions based on simple and
multiple-feature Linear regression, Pace regres-
sion, RBF networks, Isotonic regression, Gaussian
Processes, Support Vector Machines (with SMO
optimization) with polynomial and RBF kernels,
and regression trees such as REP trees and M5P
trees. Due to lack of space and the tangential im-
pact on the message of this paper, we do not report
2
Weka software at />version 3.6.1, June 2009.
615
these contrastive experiments here.
The learning technique that consistently
yields the best results is M5P regression trees
(weka.classifiers.trees.M5P). Therefore, we report
all the results in this paper using this learning
method. As an additional advantage, the decision
trees and the regression models produced in train-
ing are easy to read, understand, and interpret.
One can get a good insight into what the impact
of a certain feature on a final predicted value is by
simply inspecting these trees.
4.2 The features
In contrast to most of the work on confidence es-
timation (Blatz et al., 2004), the features we use
are not internal features of the MT system. There-
fore, TrustRank can be applied for a large variety
of MT approaches, from statistical-based to rule-
based approaches.
The features we use can be divided into text-
based, language-model–based, pseudo-reference–
based, example-based, and training-data–based
feature types. These feature types can be com-
puted either on the source-side (input documents)
or on the target-side (translated documents).
Text-based features
These features simply look at the length of the in-
put in terms of (tokenized) number of words. They
can be applied on the input, where they induce a
correlation between the number of words in the in-
put document and the expected BLEU score for
that document size. They can also be applied on
the produced output, and learn a similar correla-
tion for the produced translation.
Language-model–based features
These features are among the ones that were first
proposed as possible differentiators between good
and bad translations (Gamon et al., 2005). They
are a measure of how likely a collection of strings
is under a language model trained on monolingual
data (either on the source or target side).
The language-model–based feature values we
use here are computed as document-level per-
plexity numbers using a 5-gram language model
trained on the MT training set.
Pseudo-reference–based features
Previous work has shown that, in the absence
of human-produced references, automatically-
produced ones are still helpful in differentiating
between good and bad translations (Albrecht and
Hwa, 2008). When computed on the target side,
this type of features requires one or more sec-
ondary MT systems, used to generate transla-
tions starting from the same input. These pseudo-
references are useful in gauging translation con-
vergence, using BLEU scores as feature values.
In intuitive terms, their usefulness can be summa-
rized as follows: “if system X produced a trans-
lation A and system Y produced a translation B
starting from the same input, and A and B are sim-
ilar, then A is probably a good translation”.
An important property here is that systems X
and Y need to be as different as possible from each
other. This property ensures that a convergence on
similar translations is not just an artifact, but a true
indication that the translations are correct. The
secondary systems we use here are still phrase-
based, but equipped with linguistically-oriented
modules similar with the ones proposed in (Collins
et al., 2005; Xu et al., 2009).
The source-side pseudo-reference–based fea-
ture type is of a slightly different nature. It still re-
quires one or more secondary MT systems, but op-
erating in the reverse direction. A translated doc-
ument produced by the main MT system is fed to
the secondary MT system(s), translated back into
the original source language, and used as pseudo-
reference(s) when computing a BLEU score for
the original input. In intuitive terms: “if system
X takes document A and produces B, and system
X
−1
takes B and produces C, and A and C are
similar, then B is probably a good translation”.
Example-based features
For example-based features, we use a develop-
ment set of 1000 parallel documents, for which we
produce translations and compute document-level
BLEU scores. We set aside the top-100 BLEU
scoring documents and bottom-100 BLEU scoring
documents. They are used as positive examples
(with better-than-average BLEU) and negative ex-
amples (with worse-than-average BLEU), respec-
tively. We define a positive-example–based fea-
ture function as a geometric mean of 1-to-4–gram
precision scores (i.e., BLEU score without length
penalty) between a document (on either source
or target side) and the positive examples used as
references (similarly for negative-example–based
features).
The intuition behind these features can be sum-
marized as follows: “if system X translated docu-
616
ment A well/poorly, and A and B are similar, then
system X probably translates B well/poorly”.
Training-data–based features
If the main MT system is trained on a parallel cor-
pus, the data in this corpus can be exploited to-
wards assessing translation quality (Specia et al.,
2009). In our context, the documents that make up
this corpus can be used in a fashion similar with
the positive examples. One type of training-data–
based features operates by computing the number
of out-of-vocabulary (OOV) tokens with respect to
the training data (on either source or target side).
A more powerful type of training-data–based
features operates by computing a BLEU score be-
tween a document (source or target side) and the
training-data documents used as references. Intu-
itively, we assess the coverage with respect to the
training data and correlate it with a BLEU score:
“if the n-grams of input document A are well cov-
ered by the source-side of the training data, the
translation of A is probably good” (on the source
side); “if the n-grams in the output translation B
are well covered by the target-side of the parallel
training data, then B is probably a good transla-
tion” (on the target side).
4.3 Results
We are interested in the best performance for
TrustRank using the features described above. In
this section, we focus on reporting the results ob-
tain for the English-Spanish language pair. In the
next section, we report results obtained on all the
language pairs we considered.
Before we discuss the results of TrustRank, let
us anchor the numerical values using some lower-
and upper-bounds. As a baseline, we use a re-
gression function that outputs a constant number
for each document, equal to the BLEU score of
the Regression Training set. As an upperbound,
we use an oracle regression function that outputs a
number for each document that is equal to the ac-
tual BLEU score of that document. In Table 4, we
present the performance of these regression func-
tions across all the domains considered.
As already mentioned, the rAcc values are
bounded by the 25% lowerbound and the 100%
upperbound. The vBLEU∆ values are bounded by
0 as lowerbound, and some positive BLEU gain
value that varies among the domains we consid-
ered from +6.4 (Travel) to +13.5 (HiTech).
The best performance obtained by TrustRank
Domain rAcc vBLEU∆[4] MAE TE
Baseline
WMT09 25% 0 9.9 +0.4
Travel 25% 0 8.3 +2.0
Electr. 25% 0 12.2 +2.6
HiTech 25% 0 16.9 +2.4
Dom. avg. 25% 0 11.8 1.9
Oracle
WMT09
100% +8.2 0 0
Travel 100% +6.4 0 0
Electr. 100% +9.2 0 0
HiTech 100% +13.5 0 0
Dom. avg. 100% +9.3 0 0
Table 4: Lower- and upper-bounds for ranking and
regression accuracy (English-Spanish).
for English-Spanish, using all the features de-
scribed, is presented in Table 3. The ranking ac-
curacy numbers on a per-quantile basis reveals
an important property for the approach we ad-
vocate. The ranking accuracy on the first quan-
tile Q
1
(identifying the best 25% of the transla-
tions) is 52% on average across the domains. For
the last quantile Q
4
(identifying the worst 25% of
the translations), it is 56%. This is much better
than the ranking accuracy for the median-quality
translations (35-37% accuracy for the two middle
quantiles). This property fits well our scenario, in
which we are interested in associating trust in the
quality of the translations in the top quantile.
The quality of the top quantile translations is
quantifiable in terms of BLEU gain. The 250 doc-
ument translations in Q
1
for Travel have a BLEU
score of 38.0, a +6.8 BLEU gain compared to the
overall BLEU of 31.2 (Q
1−4
). The Q
1
HiTech
translations, with a BLEU of 77.9, have a +18.9
BLEU gain compared to the overall BLEU of
59.0. The TrustRank algorithm allows us to trade-
off quantity versus quality on any scale. The re-
sults under the BLEU heading in Table 3 repre-
sent an instantiation of this ability to a 3-point
scale (Q
1
,Q
1−2
,Q
1−3
). The vBLEU∆ numbers
reflect an average of the BLEU gains for this in-
stantiation (e.g., a +11.6 volume-weighted average
BLEU gain for the HiTech domain).
We are also interested in the best performance
under more restricted conditions, such as time
constraints. The assumption we make here is that
the translation time dwarfs the time needed for fea-
617
Domain Ranking Accuracy Translation Accuracy MAE TE
BLEU vBLEU∆[4]
Q
1
Q
2
Q
3
Q
4
rAcc Q
1
Q
1−2
Q
1−3
Q
1−4
WMT09
34% 26% 29% 40% 32% 44.8 43.6 42.4 41.1 +2.1 9.6 -0.1
Travel 50% 26% 29% 41% 36% 38.0 35.1 33.0 31.2 +3.4 7.4 -1.9
Electronics 57% 38% 39% 68% 51% 76.1 72.7 69.6 65.2 +6.5 8.4 -2.6
HiTech 65% 48% 49% 75% 59% 77.9 72.7 66.7 59.0 +11.6 8.6 -2.1
Dom. avg. 52% 35% 37% 56% 45% - +5.9 8.5 1.7
Table 3: Detailed performance using all features (English-Spanish).
ture and regression value computation. Therefore,
the most time-expensive feature is the source-side
pseudo-reference–based feature, which effectively
doubles the translation time required. Under the
“time-constrained” condition, we exclude this fea-
ture and use all of the remaining features. Table 5
presents the results obtained for English-Spanish.
Domain rAcc vBLEU∆[4] MAE TE
“Time-constrained” condition
WMT09 32% +2.1 9.6 -0.1
Travel 35% +3.2 7.4 -1.8
Electronics 50% +6.3 8.4 -2.2
HiTech 59% +11.6 8.9 -2.1
Dom. avg. 44% +5.8 8.6 1.6
Table 5: “Time-constrained” performance
(English-Spanish).
The results presented above allow us to draw a
series of conclusions.
Benefits vary by domain
Even with oracle rankings (Table 4), the benefits
vary from one domain to the next. For Travel, with
an overall BLEU score in the low 30s (31.2), we
stand to gain at most +6.4 BLEU points on average
(+6.4 vBLEU∆ upperbound). For a domain such
as HiTech, even with a high overall BLEU score
close to 60 (59.0), we stand to gain twice as much
(+13.5 vBLEU∆ upperbound).
Performance varies by domain
As the results in Table 3 show, the best perfor-
mance we obtain also varies from one domain to
the next. For instance, the ranking accuracy for
the WMT09 domain is only 32%, while for the
HiTech domain is 59%. Also, the BLEU gain for
the WMT09 domain is only +2.1 vBLEU∆ (com-
pared to the upperbound vBLEU∆ of +8.2, it is
only 26% of the oracle performance). In contrast,
the BLEU gain for the HiTech domain is +11.6
vBLEU∆ (compared to the +13.5 vBLEU∆ up-
perbound, it is 86% of the oracle performance).
Positive feature synergy and overlap
The features we described capture different infor-
mation, and their combination achieves the best
performance. For instance, in the Electronics do-
main, the best single feature is the target-side n-
gram coverage feature, with +5.3 vBLEU∆. The
combination of all features gives a +6.5 vBLEU∆.
The numbers in Table 3 also show that elimi-
nating some of the features results in lower perfor-
mance. The rAcc drops from 45% to 44% in under
the “time-constraint” condition (Table 5). The dif-
ference in the rankings is statistically significant at
p < 0.01 using the Wilcoxon test (Dem
ˇ
sar, 2006).
However, this drop is quantitatively small (1%
rAcc drop, -0.1 in vBLEU∆, averaged across do-
mains). This suggests that, even when eliminating
features that by themselves have a good discrim-
inatory power (the source-side pseudo-reference–
based feature achieves a +5.0 vBLEU∆ as a sin-
gle feature in the Electronics domain), the other
features compensate to a large degree.
Poor regression performance
By looking at the results of the regression metrics,
we conclude that the predicted BLEU numbers are
not accurate in absolute value. The aggregated
Mean Absolute Error (MAE) is 8.5 when using all
the features. This is less than the baseline MAE of
11.8, but it is too high to allow us to confidently
use the document-level BLEU numbers as reliable
indicators of translation accuracy. The Test Error
(TE) numbers are not encouraging either, as the
1.7 TE of TrustRank is close to the baseline TE of
1.9 (see Table 4 for baseline numbers).
618
5 Large-scale experimental results
In this section, we present the performance of
TrustRank on a variety of language pairs (Table 6).
We report the BLEU score obtained on our 1000-
document regression Test, as well as ranking and
regression performance using the rAcc, vBLEU∆,
MAE, and TE metrics.
As the numbers for the ranking and regres-
sion metrics show, the same trends we observed
for English-Spanish hold for many other language
pairs as well. Some domains, such as HiTech, are
easier to rank regardless of the language pair, and
the quality gains are consistently high (+9.9 av-
erage vBLEU∆ for the 5 language pairs consid-
ered). Other domains, such as WMT09 and Travel,
are more difficult to rank. However, the WMT09
English-Hungarian data set appears to be better
suited for ranking, as the vBLEU∆ numbers are
higher compared to the rest of the language pairs
from this domain (+4.3 vBLEU∆ for Eng-Hun,
+7.1 vBLEU∆ for Hun-Eng). For Travel, English-
Dutch is also an outlier in terms of quality gains
(+12.9 vBLEU∆).
Overall, the results indicate that TrustRank ob-
tains consistent performance across a large vari-
ety of language pairs. Similar with the conclusion
for English-Spanish, the regression performance
is currently too poor to allow us to confidently
use the absolute document-level predicted BLEU
numbers as indicators of translation accuracy.
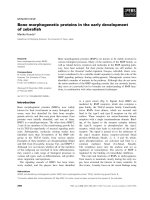
6 Examples and Illustrations
As the experimental results in Table 6 show, the
regression performance varies considerably across
domains. Even within the same domain, the nature
of the material used to perform the experiments
can influence considerably the results we obtain.
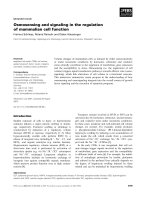
In Figure 1, we plot BLEU,predBLEU points for
three of our language pairs presented in Table 6:
Travel Eng-Fra, Travel Eng-Dut, and HiTech Eng-
Rus. These plots illustrate the tendency of the pre-
dicted BLEU values to correlate with the actual
BLEU scores. The amount of correlation visible in
these plots matches the performance numbers pro-
vided in Table 6, with Travel Eng-Fra at a lower
level of correlation compared to Travel Eng-Dut
and HiTech Eng-Rus. The BLEU,predBLEU points
tend to align along a line at an angle smaller than
45
◦
, an indication of the fact that the BLEU pre-
dictions tend to be more conservative compared
to the actual BLEU scores. For example, in the
Domain BLEU rAcc vBLEU∆[4] MAE TE
WMT09
Eng-Spa 41.0 35% +2.4 9.2 -0.3
Eng-Fra 37.1 37% +3.3 8.3 -0.5
Eng-Ger 23.7 32% +1.9 5.8 -0.7
Eng-Cze 10.3 38% +1.3 3.1 -0.6
Eng-Hun 14.5 55% +4.3 3.7 -1.1
Spa-Eng 40.1 37% +3.3 8.1 -0.2
Fra-Eng 37.9 39% +3.8 10.1 -0.6
Ger-Eng 29.4 36% +2.7 5.9 -0.9
Cze-Eng 19.7 40% +2.4 4.3 -0.6
Hun-Eng 24.0 61% +7.1 4.9 -1.8
Travel
Eng-Spa 31.2 36% +3.4 7.4 -1.9
Eng-Fra 27.8 39% +2.7 6.2 -0.9
Eng-Ita 22.5 39% +2.4 5.1 +0.0
Eng-Por 41.9 51% +5.6 8.6 +1.1
Eng-Ger 27.6 37% +5.7 11.8 -0.4
Eng-Dut 41.9 52% +12.9 12.9 -0.7
Electronics
Eng-Spa 65.2 51% +6.5 8.4 -2.6
Eng-Fra 55.8 49% +7.7 8.4 -2.3
Eng-Ger 42.1 57% +8.9 7.4 -1.6
Eng-Chi
63.9 48% +6.4 8.6 -0.8
Eng-Por 47.9 49% +6.9 9.0 -1.8
HiTech
Eng-Spa 59.0 59% +11.6 8.6 -2.1
Eng-Ger 36.6 62% +9.2 7.1 -1.0
Eng-Chi 60.3 54% +7.5 8.4 -1.0
Eng-Rus 39.2 62% +10.7 8.7 -2.1
Eng-Kor
49.4 61% +10.5 9.7 -3.2
Table 6: Performance of TrustRank on a variety of
domains and language pairs.
Travel Eng-Fra case, the predicted BLEU numbers
are spread across a narrower band (95% of the val-
ues are in the [19-35] interval), compared to the
actual BLEU scores (95% of the values are in the
[11-47] interval).
These intervals are also useful for gauging the
level of difficulty stemming from the nature of the
material used to perform the experiments. In the
case of Travel Eng-Fra, the actual BLEU scores
are clustered in a narrower band (interval [11-47]
covers 95% of the values), compared to the actual
BLEU scores for Travel Eng-Dut (interval [11-92]
covers 95% of the values) and HiTech Eng-Rus
(interval [3-80] covers 95% of the values). This
619
Figure 1: Examples of BLEU versus predBLEU.
means that the documents in the latter cases are
easier to distinguish, compared to the documents
in Travel Eng-Fra.
To provide an intuitive feel for the difference
between the level of translation performance be-
tween documents ranked close to the bottom and
documents ranked close to the top, we present
here two example translations. They are docu-
ments that we randomly picked from the bottom
10% and top 10% of the Travel Eng-Fra document
set, and they correspond to points A and B in the
first plot of Figure 1, respectively. The A-Fra and
B-Fra entries below are produced by our Eng-Fra
TrustRank-MT system, starting from A-Eng and
B-Eng
3
, respectively.
A-Eng This will be our 18th year,still love it. Same hotel,
room, staff, even other guests from other countries, its
lovely to see everyone that you have gotten to know
over the years, even if ,you or they ,do not speak each
others language. We love the Island some much that,
hopefuly, that is where we are retiring to, we do keep
looking for that affordable place.
A-Fra Ce sera notre 18
`
eme ann
´
ee, adore. M
ˆ
eme h
ˆ
otel,
3
We preserved the original writing style of the documents
in the source language.
la chambre, le personnel, m
ˆ
eme d’autres clients dans
d’autres pays, c’est tr
`
es agr
´
eable de voir que tout le
monde vous aurais savoir au cours de ces derni
`
eres
ann
´
ees, m
ˆ
eme si, ou bien ils vous, ne parlent pas
chaque d’autres langues. Nous adorons l’
ˆ
ıle des que,
hopefuly, c’est l’endroit o
`
u nous avons retiring, nous
ne pour chercher un endroit abordable.
B-Eng Stayed at the Intercontinental for 4 nights. It is in an
excellent location, not far from the French Quarter. The
rooms are large, clean, and comfortable. The staff is
friendly and helpful. Parking is very expensive, around
$29. 00 a day. There is a garage next door which is a
little more reasonable. I certainly suggest this hotel to
others.
B-Fra J’ai s
´
ejourn
´
e
`
a l’Intercontinental pour 4 nuits. Il est
tr
`
es bien situ
´
e, pas loin du Quartier Franc¸ais. Les
chambres sont grandes, propres et confortables. Le per-
sonnel est sympa et serviable. Le parking est tr
`
es cher,
autour de 29 $ par jour. Il y a un garage
`
a c
ˆ
ot
´
e, ce
qui est un peu plus raisonnable. Je conseille cet h
ˆ
otel
`
a
d’autres.
Document A-Fra is a poor translation, and is
ranked in the bottom 10%, while document B-Fra
is a nearly-perfect translation ranked in the top
10%, out of a total of 1000 documents.
7 Conclusions and Future Work
Commercial adoption of MT technology requires
trust in the translation quality. Rather than delay
this adoption until MT attains a near-human level
of sophistication, we propose an interim approach.
We present a mechanism that allows MT users
to trade quantity for quality, using automatically-
determined translation quality rankings.
The results we present in this paper show that
document-level translation quality rankings pro-
vide quantitatively strong gains in translation qual-
ity, as measured by BLEU. A difference of +18.9
BLEU, like the one we obtain for the English-
Spanish HiTech domain (Table 3), is persuasive
evidence for inspiring trust in the quality of se-
lected translations. This approach enables us to
develop TrustRank, a complete MT solution that
enhances automatic translation with the ability to
identify document subsets containing translations
that pass an acceptable quality threshold.
When measuring the performance of our solu-
tion across several domains, it becomes clear that
some domains allow for more accurate quality pre-
diction than others. Given the immediate benefit
that can be derived from increasing the ranking
accuracy for translation quality, we plan to open
up publicly available benchmark data that can be
used to stimulate and rigorously monitor progress
in this direction.
620
References
Joshua Albrecht and Rebecca Hwa. 2007. Regression
for sentence-level MT evaluation with pseudo refer-
ences. In Proceedings of ACL.
Joshua Albrecht and Rebecca Hwa. 2008. The role of
pseudo references in MT evaluation. In Proceedings
of ACL.
Enrique Amig
´
o, Jes
´
us Gim
´
enez, Julio Gonzalo, and Fe-
lisa Verdejo. 2009. The contribution of linguistic
features to automatic machine translation evaluation.
In Proceedings of ACL.
John Blatz, Erin Fitzgerald, GEorge Foster, Simona
Gandrabur, Cyril Gouette, Alex Kulesza, Alberto
Sanchis, and Nicola Ueffing. 2004. Confidence es-
timation for machine translation. In Proceedings of
COLING.
Michael Collins, Philipp Koehn, and Ivona Kucerova.
2005. Clause restructuring for statistical machine
translation. In Proceedings of ACL.
J. Dem
ˇ
sar. 2006. Statistical comparisons of classifiers
over multiple data sets. Journal of Machine Learn-
ing Research, 7.
George Doddington. 2002. Automatic evaluation of
machine translation quality using n-gram coocur-
rence statistics. In Proceedings of HLT.
Kevin Duh. 2008. Ranking vs. regression in machine
translation evaluation. In Proceedings of the ACL
Third Workshop on Statistical Machine Translation.
Michael Gamon, Anthony Aue, and Martine Smets.
2005. Sentence-level MT evaluation without refer-
ence translations: Beyond language modeling. In
Proceedings of EAMT.
Asela Gunawardana and Guy Shani. 2009. A sur-
vey of accuracy evaluation metrics of recommenda-
tion tasks. Journal of Machine Learning Research,
10:2935–2962.
David Kauchak and Regina Barzilay. 2006. Para-
phrasing for automatic evaluation. In Proceedings
of HLT/NAACL.
Philipp Koehn and Barry Haddow. 2009. Edinburgh’s
submission to all tracks of the WMT2009 shared
task with reordering and speed improvements to
Moses. In Proceedings of EACL Workshop on Sta-
tistical Machine Translation.
Alex Kulesza and Stuart M. Shieber. 2004. A learn-
ing approach to improving sentence-level MT evalu-
ation. In Proceedings of the 10th International Con-
ference on Theoretical and Methodological Issues in
Machine Translation.
A L. Lagarda, V. Alabau, F. Casacuberta, R. Silva, and
E. D
´
ıaz de Lia
˜
no. 2009. Statistical post-editing of a
rule-based machine translation system. In Proceed-
ings of HLT/NAACL.
A. Lavie and A. Agarwal. 2007. METEOR: An au-
toamtic metric for mt evaluation with high levels of
correlation with human judgments. In Proceedings
of ACL Workshop on Statistical Machine Transla-
tion.
Ding Liu and Daniel Gildea. 2005. Syntactic fea-
tures for evaluation of machine translations. In Pro-
ceedings of ACL Workshop on Intrinsic and Extrin-
sic Evaluation Measures for Machine Translation
and/or Summarization.
Franz Joseph Och and Hermann Ney. 2004. The align-
ment template approach to statistical machine trans-
lation. Computational Linguistics, 30(4):417–449.
Karolina Owczarzak, Josef Genabith, and Andy Way.
2007. Evaluating machine translation with LFG
dependencies. Machine Translation, 21(2):95–119,
June.
Kishore Papineni, Salim Roukos, Todd Ward, and Wei-
Jing Zhu. 2002. BLEU: a method for automatic
evaluation of machine translation. In Proceedings
of ACL.
Sujith Ravi, Kevin Knight, and Radu Soricut. 2008.
Automatic prediction of parsing accuracy. In Pro-
ceedings of EMNLP.
Lucia Specia, Nicola Cancedda, Marc Dymetman,
Marcho Turchi, and Nello Cristianini. 2009. Esti-
mating the sentence-level quality of machine trans-
lation. In Proceedings of EAMT.
Nicola Ueffing and Hermann Ney. 2005. Applica-
tion of word-level confidence measures in interac-
tive statistical machine translation. In Proceedings
of EAMT.
Peng Xu, Jaeho Kang, Michael Ringaard, and Franz
Och. 2009. Using a dependency parser to improve
SMT for Subject-Object-Verb languages. In Pro-
ceedings of ACL.
Muyun Yang, Shuqi Sun, Jufeng Li, Sheng Li, and
Zhao Tiejun. 2008. A linguistically motivated MT
evaluation system based on SVM regression. In
Proceedings of AMTA.
Yang Ye, Ming Zhou, and Chin-Yew Lin. 2007. Sen-
tence level machine translation evaluation as a rank-
ing. In Proceedings of the ACL Second Workshop on
Statistical Machine Translation.
Liang Zhou, Chin-Yew Lin, and Eduard Hovy. 2006.
Re-evaluating machine translation results with para-
phrase support. In Proceedings of EMNLP.
621