Báo cáo khoa học: "A Rational Model of Eye Movement Control in Reading" pdf
Bạn đang xem bản rút gọn của tài liệu. Xem và tải ngay bản đầy đủ của tài liệu tại đây (170.07 KB, 11 trang )
Proceedings of the 48th Annual Meeting of the Association for Computational Linguistics, pages 1168–1178,
Uppsala, Sweden, 11-16 July 2010.
c
2010 Association for Computational Linguistics
A Rational Model of Eye Movement Control in Reading
Klinton Bicknell and Roger Levy
Department of Linguistics
University of California, San Diego
9500 Gilman Dr, La Jolla, CA 92093-0108
{kbicknell,rlevy}@ling.ucsd.edu
Abstract
A number of results in the study of real-
time sentence comprehension have been
explained by computational models as re-
sulting from the rational use of probabilis-
tic linguistic information. Many times,
these hypotheses have been tested in read-
ing by linking predictions about relative
word difficulty to word-aggregated eye
tracking measures such as go-past time. In
this paper, we extend these results by ask-
ing to what extent reading is well-modeled
as rational behavior at a finer level of anal-
ysis, predicting not aggregate measures,
but the duration and location of each fix-
ation. We present a new rational model of
eye movement control in reading, the cen-
tral assumption of which is that eye move-
ment decisions are made to obtain noisy
visual information as the reader performs
Bayesian inference on the identities of the
words in the sentence. As a case study,
we present two simulations demonstrating
that the model gives a rational explanation
for between-word regressions.
1 Introduction
The language processing tasks of reading, listen-
ing, and even speaking are remarkably difficult.
Good performance at each one requires integrat-
ing a range of types of probabilistic information
and making incremental predictions on the ba-
sis of noisy, incomplete input. Despite these re-
quirements, empirical work has shown that hu-
mans perform very well (e.g., Tanenhaus, Spivey-
Knowlton, Eberhard, & Sedivy, 1995). Sophisti-
cated models have been developed that explain
many of these effects using the tools of com-
putational linguistics and large-scale corpora to
make normative predictions for optimal perfor-
mance in these tasks (Genzel & Charniak, 2002,
2003; Keller, 2004; Levy & Jaeger, 2007; Jaeger,
2010). To the extent that the behavior of these
models looks like human behavior, it suggests that
humans are making rational use of all the infor-
mation available to them in language processing.
In the domain of incremental language compre-
hension, especially, there is a substantial amount
of computational work suggesting that humans be-
have rationally (e.g., Jurafsky, 1996; Narayanan &
Jurafsky, 2001; Levy, 2008; Levy, Reali, & Grif-
fiths, 2009). Most of this work has taken as its
task predicting the difficulty of each word in a sen-
tence, a major result being that a large component
of the difficulty of a word appears to be a function
of its probability in context (Hale, 2001; Smith &
Levy, 2008). Much of the empirical basis for this
work comes from studying reading, where word
difficulty can be related to the amount of time
that a reader spends on a particular word. To re-
late these predictions about word difficulty to the
data obtained in eye tracking experiments, the eye
movement record has been summarized through
word aggregate measures, such as the average du-
ration of the first fixation on a word, or the amount
of time between when a word is first fixated and
when the eyes move to its right (‘go-past time’).
It is important to note that this notion of word
difficulty is an abstraction over the actual task of
reading, which is made up of more fine-grained
decisions about how long to leave the eyes in
their current position, and where to move them
next, producing the series of relatively stable pe-
riods (fixations) and movements (saccades) that
characterize the eye tracking record. While there
has been much empirical work on reading at
this fine-grained scale (see Rayner, 1998 for an
overview), and there are a number of successful
models (Reichle, Pollatsek, & Rayner, 2006; En-
gbert, Nuthmann, Richter, & Kliegl, 2005), little
is known about the extent to which human read-
ing behavior appears to be rational at this finer
1168
grained scale. In this paper, we present a new ratio-
nal model of eye movement control in reading, the
central assumption of which is that eye movement
decisions are made to obtain noisy visual informa-
tion, which the reader uses in Bayesian inference
about the form and structure of the sentence. As a
case study, we show that this model gives a ratio-
nal explanation for between-word regressions.
In Section 2, we briefly describe the leading
models of eye movements in reading, and in Sec-
tion 3, we describe how these models account for
between-word regressions and the intuition behind
our model’s account of them. Section 4 describes
the model and its implementation and Sections 5–
6 describe two simulations we performed with the
model comparing behavioral policies that make re-
gressions to those that do not. In Simulation 1, we
show that specific regressive policies outperform
specific non-regressive policies, and in Simulation
2, we use optimization to directly find optimal
policies for three performance measures. The re-
sults show that the regressive policies outperform
non-regressive policies across a wide range of per-
formance measures, demonstrating that our model
predicts that making between-word regressions is
a rational strategy for reading.
2 Models of eye movements in reading
The two most successful models of eye move-
ments in reading are E-Z Reader (Reichle, Pollat-
sek, Fisher, & Rayner, 1998; Reichle et al., 2006)
and SWIFT (Engbert, Longtin, & Kliegl, 2002;
Engbert et al., 2005). Both of these models charac-
terize the problem of reading as one of word iden-
tification. In E-Z Reader, for example, the system
identifies each word in the sentence serially, mov-
ing attention to the next word in the sentence only
after processing the current word is complete, and
(to slightly oversimplify), the eyes then follow the
attentional shifts at some lag. SWIFT works simi-
larly, but with the main difference being that pro-
cessing and attention are distributed over multiple
words, such that adjacent words can be identified
in parallel. While both of these models provide a
good fit to eye tracking data from reading, neither
model asks the higher level question of what a ra-
tional solution to the problem would look like.
The first model to ask this question, Mr. Chips
(Legge, Klitz, & Tjan, 1997; Legge, Hooven,
Klitz, Mansfield, & Tjan, 2002), predicts the op-
timal sequence of saccade targets to read a text
based on a principle of minimizing the expected
entropy in the distribution over identities of the
current word. Unfortunately, however, the Mr.
Chips model simplifies the problem of reading in
a number of ways: First, it uses a unigram model
as its language model, and thus fails to use any
information in the linguistic context to help with
word identification. Second, it only moves on to
the next word after unambiguous identification of
the current word, whereas there is experimental
evidence that comprehenders maintain some un-
certainty about the word identities. In other work,
we have extended the Mr. Chips model to remove
these two limitations, and show that the result-
ing model more closely matches human perfor-
mance (Bicknell & Levy, 2010). The larger prob-
lem, however, is that each of these models uses
an unrealistic model of visual input, which obtains
absolute knowledge of the characters in its visual
window. Thus, there is no reason for the model to
spend longer on one fixation than another, and the
model only makes predictions for where saccades
are targeted, and not how long fixations last.
Reichle and Laurent (2006) presented a rational
model that overcame the limitations of Mr. Chips
to produce predictions for both fixation durations
and locations, focusing on the ways in which eye
movement behavior is an adaptive response to the
particular constraints of the task of reading. Given
this focus, Reichle and Laurent used a very simple
word identification function, for which the time re-
quired to identify a word was a function only of its
length and the relative position of the eyes. In this
paper, we present another rational model of eye
movement control in reading that, like Reichle and
Laurent, makes predictions for fixation durations
and locations, but which focuses instead on the
dynamics of word identification at the core of the
task of reading. Specifically, our model identifies
the words in a sentence by performing Bayesian
inference combining noisy input from a realistic
visual model with a language model that takes
context into account.
3 Explaining between-word regressions
In this paper, we use our model to provide a
novel explanation for between-word regressive
saccades. In reading, about 10–15% of saccades
are regressive – movements from right-to-left (or
to previous lines). To understand how models
such as E-Z Reader or SWIFT account for re-
1169
gressive saccades to previous words, recall that
the system identifies words in the sentence (gen-
erally) left to right, and that identification of a
word in these models takes a certain amount of
time and then is completed. In such a setup, why
should the eyes ever move backwards? Three ma-
jor answers have been put forward. One possibil-
ity given by E-Z Reader is as a response to over-
shoot; i.e., the eyes move backwards to a previ-
ous word because they accidentally landed fur-
ther forward than intended due to motor error.
Such an explanation could only account for small
between-word regressions, of about the magni-
tude of motor error. The most recent version,
E-Z Reader 10 (Reichle, Warren, & McConnell,
2009), has a new component that can produce
longer between-word regressions. Specifically, the
model includes a flag for postlexical integration
failure, that – when triggered – will instruct the
model to produce a between-word regression to
the site of the failure. That is, between-word re-
gressions in E-Z Reader 10 can arise because of
postlexical processes external to the model’s main
task of word identification. A final explanation for
between-word regressions, which arises as a result
of normal processes of word identification, comes
from the SWIFT model. In the SWIFT model, the
reader can fail to identify a word but move past
it and continue reading. In these cases, there is
a chance that the eyes will at some point move
back to this unidentified word to identify it. From
the present perspective, however, it is unclear how
it could be rational to move past an unidentified
word and decide to revisit it only much later.
Here, we suggest a new explanation for
between-word regressions that arises as a result
of word identification processes (unlike that of
E-Z Reader) and can be understood as rational
(unlike that of SWIFT). Whereas in SWIFT and
E-Z Reader, word recognition is a process that
takes some amount of time and is then ‘com-
pleted’, some experimental evidence suggests that
word recognition may be best thought of as a
process that is never ‘completed’, as comprehen-
ders appear to both maintain uncertainty about the
identity of previous input and to update that uncer-
tainty as more information is gained about the rest
of the sentence (Connine, Blasko, & Hall, 1991;
Levy, Bicknell, Slattery, & Rayner, 2009). Thus, it
is possible that later parts of a sentence can cause
a reader’s confidence in the identity of the previ-
ous regions to fall. In these cases, a rational way to
respond might be to make a between-word regres-
sive saccade to get more visual information about
the (now) low confidence previous region.
To illustrate this idea, consider the case of a lan-
guage composed of just two strings, AB and BA,
and assume that the eyes can only get noisy in-
formation about the identity of one character at a
time. After obtaining a little information about the
identity of the first character, the reader may be
reasonably confident that its identity is A and move
on to obtaining visual input about the second char-
acter. If the first noisy input about the second char-
acter also indicates that it is probably A, then the
normative probability that the first character is A
(and thus a rational reader’s confidence in its iden-
tity) will fall. This simple example just illustrates
the point that if a reader is combining noisy vi-
sual information with a language model, then con-
fidence in previous regions will sometimes fall.
There are two ways that a rational agent might
deal with this problem. The first option would be
to reach a higher level of confidence in the iden-
tity of each word before moving on to the right,
i.e., slowing down reading left-to-right to prevent
having to make right-to-left regressions. The sec-
ond option is to read left-to-right relatively more
quickly, and then make occasional right-to-left re-
gressions in the cases where probability in pre-
vious regions falls. In this paper, we present two
simulations suggesting that when using a rational
model to read natural language, the best strate-
gies for coping with the problem of confidence
about previous regions dropping – for any trade-
off between speed and accuracy – involve making
between-word regressions. In the next section, we
present the details of our model of reading and its
implementation, and then we present our two sim-
ulations in the sections following.
4 Reading as Bayesian inference
At its core, the framework we are proposing is one
of reading as Bayesian inference. Specifically, the
model begins reading with a prior distribution over
possible identities of a sentence given by its lan-
guage model. On the basis of that distribution, the
model decides whether or not to move its eyes (and
if so where to move them to) and obtains noisy
visual input about the sentence at the eyes’ posi-
tion. That noisy visual input then gives the likeli-
hood term in a Bayesian belief update, where the
1170
model’s prior distribution over the identity of the
sentence given the language model is updated to a
posterior distribution taking into account both the
language model and the visual input obtained thus
far. On the basis of that new distribution, the model
again selects an action and the cycle repeats.
This framework is unique among models of eye
movement control in reading (except Mr. Chips)
in having a fully explicit model of how visual in-
put is used to discriminate word identity. This ap-
proach stands in sharp contrast to other models,
which treat the time course of word identifica-
tion as an exogenous function of other influenc-
ing factors (such as word length, frequency, and
predictability). The hope in our approach is that
the influence of these key factors on the eye move-
ment record will fall out as a natural consequence
of rational behavior itself. For example, it is well
known that the higher the conditional probabil-
ity of a word given preceding material, the more
rapidly that word is read (Boston, Hale, Kliegl,
Patil, & Vasishth, 2008; Demberg & Keller, 2008;
Ehrlich & Rayner, 1981; Smith & Levy, 2008).
E-Z Reader and SWIFT incorporate this finding by
specifying a dependency on word predictability in
the exogenous function determining word process-
ing time. In our framework, in contrast, we would
expect such an effect to emerge as a byproduct of
Bayesian inference: words with high prior proba-
bility (conditional on preceding fixations) will re-
quire less visual input to be reliably identified.
An implemented model in this framework must
formalize a number of pieces of the reading prob-
lem, including the possible actions available to the
reader and their consequences, the nature of vi-
sual input, a means of combining visual input with
prior expectations about sentence form and struc-
ture, and a control policy determining how the
model will choose actions on the basis of its poste-
rior distribution over the identities of the sentence.
In the remainder of this section, we present these
details of the formalization of the reading problem
we used for the simulations reported in this paper:
actions (4.1), visual input (4.2), formalization of
the Bayesian inference problem (4.3), control pol-
icy (4.4), and finally, implementation of the model
using weighted finite state automata (4.5).
4.1 Formal problem of reading: Actions
For our model, we assume a series of discrete
timesteps, and on each time step, the model first
obtains visual input around the current location
of the eyes, and then chooses between three ac-
tions: (a) continuing to fixate the currently fixated
position, (b) initiating a saccade to a new posi-
tion, or (c) stopping reading of the sentence. If
on the ith timestep, the model chooses option (a),
the timestep advances to i + 1 and another sam-
ple of visual input is obtained around the current
position. If the model chooses option (c), the read-
ing immediately ends. If a saccade is initiated (b),
there is a lag of two timesteps, roughly represent-
ing the time required to plan and execute a sac-
cade, during which the model again obtains visual
input around the current position and then the eyes
move – with some motor error – toward the in-
tended target t
i
, landing on position
i
. On the next
time step, visual input is obtained around
i
and
another decision is made. The motor error for sac-
cades follows the form of random error used by all
major models of eye movements in reading: the
landing position
i
is normally distributed around
the intended target t
i
with standard deviation given
by a linear function of the intended distance
1
i
∼ N
t
i
,(δ
0
+ δ
1
|t
i
−
i−1
|)
2
(1)
for some linear coefficients δ
0
and δ
1
. In the ex-
periments reported in this paper, we follow the
SWIFT model in using δ
0
= 0.87, δ
1
= 0.084.
4.2 Noisy visual input
As stated earlier, the role of noisy visual input in
our model is as the likelihood term in a Bayesian
inference about sentence form and identity. There-
fore, if we denote the input obtained thus far from
a sentence as I, all the information pertinent to
the reader’s inferences can be encapsulated in the
form p(I|w) for possible sentences w. We assume
that the inputs deriving from each character posi-
tion are conditionally independent given sentence
identity, so that if w
j
denotes letter j of the sen-
tence and I( j) denotes the component of visual
input associated with that letter, then we can de-
compose p(I|w) as
∏
j
p(I( j)|w
j
). For simplicity,
we assume that each character is either a lowercase
letter or a space. The visual input obtained from
an individual fixation can thus be summarized as
a vector of likelihoods p(I( j)|w
j
), as shown in
1
In the terminology of the literature, the model has only
random motor error (variance), not systematic error (bias).
Following Engbert and Krügel (2010), systematic error may
arise from Bayesian estimation of the best saccade distance.
1171
a s a c a
*
t s a t a t a t
a
c
.
.
.
s
t
.
.
.
0
0
.
.
.
0
0
.
.
.
1
0
0
.
.
.
0
0
.
.
.
1
0
0
.
.
.
0
0
.
.
.
1
0
0
.
.
.
0
0
.
.
.
1
0
0
.
.
.
0
0
.
.
.
1
0
0
.
.
.
0
0
.
.
.
1
0
0
.
.
.
0
0
.
.
.
1
.04
.04
.
.
.
.04
.04
.
.
.
0
.04
.04
.
.
.
.04
.04
.
.
.
0
.04
.04
.
.
.
.04
.04
.
.
.
0
.08
.02
.
.
.
.04
.03
.
.
.
0
.15
.07
.
.
.
.01
.01
.
.
.
0
.02
.25
.
.
.
.03
.01
.
.
.
0
.07
.01
.
.
.
.03
.003
.
.
.
0
.05
.01
.
.
.
.002
.05
.
.
.
0
.003
.005
.
.
.
.21
.02
.
.
.
0
.04
.01
.
.
.
.03
.07
.
.
.
0
.06
.01
.
.
.
.02
.12
.
.
.
0
.05
.05
.
.
.
.07
.05
.
.
.
0
.10
.08
.
.
.
.02
.05
.
.
.
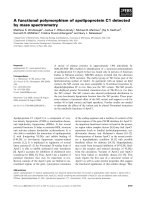
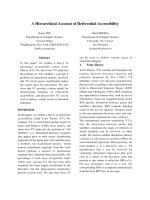
0
Figure 1: Peripheral and foveal visual input in the model. The asymmetric Gaussian curve indicates
declining perceptual acuity centered around the fixation point (marked by ∗). The vector underneath each
letter position denotes the likelihood p(I( j)|w
j
) for each possible letter w
j
, taken from a single input
sample with Λ = 1/
√
3 (see vector at the left edge of the figure for key, and Section 4.2). In peripheral
vision, the letter/whitespace distinction is veridical, but no information about letter identity is obtained.
Note in this particular sample, input from the fixated character and the following one is rather inaccurate.
Figure 1. As in the real visual system, our vi-
sual acuity function decreases with retinal eccen-
tricity; we follow the SWIFT model in assuming
that the spatial distribution of visual processing
rate follows an asymmetric Gaussian with σ
L
=
2.41,σ
R
= 3.74, which we discretize into process-
ing rates for each character position. If ε denotes a
character’s eccentricity in characters from the cen-
ter of fixation, then the proportion of the total pro-
cessing rate at that eccentricity λ (ε) is given by
integrating the asymmetric Gaussian over a char-
acter width centered on that position,
λ (ε) =
ε+.5
ε−.5
1
Z
exp
−
x
2
2σ
2
dx,σ =
σ
L
, x < 0
σ
R
, x ≥0
where the normalization constant Z is given by
Z =
π
2
(σ
L
+ σ
R
).
From this distribution, we derive two types of vi-
sual input, peripheral input giving word boundary
information and foveal input giving information
about letter identity.
4.2.1 Peripheral visual input
In our model, any eccentricity with a processing
rate proportion λ (ε) at least 0.5% of the rate pro-
portion for the centrally fixated character (ε ∈
[−7,12]), yields peripheral visual input, defined
as veridical word boundary information indicat-
ing whether each character is a letter or a space.
This roughly corresponds to empirical estimates
that humans obtain useful information in reading
from about 19 characters, more from the right of
fixation than the left (Rayner, 1998). Hence in Fig-
ure 1, for example, left-peripheral visual input can
be represented as veridical knowledge of the initial
whitespace (denoted ), and a uniform distribution
over the 26 letters of English for the letter a.
4.2.2 Foveal visual input
In addition, for those eccentricities with a process-
ing rate proportion λ (ε) that is at least 1% of the
total processing rate (ε ∈ [−5, 8]) the model re-
ceives foveal visual input, defined only for letters
2
to give noisy information about the letter’s iden-
tity. This threshold of 1% roughly corresponds to
estimates that readers get information useful for
letter identification from about 4 characters to the
left and 8 to the right of fixation (Rayner, 1998).
In our model, each letter is equally confusable
with all others, following Norris (2006, 2009),
but ignoring work on letter confusability (which
could be added to future model revisions; Engel,
Dougherty, & Jones, 1973; Geyer, 1977). Visual
information about each character is obtained by
sampling. Specifically, we represent each letter as
a 26-dimensional vector, where a single element
is 1 and the other 25 are zeros, and given this rep-
resentation, foveal input for a letter is given as a
sample from a 26-dimensional Gaussian with a
2
For white space, the model is already certain of the iden-
tity because of peripheral input.
1172
mean equal to the letter’s true identity and a di-
agonal covariance matrix Σ(ε) = λ (ε)
−1/2
I. It is
relatively straightforward to show that under these
conditions, if we take the processing rate to be the
expected change in log-odds of the true letter iden-
tity relative to any other that a single sample brings
about, then the rate equals λ(ε). We scale the over-
all processing rate by multiplying each rate by Λ.
For the experiments in this paper, we set Λ = 4.
For each fixation, we sample independently from
the appropriate distribution for each character po-
sition and then compute the likelihood given each
possible letter, as illustrated in the non-peripheral
region of Figure 1.
4.3 Inference about sentence identity
Given the visual input and a language model, in-
ferences about the identity of the sentence w can
be made by standard Bayesian inference, where
the prior is given by the language model and the
likelihood is a function of the total visual input ob-
tained from the first to the ith timestep I
i
1
,
p(w|I
i
1
) =
p(w)p(I
i
1
|w)
∑
w
(w
)p(I
i
1
|w
)
. (2)
If we let I( j) denote the input received about char-
acter position j and let w
j
denote the jth character
in sentence identity w, then the likelihood can be
broken down by character position as
p(I
i
1
|w) =
n
∏
j=1
p(I
i
1
( j)|w
j
)
where n is the final character about which there is
any visual input. Similarly, we can decompose this
into the product of the likelihoods of each sample
p(I
i
1
|w) =
n
∏
j=1
i
∏
t=1
p(I
t
( j)|w
j
). (3)
If the eccentricity of the jth character on the tth
timestep ε
j
t
is outside of foveal input or the char-
acter is a space, the inner term is 0 or 1. If the sam-
ple was from a letter in foveal input ε
j
t
∈[−5,8], it
is the probability of sampling I
t
( j) from the mul-
tivariate Gaussian N(w
j
,ΛΣ(ε
j
t
)).
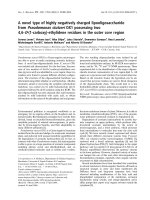
4.4 Control policy
The model uses a simple policy to decide between
actions based on the marginal probability m of the
(a) m = [.6,.7,.6,.4,.3,.6]: Keep fixating (3)
(b) m = [.6,.4,.9,.4,.3,.6]: Move back (to 2)
(c) m = [.6,.7,.9,.4,.3,.6]: Move forward (to 6)
(d) m = [.6,.7,.9,.8,.7,.7]: Stop reading
Figure 2: Values of m for a 6 character sentence
under which a model fixating position 3 would
take each of its four actions, if α = .7 and β = .5.
most likely character c in position j,
m( j) = max
c
p(w
n
= c|I
i
1
)
= max
c
∑
w
:w
n
=c
p(w
|I
i
1
). (4)
Intuitively, a high value of m means that the model
is relatively confident about the character’s iden-
tity, and a low value that it is relatively uncertain.
Given the values of this statistic, our model de-
cides between four possible actions, as illustrated
in Figure 2. If the value of this statistic for the cur-
rent position of the eyes m(
i
) is less than a pa-
rameter α, the model chooses to continue fixating
the current position (2a). Otherwise, if the value
of m( j) is less than β for some leftward position
j <
i
, the model initiates a saccade to the closest
such position (2b). If m( j) ≥β for all j <
i
, then
the model initiates a saccade to n characters past
the closest position to the right j >
i
for which
m( j) < α (2c).
3
Finally, if no such positions exist
to the right, the model stops reading the sentence
(2d). Intuitively, then, the model reads by making
a rightward sweep to bring its confidence in each
character up to α, but pauses to move left if confi-
dence in a previous character falls below β .
4.5 Implementation with wFSAs
This model can be efficiently and simply im-
plemented using weighted finite-state automata
(wFSAs; Mohri, 1997) as follows: First, we be-
gin with a wFSA representation of the language
model, where each arc emits a single character (or
is an epsilon-transition emitting nothing). To per-
form belief update given a new visual input, we
create a new wFSA to represent the likelihood of
each character from the sample. Specifically, this
wFSA has only a single chain of states, where,
e.g., the first and second state in the chain are con-
nected by 27 (or fewer) arcs, which emit each of
3
The role of n is to ensure that the model does not cen-
ter its visual field on the first uncertain character. We did not
attempt to optimize this parameter, but fixed n at 2.
1173
the possible characters for w
1
along with their re-
spective likelihoods given the visual input (as in
the inner term of Equation 3). Next, these two
wFSAs may simply be composed and then nor-
malized, which completes the belief update, re-
sulting in a new wFSA giving the posterior dis-
tribution over sentences. To calculate the statistic
m, while it is possible to calculate it in closed form
from such a wFSA relatively straightforwardly, for
efficiency we use Monte Carlo estimation based
on samples from the wFSA.
5 Simulation 1
With the description of our model in place, we
next proceed to describe the first simulation in
which we used the model to test the hypothesis
that making regressions is a rational way to cope
with confidence in previous regions falling. Be-
cause there is in general no single rational trade-
off between speed and accuracy, our hypothesis
is that, for any given level of speed and accu-
racy achieved by a non-regressive policy, there is a
faster and more accurate policy that makes a faster
left-to-right pass but occasionally does make re-
gressions. In the terms of our model’s policy pa-
rameters α and β described above, non-regressive
policies are exactly those with β = 0, and a pol-
icy that is faster on the left-to-right pass but does
make regressions is one with a lower value of α
but a non-zero β. Thus, we tested the performance
of our model on the reading of a corpus of text typ-
ical of that used in reading experiments at a range
of reasonable non-regressive policies, as well as a
set of regressive policies with lower α and posi-
tive β . Our prediction is that the former set will
be strictly dominated in terms of both speed and
accuracy by the latter.
5.1 Methods
5.1.1 Policy parameters
We test 4 non-regressive policies (i.e., those with
β = 0) with values of α ∈ {.90,.95,.97,.99}, and
in addition, test regressive policies with a lower
range of α ∈{.85,.90,.95,.97} and β ∈ {.4, .7}.
4
5.1.2 Language model
Our reader’s language model was an unsmoothed
bigram model created using a vocabulary set con-
4
We tested all combinations of these values of α and β
except for [α,β ] = [.97,.4], because we did not believe that
a value of β so low in relation to α would be very different
from a non-regressive policy.
sisting of the 500 most frequent words in the
British National Corpus (BNC) as well as all the
words in our test corpus. From this vocabulary, we
constructed a bigram model using the counts from
every bigram in the BNC for which both words
were in vocabulary (about 222,000 bigrams).
5.1.3 wFSA implementation
We implemented our model with wFSAs using
the OpenFST library (Allauzen, Riley, Schalk-
wyk, Skut, & Mohri, 2007). Specifically, we
constructed the model’s initial belief state (i.e.,
the distribution over sentences given by its lan-
guage model) by directly translating the bigram
model into a wFSA in the log semiring. We
then composed this wFSA with a weighted finite-
state transducer (wFST) breaking words down
into characters. This was done in order to facili-
tate simple composition with the visual likelihood
wFSA defined over characters. In the Monte Carlo
estimation of m, we used 5000 samples from the
wFSA. Finally, to speed performance, we bounded
the wFSA to have exactly the number of char-
acters present in the actual sentence and then re-
normalized.
5.1.4 Test corpus
We tested our model’s performance by simulating
reading of the Schilling corpus (Schilling, Rayner,
& Chumbley, 1998). To ensure that our results
did not depend on smoothing, we only tested the
model on sentences in which every bigram oc-
curred in the BNC. Unfortunately, only 8 of the 48
sentences in the corpus met this criterion. Thus,
we made single-word changes to 25 more of the
sentences (mostly changing proper names and rare
nouns) to produce a total of 33 sentences to read,
for which every bigram did occur in the BNC.
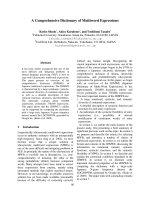
5.2 Results and discussion
For each policy we tested, we measured the aver-
age number of timesteps it took to read the sen-
tences, as well as the average (natural) log prob-
ability of the correct sentence identity under the
model’s beliefs after reading ended ‘Accuracy’.
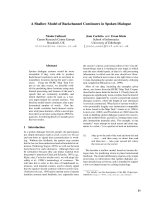
The results are plotted in Figure 3. As shown in
the graph, for each non-regressive policy (the cir-
cles), there is a regressive policy that outperforms
it, both in terms of average number of timesteps
taken to read (further to the left) and the average
log probability of the sentence identity (higher).
Thus, for a range of policies, these results suggest
1174
Timesteps
Accuracy
−1.2
−1.0
−0.8
−0.6
●
●
●
●
50 55 60 65 70
Beta
●
non−regressive (beta=0)
regressive (beta=0.4)
regressive (beta=0.7)
Figure 3: Mean number of timesteps taken to read
a sentence and (natural) log probability of the true
identity of the sentence ‘Accuracy’ for a range of
values of α and β. Values of α are not labeled,
but increase with the number of timesteps for a
constant value of β. For each non-regressive pol-
icy (β = 0), there is a policy with a lower α and
higher β that achieves better accuracy in less time.
that making regressions when confidence about
previous regions falls is a rational reader strategy,
in that it appears to lead to better performance,
both in terms of speed and accuracy.
6 Simulation 2
In Simulation 2, we perform a more direct test of
the idea that making regressions is a rational re-
sponse to the problem of confidence falling about
previous regions using optimization techniques.
Specifically, we search for optimal policy param-
eter values (α,β) for three different measures of
performance, each representing a different trade-
off between the importance of accuracy and speed.
6.1 Methods
6.1.1 Performance measures
We examine performance measures interpolating
between speed and accuracy of the form
L(1 −γ)−T γ (5)
where L is the log probability of the true identity
of the sentence under the model’s beliefs at the end
of reading, and T is the total number of timesteps
before the model decided to stop reading. Thus,
each different performance measure is determined
by the weighting for time γ. We test three values of
γ ∈ {.025,.1,.4}. The first of these weights accu-
racy highly, while the final one weights 1 timestep
almost as much as 1 unit of log probability.
6.1.2 Optimization of policy parameters
Searching directly for optimal values of α and β
for our stochastic reading model is difficult be-
cause each evaluation of the model with a partic-
ular set of parameters produces a different result.
We use the PEGASUS method (Ng & Jordan, 2000)
to transform this stochastic optimization problem
into a deterministic one on which we can use stan-
dard optimization algorithms.
5
Then, we evaluate
the model’s performance at each value of α and β
by reading the full test corpus and averaging per-
formance. We then simply use coordinate ascent
(in logit space) to find the optimal values of α and
β for each performance measure.
6.1.3 Language model
The language model used in this simulation be-
gins with the same vocabulary set as in Sim. 1,
i.e., the 500 most frequent words in the BNC and
every word that occurs in our test corpus. Because
the search algorithm demands that we evaluate the
performance of our model at a number of param-
eter values, however, it is too slow to optimize α
and β using the full language model that we used
for Sim. 1. Instead, we begin with the same set of
bigrams used in Sim. 1 – i.e., those that contain
two in-vocabulary words – and trim this set by re-
moving rare bigrams that occur less than 200 times
in the BNC (except that we do not trim any bi-
grams that occur in our test corpus). This reduces
our set of bigrams to about 19,000.
6.1.4 wFSA implementation
The implementation was the same as in Sim. 1.
6.1.5 Test corpus
The test corpus was the same as in Sim. 1.
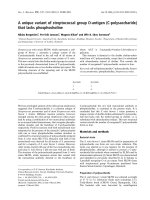
6.2 Results and discussion
The optimal values of α and β for each γ ∈
{.025,.1,.4} are given in Table 1 along with the
mean values for L and T found at those parameter
values. As the table shows, the optimization proce-
dure successfully found values of α and β , which
go up (slower reading) as γ goes down (valuing
accuracy more than time). In addition, we see that
the average results of reading at these parameter
values are also as we would expect, with T and L
going up as γ goes down. As predicted, the optimal
5
Specifically, this involves fixing the random number gen-
erator for each run to produce the same values, resulting in
minimizing the variance in performance across evaluations.
1175
γ α β Timesteps Log probability
.025 .90 .99 41.2 -0.02
.1 .36 .80 25.8 -0.90
.4 .18 .38 16.4 -4.59
Table 1: Optimal values of α and β found for each
performance measure γ tested and mean perfor-
mance at those values, measured in timesteps T
and (natural) log probability L.
values of β found are non-zero across the range of
policies, which include policies that value speed
over accuracy much more than in Sim. 1. This
provides more evidence that whatever the partic-
ular performance measure used, policies making
regressive saccades when confidence in previous
regions falls perform better than those that do not.
There is one interesting difference between the
results of this simulation and those of Sim. 1,
which is that here, the optimal policies all have a
value of β > α. That may at first seem surprising,
since the model’s policy is to fixate a region un-
til its confidence becomes greater than α and then
return if it falls below β . It would seem, then, that
the only reasonable values of β are those that are
strictly below α. In fact, this is not the case be-
cause of the two time step delay between the de-
cision to move the eyes and the execution of that
saccade. Because of this delay, the model’s confi-
dence when it leaves a region (relevant to β) will
generally be higher than when it decided to leave
(determined by α). In Simulation 2, because of the
smaller grammar that was used, the model’s confi-
dence in a region’s identity rises more quickly and
this difference is exaggerated.
7 Conclusion
In this paper, we presented a model that performs
Bayesian inference on the identity of a sentence,
combining a language model with noisy informa-
tion about letter identities from a realistic visual
input model. On the basis of these inferences, it
uses a simple policy to determine how long to
continue fixating the current position and where
to fixate next, on the basis of information about
where the model is uncertain about the sentence’s
identity. As such, it constitutes a rational model
of eye movement control in reading, extending the
insights from previous results about rationality in
language comprehension.
The results of two simulations using this model
support a novel explanation for between-word re-
gressive saccades in reading: that they are used to
gather visual input about previous regions when
confidence about them falls. Simulation 1 showed
that a range of policies making regressions in these
cases outperforms a range of non-regressive poli-
cies. In Simulation 2, we directly searched for op-
timal values for the policy parameters for three dif-
ferent performance measures, representing differ-
ent speed-accuracy trade-offs, and found that the
optimal policies in each case make substantial use
of between-word regressions when confidence in
previous regions falls. In addition to supporting
a novel motivation for between-word regressions,
these simulations demonstrate the possibility for
testing a range of questions that were impossi-
ble with previous models of reading related to the
goals of a reader, such as how should reading be-
havior change as accuracy is valued more.
There are a number of obvious ways for the
model to move forward. One natural next step is
to make the model more realistic by using letter
confusability matrices. In addition, the link to pre-
vious work in sentence processing can be made
tighter by incorporating syntax-based language
models. It also remains to compare this model’s
predictions to human data more broadly on stan-
dard benchmark measures for models of read-
ing. The most important future development, how-
ever, will be moving toward richer policy families,
which enable more intelligent decisions about eye
movement control, based not just on simple confi-
dence statistics calculated independently for each
character position, but rather which utilize the rich
structure of the model’s posterior beliefs about the
sentence identity (and of language itself) to make
more informed decisions about the best time to
move the eyes and the best location to direct them
next.
Acknowledgments
The authors thank Jeff Elman, Tom Griffiths,
Andy Kehler, Keith Rayner, and Angela Yu for
useful discussion about this work. This work bene-
fited from feedback from the audiences at the 2010
LSA and CUNY conferences. The research was
partially supported by NIH Training Grant T32-
DC000041 from the Center for Research in Lan-
guage at UC San Diego to K.B., by a research
grant from the UC San Diego Academic Senate
to R.L., and by NSF grant 0953870 to R.L.
1176
References
Allauzen, C., Riley, M., Schalkwyk, J., Skut, W.,
& Mohri, M. (2007). OpenFst: A general and
efficient weighted finite-state transducer library.
In Proceedings of the Ninth International Con-
ference on Implementation and Application of
Automata, (CIAA 2007) (Vol. 4783, p. 11-23).
Springer.
Bicknell, K., & Levy, R. (2010). Rational eye
movements in reading combining uncertainty
about previous words with contextual probabil-
ity. In Proceedings of the 32nd Annual Confer-
ence of the Cognitive Science Society. Austin,
TX: Cognitive Science Society.
Boston, M. F., Hale, J. T., Kliegl, R., Patil, U., &
Vasishth, S. (2008). Parsing costs as predic-
tors of reading difficulty: An evaluation using
the potsdam sentence corpus. Journal of Eye
Movement Research, 2(1), 1–12.
Connine, C. M., Blasko, D. G., & Hall, M. (1991).
Effects of subsequent sentence context in audi-
tory word recognition: Temporal and linguistic
constraints. Journal of Memory and Language,
30, 234–250.
Demberg, V., & Keller, F. (2008). Data from eye-
tracking corpora as evidence for theories of syn-
tactic processing complexity. Cognition, 109,
193–210.
Ehrlich, S. F., & Rayner, K. (1981). Contextual
effects on word perception and eye movements
during reading. Journal of Verbal Learning and
Verbal Behavior, 20, 641–655.
Engbert, R., & Krügel, A. (2010). Readers use
Bayesian estimation for eye movement control.
Psychological Science, 21, 366–371.
Engbert, R., Longtin, A., & Kliegl, R. (2002). A
dynamical model of saccade generation in read-
ing based on spatially distributed lexical pro-
cessing. Vision Research, 42, 621–636.
Engbert, R., Nuthmann, A., Richter, E. M., &
Kliegl, R. (2005). SWIFT: A dynamical model
of saccade generation during reading. Psycho-
logical Review, 112, 777–813.
Engel, G. R., Dougherty, W. G., & Jones, B. G.
(1973). Correlation and letter recognition.
Canadian Journal of Psychology, 27, 317–326.
Genzel, D., & Charniak, E. (2002, July). Entropy
rate constancy in text. In Proceedings of the 40th
annual meeting of the Association for Computa-
tional Linguistics (pp. 199–206). Philadelphia:
Association for Computational Linguistics.
Genzel, D., & Charniak, E. (2003). Variation of
entropy and parse trees of sentences as a func-
tion of the sentence number. In M. Collins &
M. Steedman (Eds.), Proceedings of the 2003
Conference on Empirical Methods in Natural
Language Processing (pp. 65–72). Sapporo,
Japan: Association for Computational Linguis-
tics.
Geyer, L. H. (1977). Recognition and confusion
of the lowercase alphabet. Perception & Psy-
chophysics, 22, 487–490.
Hale, J. (2001). A probabilistic Earley parser as
a psycholinguistic model. In Proceedings of the
Second Meeting of the North American Chapter
of the Association for Computational Linguistics
(Vol. 2, pp. 159–166). New Brunswick, NJ: As-
sociation for Computational Linguistics.
Jaeger, T. F. (2010). Redundancy and re-
duction: Speakers manage syntactic in-
formation density. Cognitive Psychology.
doi:10.1016/j.cogpsych.2010.02.002.
Jurafsky, D. (1996). A probabilistic model of
lexical and syntactic access and disambiguation.
Cognitive Science, 20, 137–194.
Keller, F. (2004). The entropy rate principle as
a predictor of processing effort: An evaluation
against eye-tracking data. In D. Lin & D. Wu
(Eds.), Proceedings of the 2004 Conference on
Empirical Methods in Natural Language Pro-
cessing (pp. 317–324). Barcelona, Spain: As-
sociation for Computational Linguistics.
Legge, G. E., Hooven, T. A., Klitz, T. S., Mans-
field, J. S., & Tjan, B. S. (2002). Mr.
Chips 2002: new insights from an ideal-observer
model of reading. Vision Research, 42, 2219–
2234.
Legge, G. E., Klitz, T. S., & Tjan, B. S. (1997).
Mr. Chips: an Ideal-Observer model of reading.
Psychological Review, 104, 524–553.
Levy, R. (2008). A noisy-channel model of ra-
tional human sentence comprehension under un-
certain input. In Proceedings of the 2008 Con-
ference on Empirical Methods in Natural Lan-
guage Processing (pp. 234–243). Honolulu,
Hawaii: Association for Computational Linguis-
tics.
Levy, R., Bicknell, K., Slattery, T., & Rayner,
K. (2009). Eye movement evidence that read-
ers maintain and act on uncertainty about past
linguistic input. Proceedings of the National
Academy of Sciences, 106, 21086–21090.
1177
Levy, R., & Jaeger, T. F. (2007). Speakers op-
timize information density through syntactic re-
duction. In B. Schölkopf, J. Platt, & T. Hoffman
(Eds.), Advances in Neural Information Pro-
cessing Systems 19 (pp. 849–856). Cambridge,
MA: MIT Press.
Levy, R., Reali, F., & Griffiths, T. L. (2009).
Modeling the effects of memory on human on-
line sentence processing with particle filters. In
D. Koller, D. Schuurmans, Y. Bengio, & L. Bot-
tou (Eds.), Advances in Neural Information Pro-
cessing Systems 21 (pp. 937–944).
Mohri, M. (1997). Finite-state transducers in lan-
guage and speech processing. Computational
Linguistics, 23, 269–311.
Narayanan, S., & Jurafsky, D. (2001). A Bayesian
model predicts human parse preference and
reading time in sentence processing. In T. Diet-
terich, S. Becker, & Z. Ghahramani (Eds.), Ad-
vances in Neural Information Processing Sys-
tems 14 (pp. 59–65). Cambridge, MA: MIT
Press.
Ng, A. Y., & Jordan, M. (2000). PEGASUS:
A policy search method for large MDPs and
POMDPs. In Uncertainty in Artificial Intelli-
gence, Proceedings of the Sixteenth Conference
(pp. 406–415).
Norris, D. (2006). The Bayesian reader: Explain-
ing word recognition as an optimal Bayesian de-
cision process. Psychological Review, 113, 327–
357.
Norris, D. (2009). Putting it all together: A unified
account of word recognition and reaction-time
distributions. Psychological Review, 116, 207–
219.
Rayner, K. (1998). Eye movements in reading and
information processing: 20 years of research.
Psychological Bulletin, 124, 372–422.
Reichle, E. D., & Laurent, P. A. (2006). Using
reinforcement learning to understand the emer-
gence of “intelligent” eye-movement behavior
during reading. Psychological Review, 113,
390–408.
Reichle, E. D., Pollatsek, A., Fisher, D. L., &
Rayner, K. (1998). Toward a model of eye
movement control in reading. Psychological Re-
view, 105, 125–157.
Reichle, E. D., Pollatsek, A., & Rayner, K.
(2006). E-Z Reader: A cognitive-control, serial-
attention model of eye-movement behavior dur-
ing reading. Cognitive Systems Research, 7, 4–
22.
Reichle, E. D., Warren, T., & McConnell, K.
(2009). Using E-Z Reader to model the ef-
fects of higher level language processing on eye
movements during reading. Psychonomic Bul-
letin & Review, 16, 1–21.
Schilling, H. E. H., Rayner, K., & Chumbley, J. I.
(1998). Comparing naming, lexical decision,
and eye fixation times: Word frequency effects
and individual differences. Memory & Cogni-
tion, 26, 1270–1281.
Smith, N. J., & Levy, R. (2008). Optimal process-
ing times in reading: a formal model and empir-
ical investigation. In B. C. Love, K. McRae, &
V. M. Sloutsky (Eds.), Proceedings of the 30th
Annual Conference of the Cognitive Science So-
ciety (pp. 595–600). Austin, TX: Cognitive Sci-
ence Society.
Tanenhaus, M. K., Spivey-Knowlton, M. J., Eber-
hard, K. M., & Sedivy, J. C. (1995). Integration
of visual and linguistic information in spoken
language comprehension. Science, 268, 1632–
1634.
1178