Who Pays? A Distributional Analysis of the Tax Systems in All 50 States docx
Bạn đang xem bản rút gọn của tài liệu. Xem và tải ngay bản đầy đủ của tài liệu tại đây (7.12 MB, 135 trang )
Who Pays?
Institute on Taxation & Economic Policy
A Distributional Analysis of the
Tax Systems in All 50 States
January 2013
Fourth Edition
About The Institute on Taxation & Economic Policy
e Institute on Taxation and Economic Policy (ITEP) is a non-prot, non-partisan research organization
that works on federal, state, and local tax policy issues. ITEP’s mission is to ensure that elected ocials, the
media, and the general public have access to accurate, timely, and straightforward information that allows
them to understand the eects of current and proposed tax policies. ITEP’s work focuses particularly on
issues of tax fairness and sustainability.
Acknowledgments
is study was made possible by grants from the Annie E. Casey Foundation, the Ford Foundation, the
Popplestone Foundation, the Stephen M. Silberstein Foundation, the Stoneman Family Foundation, and
other anonymous donors.
ITEP extends special thanks to scal policy analysts at nonprot organizations in the State Fiscal Analysis
Initiative, in the Economic Analysis Research Network, and across the country for their assistance in evaluat-
ing each state’s tax system, as well as the many state revenue department employees and legislative scal
analysts who patiently helped us to beer understand each of their state’s tax systems.
ITEP sta members Ed Meyers, Anne Singer, Steve Wamho, and Rebecca Wilkins also played important
roles in the study’s publication.
THE INSTITUTE ON TAXATION & ECONOMIC POLICY
1616 P Street, NW Suite 200 Washington, DC 20036
Tel: 202.299.1066 Fax: 202.299.1065 www.itep.org
Copyright © 2013 by The Institute on Taxation and Economic Policy
Who Pays?
A Distributional Analysis of the Tax Systems in
All 50 States
4th Edition
January 2013
Carl Davis
Kelly Davis
Matthew Gardner
Harley Heimovitz
Robert S. McIntyre
Richard Phillips
Alla Sapozhnikova
Meg Wiehe
MAIN REPORT
Kentucky . . . . . . . . . . . . . . . . . . . . . . . . . . . . . . . . .
59
Executive Summary . . . . . . . . . . . . . . . . . . . . . . . 1
Louisiana . . . . . . . . . . . . . . . . . . . . . . . . . . . . . . . . .
61
Introduction . . . . . . . . . . . . . . . . . . . . . . . . . . . . 2
Maine . . . . . . . . . . . . . . . . . . . . . . . . . . . . . . . . .
63
The 10 Most Regressive State & Local Tax Systems . . . . 4
Maryland . . . . . . . . . . . . . . . . . . . . . . . . . . . . . . . . .
65
The Least Regressive State & Local Tax Systems . . . . . . 5
Massachusetts . . . . . . . . . . . . . . . . . . . . . . . . . . . . . . . . .
67
The Kind of Tax Matters . . . . . . . . . . . . . . . . . . . . . 6
Michigan . . . . . . . . . . . . . . . . . . . . . . . . . . . . . . . . .
69
Income Taxes . . . . . . . . . . . . . . . . . . . . . . . . . . . 8
Minnesota . . . . . . . . . . . . . . . . . . . . . . . . . . . . . . . . .
71
Sales & Excise Taxes . . . . . . . . . . . . . . . . . . . . . . . . 12
Mississippi . . . . . . . . . . . . . . . . . . . . . . . . . . . . . . . . .
73
Property Taxes . . . . . . . . . . . . . . . . . . . . . . . . . . . 13
Missouri . . . . . . . . . . . . . . . . . . . . . . . . . . . . . . . . .
75
Low Taxes or Just Regressive Taxes? . . . . . . . . . . . . . 15
Montana . . . . . . . . . . . . . . . . . . . . . . . . . . . . . . . . .
77
How Have Recent Tax Changes Affected Tax Fairness? . . 16
Nebraska . . . . . . . . . . . . . . . . . . . . . . . . . . . . . . . . .
79
Conclusion . . . . . . . . . . . . . . . . . . . . . . . . . . . . 18
Nevada . . . . . . . . . . . . . . . . . . . . . . . . . . . . . . . . .
81
New Hampshire . . . . . . . . . . . . . . . . . . . . . . . . . . . . . . . . .
83
APPENDICES
New Jersey . . . . . . . . . . . . . . . . . . . . . . . . . . . . . . . . .
85
Appendix A: Who Pays Summary State-by-State Results . . 19
New Mexico . . . . . . . . . . . . . . . . . . . . . . . . . . . . . . . . .
87
Appendix B: Changes in Total Own-Source Revenue by
New York . . . . . . . . . . . . . . . . . . . . . . . . . . . . . . . . .
89
State, 2000-2010 . . . . . . . . . . . . . . . . . . . . . . . . . . . . . . . . .
21
North Carolina . . . . . . . . . . . . . . . . . . . . . . . . . . . . . . . . .
91
North Dakota . . . . . . . . . . . . . . . . . . . . . . . . . . . . . . . . .
93
DETAILED STATE-BY-STATE TABLES
Ohio . . . . . . . . . . . . . . . . . . . . . . . . . . . . . . . . .
95
A Roadmap to State-by-State Tables . . . . . . . . . . . . . . . . . . . . .
24
Oklahoma . . . . . . . . . . . . . . . . . . . . . . . . . . . . . . . . .
97
Alabama . . . . . . . . . . . . . . . . . . . . . . . . . . . . . . . . . 25
Oregon . . . . . . . . . . . . . . . . . . . . . . . . . . . . . . . . .
99
Alaska . . . . . . . . . . . . . . . . . . . . . . . . . . . . . . . . . 27
Pennsylvania . . . . . . . . . . . . . . . . . . . . . . . . . . . . . . . . .
101
Arizona . . . . . . . . . . . . . . . . . . . . . . . . . . . . . . . . . 29
Rhode Island . . . . . . . . . . . . . . . . . . . . . . . . . . . . . . . . .
103
Arkansas . . . . . . . . . . . . . . . . . . . . . . . . . . . . . . . . . 31
South Carolina . . . . . . . . . . . . . . . . . . . . . . . . . . . . . . . . .
105
California . . . . . . . . . . . . . . . . . . . . . . . . . . . . . . . . .
33
South Dakota . . . . . . . . . . . . . . . . . . . . . . . . . . . . . . . . .
107
Colorado . . . . . . . . . . . . . . . . . . . . . . . . . . . . . . . . . 35
Tennessee . . . . . . . . . . . . . . . . . . . . . . . . . . . . . . . . .
109
Connecticut . . . . . . . . . . . . . . . . . . . . . . . . . . . . . . . . .
37
Texas . . . . . . . . . . . . . . . . . . . . . . . . . . . . . . . . .
111
Delaware . . . . . . . . . . . . . . . . . . . . . . . . . . . . . . . . . 39
Utah . . . . . . . . . . . . . . . . . . . . . . . . . . . . . . . . .
113
District of Columbia . . . . . . . . . . . . . . . . . . . . . . . . . . . . . . . . .
41
Vermont . . . . . . . . . . . . . . . . . . . . . . . . . . . . . . . . .
115
Florida . . . . . . . . . . . . . . . . . . . . . . . . . . . . . . . . . 43
Virginia . . . . . . . . . . . . . . . . . . . . . . . . . . . . . . . . .
117
Georgia . . . . . . . . . . . . . . . . . . . . . . . . . . . . . . . . . 45
Washington . . . . . . . . . . . . . . . . . . . . . . . . . . . . . . . . .
119
Hawaii . . . . . . . . . . . . . . . . . . . . . . . . . . . . . . . . . 47
West Virginia . . . . . . . . . . . . . . . . . . . . . . . . . . . . . . . . .
121
Idaho . . . . . . . . . . . . . . . . . . . . . . . . . . . . . . . . . 49
Wisconsin . . . . . . . . . . . . . . . . . . . . . . . . . . . . . . . . .
123
Illinois . . . . . . . . . . . . . . . . . . . . . . . . . . . . . . . . . 51
Wyoming . . . . . . . . . . . . . . . . . . . . . . . . . . . . . . . . .
125
Indiana . . . . . . . . . . . . . . . . . . . . . . . . . . . . . . . . . 53
US Averages . . . . . . . . . . . . . . . . . . . . . . . . . . . . . . . . .
127
Iowa . . . . . . . . . . . . . . . . . . . . . . . . . . . . . . . . . 55
Kansas . . . . . . . . . . . . . . . . . . . . . . . . . . . . . . . . . 57
METHODOLOGY
129
TABLE OF CONTENTS
Institute on Taxation & Economic Policy, January 2013
EXECUTIVE SUMMARY
e 2013 Who Pays: A Distributional Analysis of the Tax Systems in All Fiy States (the fourth edition of the
report) assesses the fairness of state and local tax systems. e report measures the state and local taxes
paid by dierent income groups in 2013 (at 2010 income levels including the impact of tax changes
enacted through January 2, 2013) as shares of income for every state and the District of Columbia. It
discusses state tax policy features and includes detailed state-by-state proles providing essential baseline
data for lawmakers seeking to understand the eect tax reform proposals will have on constituents at all
income levels.
• e main nding of this report is that virtually every state’s tax system is fundamentally unfair, taking a
much greater share of income from middle- and low-income families than from wealthy families. e
absence of a graduated personal income tax and the over reliance on consumption taxes
exacerbate this problem in many states.
• Combining all of the state and local income, property, sales and excise taxes state residents pay, the
average overall eective tax rates by income group nationwide are 11.1 percent for the boom 20
percent, 9.4 percent for the middle 20 percent and 5.6 percent for the top 1 percent.
• Ten states rank as having the most regressive overall tax systems. In these “Terrible Ten” states, the
boom 20 percent pay up to six times as much of their income in taxes as their wealthy counterparts.
Washington State is the most regressive, followed by Florida, South Dakota, Illinois, Texas, Tennessee,
Arizona, Pennsylvania, Indiana, and Alabama.
• Five of the ten most regressive states derive roughly half to two thirds of their tax revenue from sales and
excise taxes, compared to a national average of roughly one third. Five of these ten most regressive states
do not levy a broad-based personal income tax (four do not have any taxes on personal income and one
state only applies its personal income tax to interest and dividends) while the other ve have a personal
income tax rate that is at or virtually at.
• Of the three broad kinds of taxes states levy (income, property, consumption), the income tax is the
only one that is typically progressive in that its rate rises with income levels. Property taxes are usually
somewhat regressive. Sales and excise taxes are the most regressive, with poor families paying eight
times more of their income in these taxes than wealthy families, and middle income families paying ve
times more.
• Personal income taxes vary in their fairness not only because of rates but because of deductions and
exemptions. For example, the Earned Income Tax Credit improves progressivity in 24 states and the
District of Columbia, while nine states undermine progressivity by allowing taxpayers a reduced rate on
capital gains income.
1
INTRODUCTION
As elected ocials evaluate tax reform proposals, it is important to keep in mind the question of who pays
the most — and the least — of their income in state and local taxes.
is study assesses the fairness of each state’s tax system, measuring the state and local taxes paid by
dierent income groups in 2013 (at 2010 income levels including the impact of tax changes enacted
through January 2, 2013) as shares of income for every state and the District of Columbia. e report
provides valuable comparisons among the states, showing which states have done the best — and the
worst — job of providing a modicum of fairness in their tax systems overall.
e study’s main nding is that nearly every state and local tax system takes a much greater share of income
from middle- and low-income families than from the wealthy. at is, when all state and local income, sales,
excise and property taxes are added up, most state tax systems are regressive.
Fairness is, of course, in the eye of the beholder. Yet almost anyone would agree that the best-o families
should pay at a tax rate at least equal to what low- and middle-income families pay.
Who Pays? A Distributional Analysis of the Tax Systems in All 50 States, 4th Edition
• States’ consumption tax structures are highly regressive with an average 7 percent rate for the poor, a 4.6
percent rate for middle incomes, and a 0.9 percent rate for the wealthiest taxpayers. Because food is one
of the largest expenses for a low-income family, taxing food is a particularly regressive tax policy; ve
of the ten most regressive states tax food at the state or local level. Excise taxes on things like gasoline,
cigarees or beer take about 1.6 percent of the income of the poorest families, 0.8 percent from middle
income families and 0.1 percent of income from the most well-o.
• Taxes on personal and business property are a signicant revenue source for both states and localities
and are generally regressive in their overall eect, particularly for middle income households. A home-
stead exemption (exempting a at dollar or percentage amount of property value from a property tax)
improves progressivity. A property tax circuit breaker that caps the amount a property owner pays in
property taxes can also improve progressivity; none of the ten most regressive states oer this tax break
for low-income families regardless of age.
• States commended as “low tax” are oen high tax states for low- and middle-income families. e ten
states with the highest taxes on the poor are Arizona, Arkansas, Florida, Hawaii, Illinois, Indiana,
Pennsylvania, Rhode Island, Texas, and Washington. Seven of them are also among the “terrible ten”
because they are not only high tax for the poorest, but low tax for the wealthiest.
2
Virtually every state fails this basic test of tax fairness: as this study documents, no state requires their best-
o citizens to pay as much of their incomes in taxes as their very poorest taxpayers must pay, and only one
state taxes its wealthiest individuals at a higher eective rate than middle-income families have to pay.
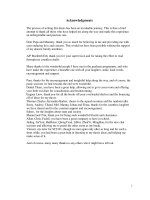
Nationwide, eective state and local tax rates on non-elderly families (see text box on page 18) follow a
strikingly regressive paern:
• e average state and local tax rate on the best-o one percent of families is 5.6 percent (this accounts
for the tax savings from federal itemized deductions for state and local taxes , an eect commonly
referred to as the “federal oset”. For more on the federal oset, see page 11).
• e average tax rate on families in the middle 20 percent of the income spectrum is 9.4 percent.
• e average tax rate on the poorest 20 percent of families is the highest of all. At 11.1 percent, it is
almost double the eective rate on the very wealthy.
Institute on Taxation & Economic Policy, January 20133
Averages for All States
Total State and Local Taxes Imposed on Non-Elderly Residents, as Shares of 2010 Income
11.1%
10.0%
9.4%
8.7%
7.7%
7.2%
5.6%
—
2%
4%
6%
8%
10%
12%
Lowest 20% Second 20% Middle 20% Fourth 20% Next 15% Next 4% Top 1%
Figure represents 50 state (and District of Columbia) average for total state and local taxes paid as a share of 2010 income, post- federal oset
THE 10 MOST REGRESSIVE STATE AND LOCAL TAX SYSTEMS
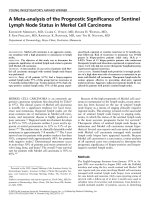
Ten states — Washington, Florida, South Dakota, Illinois, Texas, Tennessee, Arizona, Pennsylvania,
Indiana, and Alabama— are particularly regressive. ese “Terrible Ten” states ask their poorest residents
— those in the boom 20 percent of the income scale — to pay up to six times as much of their income in
taxes as they ask the wealthy to pay. Middle-income families in these states pay up to three times as high a
share of their income as the wealthiest families.
What Makes a State’s Tax System Regressive?
What characteristics do states with particularly regressive tax systems have in common? Looking at the ten
most regressive tax states, several important factors stand out:
• Four of the ten states do not levy a personal income tax— Florida, South Dakota, Texas, and
Washington. An additional state, Tennessee, only applies its personal income tax to interest and dividend
income.
• Five states do levy personal income taxes, but have structured them in a way that makes them much less
progressive than in other states. Pennsylvania , Illinois and Indiana use a at rate which taxes the income
of the wealthiest family at the same marginal rate as the poorest wage earner. Arizona and Alabama have
a graduated rate structure, however there is lile dierence between the boom marginal rate and top
marginal rate.
• Five of the ten most regressive tax systems— those of Washington, South Dakota, Tennessee, Arizona
and Alabama— rely very heavily on regressive sales and excise taxes. ese states derive roughly half to
two-thirds of their tax revenue from these taxes, compared to the national average of 34 percent in FY09-
10.
Who Pays? A Distributional Analysis of the Tax Systems in All 50 States, 4th Edition 4
Poorest
20%
Middle
60%
Top
1%
Poor to
Top 1%
Middle to
Top 1%
Washington 16.90% 10.50% 2.80% 605% 375%
Florida 13.20% 8.30% 2.30% 569% 357%
South Dakota 11.60% 8.20% 2.10% 552% 391%
Illinois 13.80% 11.10% 4.90% 285% 228%
Texas 12.60% 8.80% 3.20% 389% 273%
Tennessee 11.20% 8.60% 2.80% 400% 307%
Arizona 12.90% 9.70% 4.70% 274% 207%
Pennsylvania 12.00% 9.80% 4.40% 274% 225%
Indiana 12.30% 10.70% 5.40% 228% 199%
Alabama 10.20% 9.40% 3.80% 268% 246%
Taxes as a % of Income on
Note: States are ranked by the ITEP Tax Inequality Index. The ten states in the table are those whose tax systems most increase income inequality after taxes compared to before taxes. See page 130 for a
full description of the Index. Total taxes as a share of income are post-federal offset.
The Ten Most Regressive State Tax Systems
Taxes as shares of income by income for non-elderly residents
Ratio of
Institute on Taxation & Economic Policy, January 2013
THE LEAST REGRESSIVE STATE AND LOCAL TAX SYSTEMS
Just as the combination of at (or non-existent) income taxes and high sales and excise taxes tends to make
for very regressive tax systems, the most noticeable features of the least regressive tax states are exactly the
opposite: they have highly progressive income taxes and rely less on sales and excise taxes. For example:
• Vermont’s tax system is among the least regressive in the nation because it has a highly progressive
income tax and low sales and excise taxes. Vermont’s tax system is also made less unfair by the size of the
state’s refundable Earned Income Tax Credit (EITC) — 32 percent of the federal credit.
• Delaware’s income tax is not very progressive, but its high reliance on income taxes and very low use of
consumption taxes nevertheless results in a tax system that is only slightly regressive overall. Similarly,
Oregon has a high reliance on income taxes and very low use of consumption taxes. e state also
oers a refundable EITC and has a fairly progressive personal income tax rate structure.
• New York and the District of Columbia each achieve a close-to-at tax system overall through the use of
generous refundable EITC’s and an income tax with relatively high top rates and limits on tax breaks for
upper-income taxpayers.
It should be noted that even the least regressive states generally fail to meet what most people would
consider minimal standards of tax fairness. In each of these states, at least some low- or middle-income
groups pay more of their income in state and local taxes than the wealthiest families must pay.
5
Delaware
District of Columbia
New York
Oregon
Vermont
Characteristics of the Least Regressive Tax Systems
Personal Income Tax
Very
Progressive
High Reliance on
PIT
Use of Refundable
Credits
Low Use of Sales &
Excise Taxes
Who Pays? A Distributional Analysis of the Tax Systems in All 50 States, 4th Edition
1
States also rely on non-tax revenue sources such as user fees, charges, and gambling revenues. A few states rely heavily on non-traditional tax sources,
such as severance taxes on the extraction of natural resources, which are not included in this analysis.
THE KIND OF TAX MATTERS
State and local governments seeking to fund public services have historically relied on three broad types of
taxes — personal income, property, and consumption (sales and excise) taxes.
1
As can be seen by ITEP’s
analysis of the most and least regressive tax states, the fairness of state tax systems depends primarily on
which of these three taxes a state relies on most heavily. Each of these taxes has a distinct distributional
impact, as the table on this page illustrates:
• State income taxes are typically progressive — that is, as incomes go up, eective tax rates go up. On
average, poor families pay only a tenth of the eective income tax rate that the richest families pay, and
middle-income families pay about half of the eective rate of the well-to-do. Of the three major taxes
used by states, the personal income tax is the only one for which the eective tax rates typically rise with
income levels.
• Property taxes, including both taxes on individuals and business taxes, are usually somewhat regressive.
On average, poor homeowners and renters pay more of their incomes in property taxes than do any
other income group — and the wealthiest taxpayers pay the least.
• Sales and excise taxes are very regressive. Poor families pay almost eight times more of their incomes in
these taxes than the best-o families, and middle-income families pay more than ve times the rate of
the wealthy.
6
0%
1%
2%
3%
4%
5%
6%
7%
8%
Lowest 20%
Second 20%
Middle 20%
Fourth 20%
Next 15%
Next 4%
Top 1%
Taxes as Share of Income
Family Income Group
Comparing Types of Taxes: Averages for All States
(before federal offset)
Income Taxes
Sales & Excise Taxes
Property Taxes
Institute on Taxation & Economic Policy, January 2013
A state’s tax fairness is only partially determined by the mix of these three broad tax types. Equally impor-
tant is how states design the structure of each tax. Some personal income taxes are far more progressive
than others, simply because lawmakers chose to design them that way. e same is true, to a lesser extent,
of property and sales taxes: while any state relying heavily on these taxes is likely to have a regressive tax
structure, lawmakers can take steps to make these taxes less regressive. e overall regressivity of a state’s
tax system, therefore, ultimately depends both on a state’s reliance on the dierent tax sources and on how
the state designs each tax.
For example, California’s level of reliance on each of the three major tax types is fairly typical. But the state
income tax is more progressive than most — and this makes California’s tax system one of the least
regressive in the country.
Delaware, on the other hand, is one of the most progressive tax states not because any one of its taxes is
exceptionally progressive, but because it relies so heavily on a modestly progressive income tax and relies
very lile on regressive sales and excise taxes.
7
A proportional tax takes the same percentage of income from
everyone, regardless of how much or how little they earn.
Progressive, Regressive, Proportional
A progressive tax is one in which upper-income families pay a
larger share of their incomes in tax than do those with lower
incomes.
A r
egressive tax requires the poor and middle-income to pay a
larger share of their incomes in taxes than the rich.
Lowest
20%
Second
20%
Middle
20%
Fourth
20%
Next
15%
Next 4% Top 1%
A Progressive Tax
Lowest
20%
Second
20%
Middle
20%
Fourth
20%
Next
15%
Next 4% Top 1%
A Regressive Tax
Lowest
20%
Second
20%
Middle
20%
Fourth
20%
Next
15%
Next 4% Top 1%
A Proportional Tax
INCOME TAXES
State personal income taxes — with their counterpart, corporate income taxes — are the main
progressive element of state and local tax systems. In 2013, 41 states and the District of Columbia use
broad-based personal income taxes to partially oset the regressivity of consumption taxes and property
taxes. Yet some states have been noticeably more successful than others in creating a truly progressive
personal income tax — one in which eective tax rates increase with income. Some states, such as Califor-
nia or Vermont, have very progressive income taxes. Others have only nominally progressive taxes. A very
few states, such as Alabama and Pennsylvania, actually have what are eectively regressive income taxes.
ese dierences in the fairness of state income taxes are due to three broad policy choices made by
lawmakers: the use of either a graduated or at-rate tax structure, the use of exemptions and tax credits that
primarily benet low-income taxpayers, and in a number of states, the use of regressive tax loopholes that
primarily benet the wealthiest taxpayers.
Personal Income Tax Rate Structure
Of the states currently levying a broad-based personal income tax, all but seven have chosen to apply
graduated tax rates — in which higher tax rates are applied at higher income levels. e remaining seven
states — Colorado, Illinois, Indiana, Massachuses, Michigan, Pennsylvania, and Utah — tax income at
one at rate. While most of the “terrible ten” most regressive states achieve membership in this club by
having no income taxes at all, two of them — Pennsylvania and Illinois — achieve this dubious honor
through their use of a at-rate tax.
Who Pays? A Distributional Analysis of the Tax Systems in All 50 States, 4th Edition 8
State
Little or No
Income Tax
Flat-Rate Tax Low Top Rate
Most Pay at Top
Rate
Washington
Florida
South Dakota
Illinois
Texas
Tennessee
Arizona
Pennsylvania
Indiana
Alabama
Income Taxes (or not) in the 10 Most Regressive States
Institute on Taxation & Economic Policy, January 2013
However, using a graduated rate structure is not enough to guarantee an income tax that is progressive
overall. Some graduated-rate income taxes are about as fair as a at tax — and some nominally graduated
state income taxes are actually less progressive than some at-rate taxes. e level of graduation in state
income tax rates varies widely. e chart below shows three state income taxes — those of Alabama,
Louisiana, and California — that apply graduated rate structures with very dierent distributional impacts.
California’s income tax is quite progressive. Its ten graduated tax rates range from 1 percent to 13.3 percent.
(Temporary legislation enacted in 2012 added three top brackets and increased top rates.) Because the top
tax rate of 13.3 percent is a “millionaire’s tax,” most Californians pay at a much lower rate.
Louisiana’s income tax has fewer tax brackets (three) over a narrower range (2 to 6 percent), and the top
rate begins at $100,000 of taxable income for a married couple. e tax is progressive for low- and middle-
income families, but is basically at across the top 20 percent of the income distribution, so a family
earning a million a year pays the same top rate as a family earning $100,000. (e use of a small Earned
Income Tax Credit results in an eective tax rate that is slightly negative for low-income Louisianans.)
Alabama is a good example of a state with nominally graduated income tax rates that don’t mean much in
practice. e state’s top tax rate of 5 percent is not much lower than Louisiana’s top rate — but the top rate
kicks in at just $6,000 of taxable income for married couples. As a result, 66 percent of Alabama families
pay at the top rate. In combination with special tax breaks targeted to upper-income families, this
essentially at-rate structure results in an eective income tax rate that actually declines slightly at upper
income levels, making this income tax less progressive than even some at taxes.
9
-2%
0%
2%
4%
6%
8%
Lowest
20%
Second
20%
Middle
20%
Fourth
20%
Next
15%
Next 4%
Top 1%
Not All Income Taxes Are Created Equal
Alabama
Louisiana
California
Who Pays? A Distributional Analysis of the Tax Systems in All 50 States, 4th Edition
Income Tax Provisions that Benet Low- and Moderate-Income Families
Perhaps the most important factor enhancing the fairness of income taxes in recent years has been the
proliferation of low-income tax credits. ese credits are most eective when they are refundable — that is,
they allow a taxpayer to have a negative income tax liability which osets sales and property taxes — and
are adjusted for ination so they do not erode over time.
Twenty-four states and the District of Columbia have enacted state Earned Income Tax Credits based on
the federal EITC. Calculating a state EITC as a percentage of the federal credit makes the credit easy for
state taxpayers to claim (since they have already calculated the amount of their federal credit) and easy for
state tax administrators to monitor.
Refundability is an especially important component of state EITCs to ensure deserving families get the full
benet of the credit. Refundable credits do not depend on the amount of income taxes paid: if the credit
amount exceeds your income tax liability, the excess amount is given as a refund. us, refundable credits
are useful in oseing the regressive nature of sales and property taxes, and can provide a much needed
income boost to help families pay for basic necessities. In all but three states (Delaware, Rhode Island and
Virginia), the EITC is fully refundable. EITCs are most generous to families with children. e use of low-
income tax credits like the EITC are an important indicator of tax progressivity: only two of the ten most
regressive state income taxes has a permanent EITC, while seven of the ten most progressive state income
taxes currently provide a permanent EITC.
Because the Earned Income Tax Credit is targeted to low-income working families with children, it
typically oers lile or no benets to older adults and adults without children. us, refundable low-
income credits are a good complementary policy to state EITCs. Eleven states (Arizona, Georgia, Indiana,
Kentucky, Maryland, New York, Ohio, Pennsylvania, Virginia, West Virginia and Wisconsin) oer income
tax credits of their own design to ensure that families below a certain income level aren’t subject to the
personal income tax. ese credits also improve the progressivity of a state’s personal income tax. For
example, Ohio oers a nonrefundable credit which ensures that families with incomes less than $10,000
aren’t subject to the income tax. Kentucky oers a nonrefundable credit based on a family’s size which
ensures that families at or below the poverty level aren’t subject to state income taxes. Making these
targeted low-income credits refundable would increase their eectiveness for low-income families.
Five states (Arizona, Hawaii, Idaho, New Mexico and Oklahoma) oer an income tax credit to help oset
the sales and excise taxes that low-income families pay. Some of the credits are specically intended to
oset some of the impact of sales taxes on groceries. e credits are normally a at dollar amount for each
family member, and are available only to taxpayers with income below a certain threshold. ese credits are
usually administered on state income tax forms, and are refundable — meaning that the full credit is given
even if it exceeds the amount of income tax a claimant owes.
10
Institute on Taxation & Economic Policy, January 2013
Undermining Progressivity with Tax Breaks for Wealthy Taxpayers
In contrast to states that improve tax fairness with tax credits for low-income families, more than a dozen
states currently allow substantial tax breaks that undermine tax progressivity by targeting their benets to
the wealthy. Two of the most regressive state income tax loopholes are capital gains tax breaks (Arizona,
Arkansas, Hawaii, Montana, New Mexico, North Dakota, South Carolina, and Vermont) and deductions
for federal income taxes paid (Alabama, Iowa, Louisiana, Missouri, Montana, and Oregon).
In combination with a at (or only nominally graduated) rate structure, these tax breaks can sometimes
create the odd — and unfair — result of the highest income taxpayers paying less of their income in in-
come taxes than middle-income taxpayers must pay.
For example: Alabama allows a deduction for federal income taxes paid. Although Alabama’s income tax is
essentially at, the federal income tax is still progressive. So Alabama’s deduction for federal income taxes
paid disproportionately benets the state’s wealthiest taxpayers. As a result, eective marginal income tax
rates in Alabama actually decline at higher income levels. Despite the 5 percent top tax rate, the eective
income tax rate on the very wealthiest taxpayers is actually less than 3 percent. Like Alabama, two other
states allow a full deduction for federal taxes; three other states have a partial deduction.
THE FEDERAL OFFSET
Federal income tax rules allow taxpayers to claim itemized deductions for state and local personal income and property taxes (and,
temporarily, general sales taxes). e ability to deduct these taxes on your federal tax forms means that if you itemize (rather than take
the standard deduction) on your federal taxes, some of your state taxes are oset by lower federal taxes. is feature of the federal income
tax is what ITEP refers to as the “federal oset.”
e practical impact of being able to write o these state and local taxes is that if you itemize your federal income taxes, your state income
tax and property tax bills are never really as big as they appear. Some portion of the state taxes you pay initially will be directly oset by
lower federal taxes when you le your federal tax forms. For example, if a wealthy family pays $5,000 in state personal income tax, they
get a deduction from federal taxable income of $5,000. is means that as much of $5,000 of their income will be exempt from federal
income tax. How good a deal this is depends on how much income you have and whether or not you itemize on your federal returns.
Lower-income taxpayers who don’t itemize their federal income taxes will not be able to take advantage of the federal oset at all. On
average, a h of all state personal income and individually-paid property taxes are shied to the federal government (and to taxpayers
nationwide) as a result of the deductibility of state and local taxes from the federal tax. For the very best-o taxpayers, more than one-
third of their state and local income and property tax bills are eectively paid by the federal government.
e federal oset has a signicant impact on the boom-line state and local taxes beer-o taxpayers pay, and on cross-state dierences
in total eective taxes. For this reason, the Who Pays results are presented aer applying the federal oset to average total state and local
taxes. e detailed state summaries include data for each state pre- federal oset as well.
11
Who Pays? A Distributional Analysis of the Tax Systems in All 50 States, 4th Edition
Wisconsin allows a deduction for 30 percent of capital gains income. Because capital gains are realized
almost exclusively by the wealthiest 20 percent of taxpayers, this deduction makes the state income tax
much less progressive. Seven other states allow substantial capital gains tax breaks. In a welcome develop-
ment, several states (including Wisconsin) pared back or eliminated capital gains tax breaks in 2009.
SALES AND EXCISE TAXES
Sales and excise taxes are the most regressive element in most state and local tax systems. Because sales
taxes are levied at a at rate, and because spending as a share of income falls as income rises, sales taxes
inevitably take a larger share of income from low- and middle-income families than they take from the rich.
us, while a at-rate general sales tax may appear on its face to be neither progressive nor regressive, that is
not its practical impact. Unlike an income tax, which generally applies to most income, the sales tax applies
only to a portion of income that is spent — and exempts income that is saved. Since high earners are able
to save a much larger share of their incomes than middle-income families — and since the poor can rarely
save at all — the tax is inherently regressive.
e average state’s consumption tax structure is equivalent to an income tax with a 7 percent rate for the
poor, a 4.6 percent rate for the middle class, and a 0.9 percent rate for the wealthiest taxpayers. Obviously,
no one would intentionally design an income tax that looks like this — yet by relying on consumption
taxes as a revenue source, this is eectively the policy choice lawmakers nationwide have made.
e single most important factor aecting the fairness of dierent state sales taxes is the treatment of
groceries. Taxing food is a particularly regressive strategy because poor families spend most of their
income on groceries and other necessities. Of the ten most regressive sales taxes in the country, eight apply
to groceries in some form. A few states have enacted preferential tax rates for taxpayers perceived to have
less ability to pay — for example, South Carolina’s sales tax rate is lower for taxpayers over 85 — but these
special rates usually apply to taxpayers regardless of income level. Arkansas exempts some utilities for low-
income taxpayers.
12
State
Heavy Reliance on
Sales Tax
Food in Base
Washington
Florida
South Dakota
Illinois
Texas
Tennessee
Arizona
Pennsylvania
Indiana
Alabama
Sales Taxes in the 10 Most Regressive States
Institute on Taxation & Economic Policy, January 2013
Sales taxes are usually calculated as a percentage of the price of a fairly broad base of taxable items. Excise
taxes, by contrast, are imposed on a small number of goods, typically ones for which demand has a
practical per-person maximum (for example, one can only use so much gasoline). us, wealthy people
don’t keep buying more of these goods as their income increases. Moreover, excise taxes are typically
based on volume rather than price — per gallon, per pack and so forth. us beer-o people pay the
same absolute tax on an expensive premium beer as low-income families pay on a run-of-the-mill variety.
As a result, excise taxes are usually the most regressive kind of tax.
Overall, state excise taxes on gasoline, cigarees and beer take about 1.6 percent of the income of the
poorest families, 0.8 percent of the income of middle-income families, and just 0.1 percent of the income
of the very best-o. In other words, these excise taxes are 16 times harder on the poor than the rich, and 8
times harder on middle-income families than the rich.
In addition to being the most regressive tax, excise taxes are relatively poor revenue-raising tools because
they decline in real value over time. Since excise taxes are levied on a per-unit basis rather than ad valorem
(percentage of value), the revenue generated is eroded due to ination. at means excise tax rates must
continually be increased merely to keep pace with ination, not to mention real economic growth. Policy
makers using excise tax hikes to close scal gaps should recognize that reliance on excise tax revenues
means balancing state budgets on the back of the very poorest taxpayers — and that these revenues
represent a short-term x rather than a long-term solution.
PROPERTY TAXES
Property taxes have historically been the most important revenue source for state and local governments.
Today, a state’s property tax base typically includes only a subset of total wealth: primarily homes and
business real estate and, in some states, cars and business property other than real estate. Our analysis
shows that, overall, the property tax is a regressive tax — albeit far less regressive than sales and excise
taxes. ere are several reasons for this:
• For average families, a home represents the lion’s share of their total wealth. At high income levels,
however, homes are only a small share of total wealth. Because the property tax usually applies mainly
to homes and exempts most other forms of wealth, the tax applies to most of the wealth of middle-
income families, and hits a smaller share of the wealth of high-income families.
• For homeowners, home values as a share of income tend to decline at higher incomes. us, a typical
middle-income family’s home might be worth three times as much as the family’s annual income, while
a rich person’s home might be valued at one-and-a-half times his or her annual income or less.
• Renters do not escape property taxes. A portion of the property tax on rental property is passed
through to renters in the form of higher rent — and these taxes represent a much larger share of
income for poor families than for the wealthy. is adds to the regressivity of the property tax.
13
Who Pays? A Distributional Analysis of the Tax Systems in All 50 States, 4th Edition
e regressivity of the property tax is reduced by the business tax component, which generally falls on
owners of capital, and to a signicant degree is “exported” to residents of other states. On average, this study
nds that about 40 percent of a typical state’s property taxes fall on business (excluding the portion of
apartment taxes that is assigned to renters).
e regressivity of property taxes is also dependent on factors within the control of policy makers, such as
the use of exemptions, tax credits, and preferential tax rates for homeowners, and on external factors such
as housing paerns in the state. e fairest property taxes are generally those that use the following tax relief
strategies:
Homestead Exemptions
e most frequently used form of broad-based state property tax relief for homeowners is the homestead
exemption, which usually exempts a at dollar amount, or a at percentage of home value, from property
tax. Some states apply the exemption only to certain types of property tax levies, such as school taxes, while
other states apply the exemption to all homeowner property taxes.
Allowing a generous homestead exemption is what sets less regressive property-tax states apart from the
most regressive states. While several states have increased the value of their homestead exemptions in
recent years, many other states have allowed the real value of their homestead exemptions to diminish, as
growing assessed home values made xed-dollar exemptions less valuable.
14
State
Heavy Reliance
on Property Tax
Homestead
Exemption
Low Income
Circuit Breaker
Washington
61+ only
Florida
South Dakota
65+ only
Illinois
Texas
Tennessee
Arizona
65+ only
Pennsylvania
65+ only
Indiana
Alabama
Property Taxes in the 10 Most Regressive States
Institute on Taxation & Economic Policy, January 2013
Low-Income Circuit Breakers
A majority of states now oer some kind of credit designed to assist low-income taxpayers in paying their
property tax bills. Many of these credits come in the form of a “circuit breaker,” a relatively inexpensive —
and more precisely targeted — form of property tax relief that is allowed only when property tax bills
exceed a certain percentage of a person’s income. Unfortunately, as with all low-income property tax
credits, many circuit breakers are made available only to elderly taxpayers. Only nine states oer substantial
circuit breakers to all low-income property taxpayers regardless of age or disability. Notably, not a single
one of the ten most regressive states has a low-income circuit breaker.
LOW TAXES OR JUST REGRESSIVE TAXES?
is analysis has focused on the most regressive state and local tax systems and the factors that make them
so. Aside from their regressivity, however, many of these states have another trait in common: they are
frequently hailed as “low-tax” states, oen with an emphasis on their lack of an income tax. But this raises
the question: “low tax” for whom?
No income-tax states like Washington, Texas and Florida do, in fact, have average to low taxes overall. Can
they also be considered “low-tax” states for poor families? Far from it. In fact, these states’ disproportionate
reliance on sales and excise taxes make their taxes among the highest in the entire nation on low-income
families.
e table to the le shows the ten states that tax poor families
the most. Washington State, which does not have an income
tax, is the highest-tax state in the country for poor people. In
fact, when all state and local sales, excise and property taxes
are tallied up, Washington’s poor families pay 16.9 percent of
their total income in state and local taxes. Compare that to
neighboring Idaho and Oregon, where the poor pay 8.2 per-
cent and 8.3 percent, respectively, of their incomes in state and
local taxes — far less than in Washington.
Illinois, which relies heavily on consumption taxes, ranks
second in its taxes on the poor, at 13.8 percent. Florida— a
no-income-tax state —taxes its poor families at a rate of 13.3
percent, ranking third in this dubious category.
e boom line is that many so-called “low-
tax” states are high-tax states for the poor, and
most do not oer a good deal to middle-income
families either. Only the wealthy in such states
15
Washington 16.9%
Illinois 13.8%
Florida 13.3%
Hawaii 13.0%
Arizona 12.9%
Texas 12.6%
Indiana 12.3%
Rhode Island 12.1%
Pennsylvania 12.0%
Arkansas 11.9%
The Ten States with the Highest
Taxes on the Poor
HOW HAVE RECENT TAX CHANGES AFFECTED STATE TAX FAIRNESS?
State lawmakers have enacted a wide variety of tax changes over the past three years since the last publica-
tion of Who Pays. Many of these changes have dramatically reshaped state and local tax fairness — for
beer or worse. ere are several prominent trends worth noting:
Sustainable Tax Increases
• Six states have increased income tax rates on the best-o taxpayers. ese states include Maryland and
Connecticut (permanent changes) and California, the District of Columbia, New York and Hawaii
(temporary changes).
• Federal itemized deductions, costly tax breaks that disproportionately benet upper-income
taxpayers, were reduced or eliminated in four states. Rhode Island eliminated all federal itemized de-
ductions. Hawaii temporarily placed a cap on allowable itemized deductions while Minnesota and the
District of Columbia phased-out the benet of a portion of deductions.
• Rhode Island phased-out the benet of its standard deduction and personal exemption for upper-in-
come taxpayers and Maryland did the same for the personal exemption only.
Reducing Taxes for Low- and Moderate-Income Families
• Connecticut introduced a new state Earned Income Tax Credit (EITC) equal to 30 percent of the federal
credit. Illinois lawmakers doubled their state’s EITC from 5 to 10 percent.
• e personal exemption and standard deduction were increased in a number of states. Rhode Island,
Hawaii and Maine increased both the standard deduction and personal exemption. Oklahoma’s standard
deduction is also now tied to federal levels. Georgia increased its personal exemption for married couples
by $2,000.
• ree states — Arkansas, Tennessee, and West Virginia—decreased the sales tax rate on groceries.
Tax Cuts for the Wealthy and Protable Corporations
• Two states — Idaho and Oklahoma — reduced their income tax rates for upper-income families. In
these states, personal income taxes — and the tax system overall — have become more regressive as a
result.
• ree states — Kansas, Maine and North Dakota — reduced income tax rates “across the board.”
While these tax changes have provided some benet to lower- and middle-income families, by reducing
a progressive tax most of the benet went to upper-income households making the tax systems more
regressive overall.
Who Pays? A Distributional Analysis of the Tax Systems in All 50 States, 4th Edition 16
• Arizona enacted a new costly capital gains tax break.
• Kansas eliminated all pass-through business income from the personal income tax. North Carolina
temporarily oers a $50,000 exclusion for pass-through entitites and South Carolina introduced a lower
tax rate for small businesses.
• More than ten states gave away big breaks to protable corporations either through rate cuts, a change
in the apportionment formula used to calculate the corporate income tax, expanded exclusions, or the
reduction or elimination of personal property taxes. ese states include Arizona, Alabama, Florida,
Idaho, Louisiana, Michigan, Missouri, North Dakota, Pennsylvania, and Wisconsin.
Tax Hikes on Low- and Moderate-Income Families
• Several states either reduced or eliminated refundable credits designed to oset the impact of
regressive taxes on low- and moderate-income families. Michigan, New Jersey, and Wisconsin reduced
their Earned Income Tax Credits (EITC). Michigan also reduced its homestead property tax credit.
Kansas eliminated the food tax rebate credit, child and dependent care credit and homestead refund for
renters. Georgia made its low-income credit nonrefundable. Maine reduced the benet of the state’s
property tax circuit breaker program by 20 percent.
• Nine states have increased their cigaree tax.
• Connecticut and the District of Columbia permanently increased their state sales tax rate. Arizona,
Arkansas, California, Hawaii, Kansas, and Nevada all temporarily increased the sales tax.
Other Notable Changes
• A dozen states either adopted an “Amazon” law or reached an agreement with the online retailer to
collect and remit sales taxes in their states. e states include Arkansas, California, Georgia, Illinois,
Indiana, Massachuses, New Jersey, Nevada, South Carolina, Tennessee, Texas, and Virginia. is
change will help to level the playing eld between in-state brick and mortar retailers and online com-
petitors and increase sales tax revenue.
• Rhode Island, Connecticut and Colorado made small steps towards expanding their sales tax bases to
include services and other exempt goods.
Looking forward, legislators would do well to focus more clearly on real tax reform that achieves both
improved tax fairness and long-term revenue stability. e alternative — increasing a wide range of taxes
in times of scal diculty but reducing mainly progressive taxes in times of plenty — undermines both
progressivity and revenues.
Institute on Taxation & Economic Policy, January 201317
CONCLUSION
e main nding of this report is that virtually every state’s tax system is fundamentally unfair and is made
more so by the absence of a progressive personal income tax and by the over reliance on consumption
taxes which neutralize whatever benet the working poor receive from available low-income tax credits.
e bleak reality is that of the twenty-four states and the District of Columbia that have taken steps to
reduce the working poor’s tax share by enacting state earned income tax credits, nine still require their
poorest taxpayers to pay a higher eective tax rate than any other income group.
e results of this study provide an important reference for lawmakers seeking to understand the
inequitable tax structures enacted by their predecessors. States may ignore these lessons and continue to
demand that their poorest citizens pay the price of balanced state budgets. Or, they may decide instead to
ask wealthier families to pay tax rates more commensurate with their incomes. In either case, the path that
states choose in the near future will have a major impact on the well-being of their citizens — and on the
fairness of state and local taxes.
Who Pays? A Distributional Analysis of the Tax Systems in All 50 States, 4th Edition
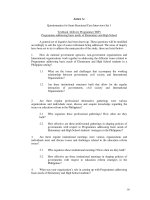
WHY THE SCOPE OF THE STUDY IS LIMITED TO NONELDERLY TAXPAYERS
e analyses contained in this report show the tax incidence of singles and couples, with and without children who are under the age
of 65. State tax structures are notorious for treating elderly families very dierently from other families and these dierences cloud the
incidence of state tax structures.
Virtually every state conforms to at least one of the federal government’s elderly tax breaks. All 42 states that levy broad-based income
taxes follow the federal exemption for Social Security benets, with many states exempting them altogether. Ten states allow their
seniors to claim the same higher federal standard deduction.
But most income tax states go beyond these tax preferences inherited from federal income tax rules to allow special elderly-only tax
breaks of their own. irty-six states allow an exemption for private or public pension benets. ese range from fully exempting all
pension benets for adults above a certain age (three states — Illinois, Mississippi, and Pennsylvania) to only exempting very specic
benets such as those for military veterans. Twenty-one states allow senior citizens an extra personal exemption or exemption credit,
allowing these taxpayers to shelter twice as much of their income from tax as similar non-elderly taxpayers can claim.
For example, Illinois exempts all pension and retirement income from their tax base which costs the state about $1 billion annually. If
retirement income were taxed the middle twenty percent of Illinoisans would see a tax increase equivalent to 0.2 percent of their
income on average. ose in the next quintile with an average income of $72,000 would see their taxes increased by 0.3 percent of their
income.
Because so many states oer special consideration for elderly taxpayers, including elderly families in the Who Pays analysis would not
give an accurate depiction of how the tax structure treats the majority of taxpayers.
18
Note: Table shows total state and local taxes paid as a share of 2010 income, post- federal oset.
Institute on Taxation & Economic Policy, January 201319
Total State and Local Taxes as a Share of Family Income for Non-Elderly Taxpayers in All 50 States and DC
States Lowest 20% Second 20% Middle 20% Fourth 20% Next 15% Next 4% Top 1%
Alabama 10.2% 10.4% 9.6% 8.3% 6.7% 5.1% 3.8%
Alaska 7.0% 5.3% 4.5% 3.4% 3.1% 2.5% 2.4%
Arizona 12.9% 11.4% 9.4% 8.3% 7.0% 6.0% 4.7%
Arkansas 11.9% 12.1% 11.4% 10.0% 9.1% 7.0% 6.0%
California 10.6% 9.2% 8.2% 7.6% 7.4% 8.7% 8.8%
Colorado 8.9% 9.0% 8.3% 7.6% 6.6% 5.8% 4.6%
Connecticut 11.0% 9.1% 10.5% 10.3% 9.1% 7.7% 5.5%
Delaware 5.7% 5.3% 5.4% 5.3% 5.3% 4.9% 4.2%
DC 6.6% 9.8% 11.0% 9.4% 8.5% 7.3% 6.3%
Florida 13.2% 9.7% 8.5% 6.8% 5.5% 4.3% 2.3%
Georgia 11.3% 10.7% 9.6% 9.1% 8.0% 7.2% 4.9%
Hawaii 13.0% 12.4% 11.6% 10.0% 8.4% 7.5% 8.0%
Idaho 8.2% 7.8% 7.8% 8.0% 7.6% 6.8% 6.4%
Illinois 13.8% 12.0% 10.9% 10.3% 9.0% 7.6% 4.9%
Indiana 12.3% 11.4% 10.8% 10.0% 8.5% 7.0% 5.4%
Iowa 10.9% 10.3% 10.1% 9.6% 8.6% 7.0% 6.0%
Kansas 10.3% 8.7% 8.9% 8.5% 7.7% 6.2% 3.9%
Kentucky 9.1% 10.7% 10.9% 9.7% 8.8% 7.3% 5.7%
Louisiana 10.6% 10.5% 10.1% 9.2% 7.3% 5.7% 4.6%
Maine 9.6% 9.3% 9.3% 9.1% 8.8% 7.7% 6.9%
Maryland 9.7% 9.5% 9.9% 9.1% 8.0% 8.3% 6.4%
Massachusetts 10.0% 9.8% 9.3% 8.7% 7.6% 7.3% 4.9%
Michigan 9.7% 9.6% 9.5% 9.3% 8.1% 7.3% 5.8%
Minnesota 8.8% 9.6% 9.6% 9.6% 8.5% 8.1% 6.2%
Mississippi 10.4% 10.4% 10.5% 9.0% 7.5% 6.0% 5.4%
Missouri 9.6% 9.2% 9.0% 8.7% 7.6% 6.8% 5.4%
Montana 6.4% 6.1% 6.3% 6.0% 5.6% 5.2% 4.7%
Nebraska 10.9% 9.9% 10.3% 9.0% 8.3% 7.7% 5.8%
Nevada 9.0% 7.0% 6.8% 6.0% 4.9% 3.8% 2.4%
New Hampshire 8.6% 7.4% 6.6% 6.0% 5.2% 4.2% 2.4%
Appendix A: Who Pays Summary Results
Who Pays? A Distributional Analysis of the Tax Systems in All 50 States, 4th Edition 20
Note:
Table shows total state and local taxes paid as a share of 2010 income, post- federal oset.
Total State and Local Taxes as a Share of Family Income for Non-Elderly Taxpayers in All 50 States and DC
continued
States Lowest 20% Second 20% Middle 20% Fourth 20% Next 15% Next 4% Top 1%
New Jersey 11.2% 10.0% 9.1% 8.7% 7.9% 8.8% 7.0%
New Mexico 10.6% 10.2% 9.7% 9.2% 7.9% 6.4% 4.8%
New York 10.0% 10.4% 11.9% 11.4% 11.0% 11.0% 6.9%
North Carolina 9.8% 9.5% 9.4% 9.1% 8.3% 7.7% 6.5%
North Dakota 9.2% 7.8% 7.5% 6.7% 5.8% 4.6% 3.6%
Ohio 11.6% 10.6% 10.3% 9.7% 9.0% 7.8% 6.3%
Oklahoma 10.3% 9.7% 9.3% 8.4% 7.5% 5.8% 4.6%
Oregon 8.3% 7.7% 7.6% 7.8% 7.3% 7.4% 7.0%
Pennsylvania 12.0% 10.4% 10.1% 9.0% 8.2% 6.8% 4.4%
Rhode Island 12.1% 10.1% 10.5% 9.5% 8.7% 8.6% 6.4%
South Carolina 7.1% 6.9% 7.3% 7.4% 7.2% 6.0% 5.0%
South Dakota 11.6% 9.5% 8.0% 7.0% 5.6% 3.9% 2.1%
Tennessee 11.2% 10.1% 8.8% 6.8% 5.4% 4.0% 2.8%
Texas 12.6% 10.4% 8.6% 7.4% 6.1% 4.8% 3.2%
Utah 9.4% 9.0% 8.7% 8.3% 7.4% 6.6% 5.0%
Vermont 8.7% 9.1% 10.4% 8.9% 8.3% 8.1% 8.0%
Virginia 8.6% 8.2% 8.2% 7.9% 6.9% 6.7% 4.9%
Washington 16.9% 12.3% 10.4% 8.7% 6.8% 4.7% 2.8%
West Virginia 8.7% 8.6% 8.9% 8.7% 8.1% 6.8% 6.3%
Wisconsin 9.6% 10.7% 10.7% 10.6% 9.7% 8.3% 6.9%
Wyoming 8.2% 7.1% 5.9% 5.0% 4.0% 3.0% 1.6%
United States 11.1% 10.0% 9.4% 8.7% 7.7% 7.2% 5.6%
Appendix A: Who Pays Summary Results
Institute on Taxation & Economic Policy, January 201321
Source: US Census State & Local Government Finance Data (Fiscal years 2000 and 2010)
Property
Sales &
Excise
Income
(Personal
& Corp.)
Other Total Property
Sales &
Excise
Income
(Personal
& Corp.)
Other Total
Alabama 8.4% 28.8% 15.1% 6.9% 59.1% 40.9% 10.8% 26.4% 13.1% 5.4% 55.5% 44.5%
3.6%
Alaska 10.0% 3.7% 5.7% 10.9% 30.3% 69.7% 12.2% 6.3% 6.0% 32.8% 57.3% 42.7%
–27.0%
Arizona 21.2% 33.0% 15.3% 3.0% 72.5% 27.5% 25.6% 30.5% 9.9% 2.7% 68.8% 31.2%
3.8%
Arkansas 11.0% 33.6% 19.5% 4.1% 68.1% 31.9% 12.5% 34.4% 17.8% 3.5% 68.1% 31.9%
–0.0%
California 15.4% 23.4% 27.2% 4.8% 70.7% 29.3% 21.4% 20.6% 21.7% 4.8% 68.5% 31.5%
2.2%
Colorado 18.7% 24.6% 20.1% 3.7% 67.0% 33.0% 24.9% 21.0% 13.8% 4.0% 63.7% 36.3%
3.3%
Connecticut 27.8% 26.0% 22.6% 4.2% 80.5% 19.5% 34.4% 20.5% 24.0% 2.9% 81.8% 18.2%
–1.3%
Delaware 8.7% 6.8% 23.2% 21.1% 59.9% 40.1% 29.0% 7.3% 16.2% 21.3% 55.0% 45.0%
4.9%
Dist. of Col. 17.4% 25.1% 33.6% 4.7% 80.7% 19.3% 10.2% 21.2% 22.4% 5.9% 78.5% 21.5%
2.2%
Florida 22.0% 34.7% 1.8% 7.0% 65.4% 34.6% 26.2% 28.6% 1.7% 4.5% 61.0% 39.0%
4.4%
Georgia 18.2% 28.5% 21.7% 3.0% 71.3% 28.7% 23.1% 24.0% 16.8% 1.8% 65.7% 34.3%
5.6%
Hawaii 10.4% 36.9% 19.7% 3.8% 70.7% 29.3% 14.8% 34.5% 17.1% 3.8% 70.2% 29.8%
0.6%
Idaho 17.6% 21.7% 22.2% 5.5% 66.9% 33.1% 18.1% 21.2% 16.2% 4.6% 60.2% 39.8%
6.7%
Illinois 27.1% 24.9% 18.5% 4.7% 75.1% 24.9% 31.6% 23.0% 13.3% 4.5% 72.4% 27.6%
2.7%
Indiana 22.6% 20.8% 21.1% 2.1% 66.6% 33.4% 21.5% 24.3% 16.9% 2.9% 65.7% 34.3%
0.9%
Iowa 21.2% 22.0% 17.5% 5.4% 66.1% 33.9% 21.9% 21.1% 15.5% 4.5% 62.9% 37.1%
3.2%
Kansas 19.9% 26.5% 19.6% 4.0% 69.8% 30.2% 21.9% 21.9% 17.0% 2.8% 63.7% 36.3%
6.1%
Kentucky 11.6% 24.9% 25.3% 6.9% 68.6% 31.4% 14.0% 24.8% 22.1% 4.3% 65.2% 34.8%
3.4%
Louisiana 10.1% 36.0% 10.4% 6.5% 63.0% 37.0% 12.9% 33.2% 10.2% 5.3% 61.6% 38.4%
1.4%
Maine 27.5% 20.6% 21.1% 4.3% 73.4% 26.6% 30.4% 21.4% 19.0% 4.0% 74.8% 25.2%
–1.5%
Maryland 19.7% 18.9% 31.0% 5.3% 74.8% 25.2% 22.7% 18.3% 29.2% 5.1% 75.3% 24.7%
–0.6%
Massachusetts 24.0% 16.2% 32.5% 3.0% 75.5% 24.5% 27.7% 15.0% 25.5% 3.3% 71.4% 28.6%
4.0%
Michigan 20.6% 21.5% 21.9% 4.4% 68.3% 31.7% 25.9% 23.5% 11.8% 3.1% 64.4% 35.6%
3.9%
Minnesota 17.4% 22.6% 24.3% 5.3% 69.4% 30.6% 21.1% 23.0% 20.2% 4.4% 68.6% 31.4%
0.8%
Mississippi 14.5% 31.8% 12.3% 4.2% 62.6% 37.4% 16.9% 27.9% 11.1% 3.9% 59.8% 40.2%
2.8%
Missouri 16.8% 28.8% 20.3% 4.8% 70.6% 29.4% 20.0% 24.9% 17.0% 4.2% 66.0% 34.0%
4.6%
Montana 25.6% 9.7% 17.4% 7.5% 60.0% 40.0% 24.0% 10.1% 15.1% 11.1% 60.3% 39.7%
–
0.2%
Taxes
Non-Tax
Revenues
Fiscal Year 2010
Non-Tax
Revenues
Appendix B: Changes in the Composition of State & Local General Own-Source Revenue
Change in
Non-Tax
Share
Fiscal Year 2000
Taxes
Fiscal Year 2000-2010, Including Non-Tax Revenues