Báo cáo " RENEWABLE ENERGY MARKETS IN DEVELOPING COUNTRIES " potx
Bạn đang xem bản rút gọn của tài liệu. Xem và tải ngay bản đầy đủ của tài liệu tại đây (246.09 KB, 42 trang )
30 Sep 2002 15:7 AR AR171-EG27-10.tex AR171-EG27-10.sgm LaTeX2e(2002/01/18) P1: IBC
10.1146/annurev.energy.27.122001.083444
Annu. Rev. Energy Environ. 2002. 27:309–48
doi: 10.1146/annurev.energy.27.122001.083444
RENEWABLE ENERGY MARKETS IN DEVELOPING
COUNTRIES
∗
Eric Martinot,
1
Akanksha Chaurey,
2
Debra Lew,
3
Jos
´
e Roberto Moreira,
4
and Njeri Wamukonya
5
1
Global Environment Facility, 1818 H St. NW, Washington, DC 20433;
e-mail:
2
Tata Energy Research Institute, Habitat Place, Lodhi Road, New Delhi 110003, India;
e-mail:
3
National Renewable Energy Laboratory, 1617 Cole Boulevard, Golden, Colorado 80401;
e-mail:
4
Biomass Users Network, Rua Francisco Dias Velho 814, 04581-001 S
˜
ao Paulo, Brazil;
e-mail:
5
UNEP Collaborating Centre on Energy and Environment, Risø National Laboratory,
PO Box 49, DK-4000 Roskilde, Denmark; e-mail:
Key Words rural development, sustainable energy policy, solar, biomass, wind
power
■ Abstract Renewable energy is shifting from the fringe to the mainstream of sus-
tainable development. Past donor efforts achieved modest results but often were not
sustained or replicated, which leads now to greater market orientation. Markets for
rural household lighting with solar home systems, biogas, and small hydro power have
expanded throughruralentrepreneurship, government programs, and donor assistance,
serving millions of households. Applications in agriculture, small industry, and social
services areemerging. Publicprograms resultedin 220million improved biomasscook
stoves. Three percent of power generation capacity is largely small hydro and biomass
power, with rapid growth of wind power. Experience suggests the need for technical
know-how transfer, new replicablebusiness models,credit forrural households anden-
trepreneurs, regulatory frameworks andfinancing for private power developers, market
facilitation organizations, donor assistance aimed at expanding sustainable markets,
smarter subsidies, and greater attention to social benefits and income generation.
CONTENTS
INTRODUCTION 310
FROM DONOR AID TO SUSTAINABLE MARKETS 313
EXPERIENCE WITH APPLICATIONS AND MARKETS 315
∗
The US Government has the right to retain a nonexclusive, royalty-free license in and to
any copyright covering this paper.
309
30 Sep 2002 15:7 AR AR171-EG27-10.tex AR171-EG27-10.sgm LaTeX2e(2002/01/18) P1: IBC
310 MARTINOT ET AL.
Rural Residential and Community Lighting,
TV, Radio, and Telephony 315
Rural Small Industry, Agriculture, and Other Productive Uses 319
Grid-Based Power Generation 320
Residential and Commercial Cooking and Hot Water 323
Transport Fuels 324
EMERGING LESSONS 326
Impacts on Rural Development 326
Affordability, Consumer Credit, and Sales Versus Rentals 328
Equipment Subsidies and Market Distortions 330
Rural Enterprise Development, Financing,
and Business Viability 332
Policies and Financing for Private Power Producers 333
Market Facilitation Organizations 336
CONCLUSIONS 338
INTRODUCTION
Developing countries have 80% of the world’s population but consume only 30%
of global commercial energy. As energy consumption rises with increases in pop-
ulation and living standards, awareness is growing about the environmental costs
of energy and the need to expand access to energy in new ways. Increased recog-
nition of the contribution renewable energy makes to rural development, lower
health costs (linked to air pollution), energy independence, and climate change
mitigation is shifting renewable energy from the fringe to the mainstream of sus-
tainable development. Support for renewable energy has been building among
those in government, multilateral organizations, industry, and nongovernmental
organizations (NGOs) pursuing energy, environment, and development agendas at
local, national, and global levels. At the same time, commercial markets for re-
newable energy are expanding, shifting investment patterns away from traditional
government and international donor sources to greater reliance on private firms
and banks (1–12).
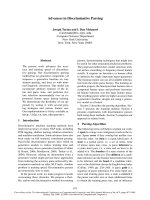
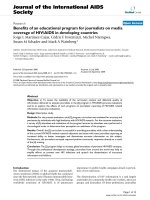
Changing investmentpatterns makeit moreimportant tothink aboutmarketsfor
renewable energy, rather than simply about the technologies themselves and their
economic characteristics (Figure 1). Changing investment patterns also elicit in-
creased decision-making and participation from a wider variety of stakeholders—
not just traditional donor agencies and governments, but also manufacturers, ru-
ral entrepreneurs, individual households, local technicians, NGOs, community
groups, utility companies, and commercial banks.
Renewable energy commonly refers to both traditional biomass (i.e., fuelwood,
animal wastes, and crop residuesburned in stoves) and modern technologies based
on solar, wind, biomass, geothermal, and small hydropower. Our definition here,
also called new renewables by many others, excludes large hydropower because
it is already a mature technology and treated well elsewhere. While traditional
biomass provides about 7%–11% of global primary energy supply, the modern
30 Sep 2002 15:7 AR AR171-EG27-10.tex AR171-EG27-10.sgm LaTeX2e(2002/01/18) P1: IBC
RENEWABLE ENERGY MARKETS 311
Figure 1 Renewable energy: from technologies to markets.
forms of renewable energy provide about 2% (13). For developing countries, the
traditional biomass share averages 30%–45%, although some developing coun-
tries approach 90%. Besides traditional biomass, small hydropower in China and
transport ethanol in Brazil are among the largest single contributors to renewable
energy supplies in developing countries. In fact, modern biomass represents 20%
of Brazil’s primary energy supply, aided by significant increases in the past 20
years in the use of ethanol fuels for vehicles and sugarcane waste for power gen-
eration. The largest developing country—China—gets about 2% of its primary
energy supply from renewable energy, mostly from small hydropower generation.
Globally, contributions from wind power and solar photovoltaics (PV) are still
small, but applications of these technologies are growing fast—at annual rates of
10%–30% in recent years.
Most treatments of renewables in the literature are organized by supply tech-
nology (e.g., solar, wind, biomass). A large literature looks at technology options,
comparative costs, resource potentials, environmental and social benefits,research
and development, commercialization, and technical performance (11, 14–21). The
literaturethat approachesrenewableenergyfrom amarketor end-useperspectiveis
much smaller but has grown rapidly in recent years. This literature is by no means
well-defined because market-oriented elements appear in a variety of sources.
But a market orientation focuses on what underlies a market—social conditions,
consumer knowledge, demand for products or services (driven by the benefits
they confer and affected by social structures and culture), product characteristics,
30 Sep 2002 15:7 AR AR171-EG27-10.tex AR171-EG27-10.sgm LaTeX2e(2002/01/18) P1: IBC
312 MARTINOT ET AL.
TABLE 1 Renewable energy markets in developing countries
a
Application Indicators of existing installations and markets (as of 2000)
1. Rural residential Over 50 million households are served by small-hydro village-scale
and community mini-grids.
lighting, TV, radio, 10 million households get lighting from biogas.
and telephony 1.1 million households have solar PV home systems or solar lanterns.
10,000 households are served by solar/wind/diesel hybrid mini-grids.
2. Rural small Up to 1 million water pumps are driven by wind turbines, and over
industry, 20,000 water pumps are powered by solar PV.
agriculture, and Up to 60,000 small enterprises are powered by small-hydro
other productive village-scale mini-grids.
uses
b
Thousands of communities receive drinking water from solar
PV-powered purifiers/pumps.
3. Grid-based bulk 48,000-MW installed capacity produces 130,000 GWh/year (mostly
power
c
small hydro and biomass, with some geothermal and wind).
More than 25 countries have regulatory frameworks
for independent power producers.
4. Residential/ 220 million households have more-efficient biomass stoves.
commercial 10 million households have solar hot water systems.
cooking and hot 800,000 household have solar cookers.
water
5. Transport fuels 14 billion liters per year ethanol vehicle fuel is produced from biomass.
180 million people live in countries mandating mixing of ethanol
with gasoline.
a
Figures are authors’ estimates based on tabulations of country-level statistics from sources cited in the text and other sources.
Very few of these indicators are summarized well in a single source. Figures are approximate.
b
Agriculture and productive-use applications are difficult to estimate because little published data exists.
c
A share of stated grid-based power capacity serves small village mini-grids.
sales volume, financing and credit, manufacturing, suppliers and distributors,
technical skills, service networks, business models, regulatory frameworks, and
public policies.
1
Much of the market-oriented literature tends to cover selected end-use appli-
cations, projects, or countries. A global overview has been missing. In this paper
we provide an aggregate review of past market experience, existing applications,
and results of policies and programs, organized by end-use application rather than
by technology (Table 1). We then review the emerging lessons suggested by these
experiences forsix keyissues ranging from ruraldevelopmentimpactsto subsidies
to enterprise development. We believe that grouping lessons by issue proves more
useful than a single group of renewable energy lessons.
1
A large gray literature on renewable energy markets exists, with much experience unre-
ported or distributed informally. Market participants orobservers, particularlythose in rural
areas, may not publish or may lack the means to share their experience.
30 Sep 2002 15:7 AR AR171-EG27-10.tex AR171-EG27-10.sgm LaTeX2e(2002/01/18) P1: IBC
RENEWABLE ENERGY MARKETS 313
FROM DONOR AID TO SUSTAINABLE MARKETS
In the 1970s and 1980s, many development assistance agencies attempted to pro-
mote small-scale renewable-energy technologies such as biogas, cooking stoves,
wind turbines, and solar heaters in developing countries. From 1980 to 2000,
official development assistance for renewable energy totaled about $3 billion [es-
timate basedon donor statisticsfrom the Organization forEconomic Co-Operation
and Development, which do not separate small from large hydro; see also (29)],
most of which went for geothermal, wind, and small hydro technologies. Much
of this, particularly aid for rural areas, focused on technical demonstrations or
on projects that were narrowly self-sustaining but could not be replicated. Many
projects were considered failures because of poor technical performance, and poor
suitability to user needs and local conditions (stemming from lack of involvement
of relevant stakeholders). Projectsoften did not demonstrateinstitutional and com-
mercial viability and lacked mechanisms for equipment maintenance, sustainable
sources of credit and expertise, and incentive structures for sustained operating
performance (22–31).
Kozloff & Shobowale (29) concluded that “between 1979 and 1991, most of-
ficial development assistance for renewable energy funded fixed capital assets.
Much smaller amounts were used to meet such recurrent costs as maintenance,
and less than 10 percent was spent imparting the technical and managerial skills
needed to build national capacity.” The United Nations Development Progamme
(UNDP)/World Bank Energy Sector Management Assistance Program (23) re-
ported that a large number of the early donor programs encountered a variety of
technical problems; “many programs badly underestimated problems ofrepair and
maintenance in the mistaken belief that PV systems were virtually maintenance
freeand couldbecared forby untrainedlocalpeople.” Asaresult, bythelate 1980s,
donors had become disillusioned, and aid recipients had come to view renewables
as second-class technologies that industrialized countries were unwilling to adopt
themselves.
In reviewing its portfolio of solar home systems in the 1980s, the German
aid agency GTZ, one of the most active donor agencies promoting PV since the
1980s, said: “there has not been a single project that was designed expressly to
disseminate the technology . Rather, the bulk of activities have taken the form
of pilot projects or testing and demonstration projects frequently characterized
by the diffusion of a small number of systems and public-sector counterpart
institutions which showed little interest in promoting a commercial dissemination
process” (26).
At the same time, however, many developing countries were busy with their
own renewable energy programs. Large-scale initiatives by developing-country
governments included ethanol use for transport in Brazil, household biogas for
lighting and cooking in China and India, grid-connected wind power in India,
and small hydro power in Nepal. Some success stories, such as the market for
solar home systems in Kenya, began with donor assistance in the 1980s but then
30 Sep 2002 15:7 AR AR171-EG27-10.tex AR171-EG27-10.sgm LaTeX2e(2002/01/18) P1: IBC
314 MARTINOT ET AL.
graduated to private sector–led markets in the 1990s. Common to these experi-
ences is the fit between technologies and user needs and practices. For example,
Hurst (28) argues that the success of solar hot water heaters in several coun-
tries, micro-hydro in Nepal, and wind-turbine water pumps in Argentina dur-
ing the 1980s occurred because relatively little change of behavior was involved.
Similarly, the ethanol vehicle fuel program in Brazil was successful partly be-
cause using ethanol required little change in consumers’ attitudes or behaviors
(32).
Many early programs were not successful, however, often because the factors
for sustainability and replication were missing. For example, a Philippine govern-
ment program for biogas-powered water pumping in the 1980s saw only 1% of
the gasifiers in use after some years, while 16% went unused and 80% needed
repair. Some of the reasons cited: the program agency coped with pressure to
meet installation targets by circumventing technical standards and guidelines; in-
dividual farmers were not accountable for loan repayments in cooperative-based
loan arrangements, which led to low repayment rates and lack of funds for pro-
gram replication; the need for dual fuel supplies—both diesel and biogas—was
inconvenient and required changes in behavior; and inadequate training and poor
maintenance practices resulted in engine failures (33).
The 1992 UN Conference on Environment and Development (the Rio Earth
Summit) along with the resulting UN Framework on Climate Change breathed
new political life into donor assistance for renewables (7, 10, 18, 34–37). Linked
to the Earth Summit in the 1990s were new forms of multilateral assistance for
renewable energy, which included about $600 million in grant assistance by the
Global Environment Facility, $2 billion in loans from the Word Bank (aided by
its new Asia Alternative Energy Unit), and new initiatives by the UN Devel-
opment Programme. Many of these projects were designed to promote sustain-
able technology diffusion and markets by removing key barriers related to skills,
financing, institutionaland business models,and policies.Project development and
implementation progress has been slow, however, and substantial field experience
from most of these multilateral programs is just now emerging. Still, the agencies
themselves have learned and evolved in their approaches (38–42).
In the late 1990s, private multinational corporations such as Shell and British
Petroleum also began to commit hundreds of millions of dollars to renewable
energy investments, some of which was to go to developing countries. Many do-
mestic firms in developing countries also entered the renewable energy business
in the 1990s. But companies found such investments to be more difficult than they
imagined in developing countries, and progress in fulfilling these commitments
has been slow.
Among bilateral donors, the practice of simple equipment provision contin-
ues, although some donor programs have taken more market-oriented approaches
that respond to local demand and user needs, promote enterprise development
for sustained service, and create financing mechanisms independent of continu-
ing donor aid. These market-oriented approaches were being recommended again
30 Sep 2002 15:7 AR AR171-EG27-10.tex AR171-EG27-10.sgm LaTeX2e(2002/01/18) P1: IBC
RENEWABLE ENERGY MARKETS 315
and again in the 1990s by analysts and critics of historical donor assistance pro-
grams (6, 8, 24, 29, 39, 43–45). Most recently, a task force of the G-8 group
of industrialized countries recommended market-oriented approaches and advo-
cated a goal of serving 500 million people in developing countries with renewable
energy within a decade (46). A growing body of experience shows that success-
ful approaches to promoting renewable energy should expand and sustain mar-
kets for specific applications that offer the economic and social benefits most
needed.
EXPERIENCE WITH APPLICATIONS AND MARKETS
Rural Residential and Community Lighting,
TV, Radio, and Telephony
Roughly 350–400 million households, or 40% of the population of developing
countries, do not have access to electricity (3, 4,11). The proportions of rural
populations served by electricpower gridsrange from 98% inThailand and 85%in
Mexico toonly 2%–5% inmuchof sub-Saharan Africa.In the middle arecountries
such as Brazil, Bangladesh, India, Morocco, and South Africa, with 20%–30% of
rural populations electrified. In China, 94% rural electrification still translates into
a large number of people (75 million) without access to power (3, 27, 47–51).
Household and community demand for lighting, TV, radio, and wireless tele-
phony in rural areas without electricity has driven markets for solar home systems,
biogas-fueled lighting, small hydro mini-grids, wind or solar hybrid mini-grids,
and small wind turbines.
2
These technologies are not strictly comparable with
one another; however, the level of service that households receive varies con-
siderably by technology and by the specific equipment size used. Regardless of
size, surveys and anecdotal evidence suggest that rural households highly value
both electric lighting and television viewing. Development professionals often
refer to so-called “willingness to pay,” as measured by some household sur-
veys, as proof of this demand (3). Growing numbers of individual equipment
purchases, beyond government-driven programs,also point tothe market “demand
pull.”
SOLAR HOME SYSTEMS A solar homesystem consists of aphotovoltaic (PV)solar
panel (typically 15–75 watts), battery, charging controller, and end uses like flo-
rescent lamps. Suchsystemscan reduce the need forcandles and kerosene. Typical
purchase prices range from $200–$1200. Smaller solar lanterns (typically 10–20
watts) provide lighting only. An estimated 1.1 million solar home systems and
solar lanterns exist in rural areas of developing countries, and donor approaches
2
Many households without access to electricity routinely use dry cell and car batteries for
small power needs. Central solar-powered battery charging stations have been driven by
donor assistance but are not widespread. Thailand has achieved some success (52).
30 Sep 2002 15:7 AR AR171-EG27-10.tex AR171-EG27-10.sgm LaTeX2e(2002/01/18) P1: IBC
316 MARTINOT ET AL.
and markets have evolved in recent years. Most installations are individual house-
hold systems, but some serve public buildings such as schools, health clinics, and
community centers—with thousands of such applications in some countries (27,
39–43, 53–64).An estimated 10%–20%of householdsystems are nolonger opera-
tional, although equipmentcertification and standardshave improvedperformance
(59, 63). Battery replacement and disposal are serious problems.
The largest existing markets for solar home systems are India (450,000), China
(150,000),Kenya(120,000),Morocco(80,000),Mexico(80,000),andSouthAfrica
(50,000). Kenya and China are probably the fastest growing markets, with annual
growth ratesof 10%–20% in recent years.Other notable emerging markets include
Argentina, Bangladesh, Botswana, Bolivia, Brazil, Dominican Republic, Indone-
sia, Namibia, Nepal, Philippines, Sri Lanka, Tunisia, and Zimbabwe. Many of the
components for solar home systems—such as batteries, controllers, and lights—
are manufactured in these countries. Often local systems integrators adapt and
match components to suit local conditions. PV module manufacturers now exist
in India (23 firms), China (7 firms), Thailand (3 firms), and Namibia (1 firm). PV
cells are manufactured in India (9 firms) and China (7 firms).
India’s PV market has been driven by a long-standing government program
of subsidy, tax, and financial incentives that began in the 1980s. Subsidies have
accompanied mostsolar homesystems installed, whileloan andfinancing schemes
have supported further private sector sales. As market volumes increased, policies
began to favor commercial, market-oriented approaches rather than technology
research and demonstration. Manufacturers became more active and invested in
dealer and distributor networks, service centers, and credit schemes. Simultane-
ously, public agencies established local service centers and solar shops to help
market growth, and NGOs also became involved. More recently, both public ef-
fortsand entrepreneurshavefocusedmorestrongly onaftersales service.However,
the number of installations by private entrepreneurs or other community organi-
zations on purely commercial terms (without government subsidies) is still small
(47, 65).
Most of China’s market has developed in recent years on commercial terms,
mainly in the northwestern provinces and autonomous regions of Qinghai,
Xinjiang, Tibet, Inner Mongolia, and Gansu. In these isolated regions, a fairly
developed solar industry and infrastructure now exist for installation, distribution,
and maintenance. For example, a thriving network of dealers line a solar street
in Xining—a dense concentration of stores selling a variety of solar and end-use
equipment. Nearly all sales are for cash in these well-developed commercial mar-
kets, although many households in poorer regions are only able to afford smaller
10–25 watt systems. A number ofsmall donor programs have helped tobuild these
markets (49, 66–69).
Like China, private dealers have provided most solar home systems in Kenya,
although the market was initially seeded by donor programs in the 1980s. “Donor
programs allowed PV modules and system components to become known and
available in Kenya and provided a basis for the development of local capacities
30 Sep 2002 15:7 AR AR171-EG27-10.tex AR171-EG27-10.sgm LaTeX2e(2002/01/18) P1: IBC
RENEWABLE ENERGY MARKETS 317
in component assembly and in the installation, repair and maintenance of PV
systems” (23). Indeed, many of those trained through donor programs went on to
build the private industry that followed. This private market was also spurred by
an increasing supply of domestically produced components, which lowered costs,
and by the slow pace of rural electrification that increased demand for alternatives
like solar home systems (51, 70–74).
South Africa isan exampleofa volatile market, witha high numberof company
start-ups and closures.Beyond government programs, private sales have been slow
due to affordability constraints, a hugely successful grid extension program, and
consumer expectations of universal grid access (75–78).
BIOGAS FOR HOME LIGHTING AND COOKING Biogas digesters convert animal
and plant wastes into a fuel usable for lighting, heating, cooking, and electri-
city generation. Digesters can be household scale, or community scale shared by
many households. Biogas programs have been challenging because a variety of
technical options are needed. Community and political issues have also created
challenges, along with the need for rural sales and service businesses and con-
sumer credit. China, India, and Nepal have conducted the main biogas programs;
all three countries now have large manufacturing industries for biogas plants.
China leads the world with 7.5 million household biogas digesters installed
and another 750 large- and medium-scale industrial biogas plants. However, the
number of operational biogas plants may have declined considerably in the late
1990s. China’s extensive biogas programs began in the 1950s and reached peaks
in both 1960 and 1979. Inadequate education and training of households led to
technical failures and declining use subsequent to each new program. Since the
mid-1980s, however, a network of rural biogas service centers was established
to provide the infrastructure necessary to support dissemination, financing, and
maintenance (79–82).
India also has had a large program, with about 3 million household plants
installed. Initial efforts focused on technology development and increased user
awareness. Subsequent efforts trained grassroots-level engineers in technical and
managerial skills for constructionofbiogas plants. After five yearsof the program,
users became more familiar with biogas, and demand and acceptance increased.
Programs emphasized quality to ensure that biogas maintained a good reputation.
Still, up to 30% of installed systems were reportedly no longer operational. Prob-
lems have included lack of adherence to fuel specifications, frequent change of
operating personnel, unskilled operators, inadequate user training, and unrealistic
user expectations that suppliers should be responsible for all problems. Rural bio-
gas businesses and manufacturers have also lacked sufficient business skills and
finance to develop products and markets (65,83, 84).
The Nepal biogas program established over 35,000 biogas plants from 1992–
1998. Investment subsidies and affordable financing made biogas plants attractive
to small and lower-income farmers. A well-designed after-sales service program
30 Sep 2002 15:7 AR AR171-EG27-10.tex AR171-EG27-10.sgm LaTeX2e(2002/01/18) P1: IBC
318 MARTINOT ET AL.
and joint responsibility by owners, installers, and program staff led to excellent
operating performance.The program was also successfulbecause the biogasplants
were responsive to users’ needs and because users rather than manufacturers re-
ceived financial incentives (65,85). In sub-Saharan Africa, most of the existing
2400 biogas units were installed through donor and demonstration projects. How-
ever, these experiences were not replicated due to inadequate feedstocks, intensive
labor demand, high capital costs, poor technical performance, and lack of water
(86, 87).
VILLAGE-SCALE MINI-GRIDS Village-scale mini-grids can serve tens or hundreds
of households in settings where sufficient geographical density allows economical
interconnections to a central power generator. Traditionally, mini-grids in remote
areas and on islands have been powered by diesel generators or small hydro.
Generation from solar PV, wind, or biomass, often in hybrid combinations, can
replace or supplement diesel power in these grids (65,88, 89).
Most village-scale mini-grids have developed in Asia on the basis of small
hydro, particularly in China where more than 60,000 mini-grids exist, as well as
Nepal, India, Vietnam, and Sri Lanka, each with 100–1000 mini-grids. In China,
most mini-grids have resulted from government programs. More recently, rural
entrepreneurs have built and run small hydro stations by borrowing from agricul-
tural banks;revenuefrom justthree yearsof electricitysales isapparently sufficient
to repay such loans (48, 66,90, 91). Standardization of the industry has also facil-
itated interconnection of multiple stations into county-level grids. In Nepal, most
mini-grids have been installed and managed by rural entrepreneurs. This Nepali
entrepreneurial success story of the 1980s and 1990s has been attributed to several
factors, including availability of credit from a public-sector agricultural develop-
mentbank, simplifiedlicensingprocedures toreduce transactioncosts,unrestricted
power tariffs, private financing from commercial banks, and capital cost subsidies
from the government. Also, technical assistance by bilateral donors and NGOs led
to technology development and manufacturing within Nepal’s industrial base (92).
Very few hybrid mini-grids employing combinations of solar PV, wind, and
diesel exist, perhaps on the order of 150 systems in developing countries. Such
systems are still not yet economically competitive with conventional diesel power
and must be financed at least partly with government or donor funds. China’s
roughly 80 PV/wind/diesel mini-grids (about half of which are PV-only systems),
sized 10–200kW,are installedmostly onislandsalongthecoast andin thenorthern
and western remote regions. In India, nine PV mini-grids (most 25 kW) and two
biomass mini-grids serve 35 villages in West Bengal (48, 66, 69, 89–91).
HOUSEHOLD-SCALE WIND POWER Household-scale wind power (sized 100–
5000 watts) has been piloted in a few countries, with most installations world-
wide taking place in Inner Mongolia in China. Public programs were successful
in disseminating more than 140,000 small wind turbines for household energy in
this region. These programs were driven by local technology promotion agencies,
30 Sep 2002 15:7 AR AR171-EG27-10.tex AR171-EG27-10.sgm LaTeX2e(2002/01/18) P1: IBC
RENEWABLE ENERGY MARKETS 319
development of local technology manufacturing, subsidies for purchase of locally
manufactured wind turbines, and a government revolving credit fund offering re-
payment tied to the harvest season or future sales of cattle or wool. Performance
of these systems has been good, except during the summer when winds drop and
system output dwindles. Many households, spurred by government programs and
demonstrations, are upgrading their systems with PV to complement the wind
resource and provide all-season power (89, 93).
Rural Small Industry, Agriculture, and Other Productive Uses
Although electricity provides improvements in the quality of life through light-
ing, entertainment, and increased conveniences, it is the productive uses of this
electricity that increase incomes and provide development benefits to rural areas.
As incomes increase, rural populations are better able to afford greater levels of
energy service, which can allow even greater use of renewable energy. The major
emerging productive uses of renewable energy are for agriculture, small industry,
commercial services, and socialserviceslike drinking water, education, and health
care (31, 65,94).
AGRICULTURAL WATER PUMPING Wind-drivenwaterpumpsforirrigationand live-
stock historically have played a prominent role in rural areas, but these declined
in the 1950s and 1960s as rural electrification and diesel-driven pumps took over
(95). A resurgence of interest inwindpumps in the 1970s and 1980sdidnot lead to
newlarge markets, however, with Argentina anotable exception.Between 500,000
and one million wind-powered water pumps arein use in Argentina, which follows
decadesof developmentof alocalmanufacturing baseforsmall windturbinesthere
(13, 28). Other notable use of wind-powered water pumps is occurring in South
Africa (100,000) and Namibia (30,000), with thousands more in Brazil, China,
Columbia, India, Peru, and Thailand. Growing interest in solar PV powered water
pumps (typical size 1 kW) has led to at least 20,000 installed, notably in India,
Ethiopia, Thailand, Mali, Philippines, and Morocco (31, 51, 84, 96–98). However,
many of the pumpsare not operating dueto poor maintenance andlack of technical
information. Biogas for water pumping shows promise in dual-fuel diesel/biogas
engines, but it was not adopted inIndiabecause government programsemphasized
biogas for residential cooking and lighting rather than water pumping (65). The
Philippine government did try a biogas power program in the 1980s, with more
than 300 gasifiers installed,but the program suffered from poor sustainability(33).
SMALL INDUSTRY Mini-grid or stand-alone systems can power small industries
and provide substantial local income and tens or hundreds of jobs. Indeed, com-
munities with small industry connected to mini-grids value the grid much more
highly than those with no industry. In fact, the economic viability of mini-grids
often depends on the presence of industry because household lighting by itself
may not provide the revenue base to pay for mini-grid investments (88). Examples
30 Sep 2002 15:7 AR AR171-EG27-10.tex AR171-EG27-10.sgm LaTeX2e(2002/01/18) P1: IBC
320 MARTINOT ET AL.
of applications exist, but not systematically: On one Philippine island, a wind-
solar-diesel hybrid provides 24-hour power for seaweed drying, woodworking,
and sewing; in West Bengal in India, small local enterprises such as a cycle repair
shop, a video cinema, and health clinics receive power from solar and biomass
village-scale mini grids; in ten remote fishing villages in Indonesia, wind turbines
power ice making to freeze fish, a chick hatching unit, corn grinding, and potable
water supplies; in South Africa, women weave mats at night using the light from
solar home systems; in Peru, carpenters and welders work off small hydro power;
and in Bangladesh, a TV repair shop uses a PV-powered soldering iron (99).
3
DRINKING WATER
Use of renewable energy to provide clean drinking water is
emergingasa potentialmajormarket.Applications includebothmechanicalpump-
ing/filtering and ultraviolet (UV) disinfection. In areas where commercialorpiped
water is unavailable, villagers may walk several hours each day to obtain drinking
water, or they may use hand pumps. Few examples of renewable applications yet
exist. One example is in the Dominican Republic, where eight PV-powered village
water systems provide daily water service to about 1000 people. The cost of this
water over the system lifetime was estimated at about 1.5 cents/gallon, compared
to 2.5 cents/gallon for water delivered by private truck in large drums. Users pay
for water on a per-gallon basis and prefer the service to existing water supplies.
Another example is in Swaziland, also based on per-liter fees and run by a village
committee (51).
Other scattered examples of productive uses are emerging, albeit slowly and
anecdotally.Longer retailshophoursarecited inafewcountriesas anincomeeffect
from solar PV; studies from Namibia and Bangladesh show solar-electrified retail
stores operating for longer hours and generating higher incomes than unelectrified
stores (99,100). The organization Greenstar is developing “solar community cen-
ters” in villages with lighting, satellite links, computers, and video equipment to
allowsalesoflocal musicandcraftsoverthe internet.Otherexamplesincludepaper
making, building materials, wood and metalworking, drip irrigation, greenhouses,
electric livestock fences, sewing, distance education, and vaccine refrigeration.
Grid-Based Power Generation
Total world electric power capacity stood at 3,400,000 MW in 2000, with about
1,500,000 MW(45%) of thisin developing countries(see Table2). Electricity con-
sumption indevelopingcountries continuesto grow rapidlywith economicgrowth,
which raises concerns about how these countries will expand power generation in
coming decades. According to some estimates, developing countries will need to
more than double their current generation capacity by 2020 (101). Traditional op-
tions, such as coal and large hydro, have environmental and social repercussions
that have increasingly taken on serious political and economic undertones.
3
These and other examples can be found at , ,
and .
30 Sep 2002 15:7 AR AR171-EG27-10.tex AR171-EG27-10.sgm LaTeX2e(2002/01/18) P1: IBC
RENEWABLE ENERGY MARKETS 321
TABLE 2 Renewable grid-based electricity generation capacity installed as of 2000
(megawatts)
a
Developing
Technology All countries countries
Total world electric power capacity 3,400,000 1,500,000
Large hydropower 680,000 260,000
Small hydropower
b
43,000 25,000
Biomass power
c
32,000 17,000
Wind power 18,000 1,700
Geothermal power 8,500 3,900
Solar thermal power 350 0
Solar photovoltaic power (grid) 250 0
Total renewable power capacity
d
102,000 48,000
a
Figures are authors’ estimates based on tabulations of country-level statistics from sources cited in this section,
general statistics (5, 13,50,101, 112), and unpublished sources. Similar figures used in the G8 Renewable Energy
Task Force report (46) were preliminary versions supplied by Martinot of the updated figures here.
b
Small hydro is usually defined as 10 MW or less; the definition varies by country and sometimes extends to 30 MW.
c
Biomass figures omit electricity from municipal solid waste and landfill gas; commonly, biomass and waste are
reported together.
d
Excludes large hydropower.
Small hydro power, biomass power, geothermal power, and wind farms are all
competitive and viable technologies for grid-based power generation (5, 13,102).
Grid-connected installations can range in size from a few kilowatts to hundreds
of megawatts. Given the right geographic resources and regional-specific costs of
competing fuels, many of these technologies can produce electricity at costs com-
petitive with conventional forms of electric power. If environmental externalities
are factored into the market prices of competing fuels, a process which is still rare,
then grid-based renewable energy becomes even more competitive.
SMALL HYDROPOWER Small hydropower harnesses small rivers and streams, typ-
ically with plants less than 10 MW size. Small hydropower has been a mainstay of
rural energy development for many years in many countries. About 43,000 MW
of small hydro are installed worldwide, about 60% in developing countries. China
alone accounts for 21,000 MW of that capacity, driven by long-standing govern-
ment rural electrification programs (13, 66,68, 103).
BIOMASS POWER Biomass power technologies are diverse (17, 104). The most
common is direct combustion of biomass feedstocks to produce power and often
cogenerate heat. Others include anaerobic digestion, which produces biogas for
use in engines, and gasification, which produces gas for use in combined-cycle
gas turbines. In developing countries, most applications are direct combustion and
30 Sep 2002 15:7 AR AR171-EG27-10.tex AR171-EG27-10.sgm LaTeX2e(2002/01/18) P1: IBC
322 MARTINOT ET AL.
biogas, although a few gasification plants in sizes up to 200 kW are operating in
India, China, and Indonesia (105). Most biomass feedstocks come from agricul-
tural and forest industry residues (i.e., pulp and paper, sugarcane, rice husks, and
vegetable oils). Sugarcane waste, or “bagasse,” is especially common in tropical
countries.Powergenerationfrombiomassisroughly32,000 MWworldwide,about
half in developing countries. Brazil and the Philippines are the leading producers
of biomass power (50,103).
WIND POWER Wind power is generated by clusters of wind turbines, typically
each 100–1500 kW in size, connected into wind farms. Wind power is now the
fastest growing energy technologyin the world. Totalinstalledcapacity worldwide
stood at 18,000 MW in 2000, about 10% in developing countries. Global wind
power capacity grew by more than 4,000 MW in the year 2000 alone. India, with
1,300 MW of installed capacity, leads the developing world. Starting with only
50 MW in 1993, India experienced a boom in wind power development during
the 1990s, driven by special tax policies that allowed private power developers
to recover the full investment costs of wind farms in the first year of operation
(accelerated depreciation). However, these investment-based incentives have not
encouraged high operating performance, and declining investment tax credits and
changing utility policies moderated growth in the late 1990s. China is the second
major market for wind power, with over 350 MW, mostly through a series of small
projects with bilateral donor grants or concessional finance (106–110).
GEOTHERMAL POWER Geothermal power can be generated from hot water or
steam captured fromreservoirs belowthesurface of the earth.This power sourceis
expanding inIndonesia, Philippines, Mexico, Kenya, and Central America.Global
electricity generating capacity from geothermal stands at 8,500 megawatts, about
45% in developing countries (111).
Most grid-connected technologies, such as small hydro, biomass, and geother-
mal, are relatively straightforward and easily produced in a number of developing
countries. Wind power technologies, however, are a rapidly evolving and high-
technology product. Both India and China have been developing their own wind
power industries. In India, over 30 domestic wind turbine manufacturers emerged
in the 1990s, many of them joint ventures with foreign partners. After an indus-
try shakeout, only 15 firms remained, but production capacity increased to 500
MW/year, or almost 15% of global production. Exports of components and whole
turbines began in the 1990s as firms began to produce advanced turbine designs
with variable-speed operation. The growth of the domestic industry was fueled
by the government’s aggressive wind power development incentives, concessional
financing for wind power developers, and exemptions and concessions on import
duties for wind turbine components (84, 108,113, 114).
China has also been developing advanced wind turbine technology, both to en-
sure self-sufficiency and to lower costs. In the 1990s, several Chinese companies
began to produce large-scale (200–300 kW) wind turbines as well, either as joint
30 Sep 2002 15:7 AR AR171-EG27-10.tex AR171-EG27-10.sgm LaTeX2e(2002/01/18) P1: IBC
RENEWABLE ENERGY MARKETS 323
ventures or under license to foreign companies. Demand for these turbines de-
clined, however, as imported 600 kW and larger units became more cost-effective
and offered higher quality. In 1998, one Chinese firm purchased a license from
a German manufacturer for an advanced 600 kW turbine design and became the
first Chinese company to commercially manufacture this size turbine with mostly
Chinese components. To further promote domestic manufacturing, the Chinese
government has required that all new wind farms contain at least 40% local com-
ponents (106, 109). China already had a thriving domestic industry of small wind
turbine manufacturers as a result of market development programs in Inner Mon-
golia for household-scale wind power applications (93,109, 115).
Residential and Commercial Cooking and Hot Water
Residential and commercial cooking and hot water in rural areas of developing
countries are supplied primarily by direct combustion of biomass—in the form of
wood, crop wastes, dung, and charcoal. In recent decades, the alarming decline
in forest resources in many countries called attention to more efficient household
use of biomass, as well as solar cookers. Driven by public programs, household
demand, and declining resources, markets for more efficient biomass stoves and
solar cookers are found primarily in Asia and Africa, where resource constraints
are greatest. In Latin America, resources are more plentiful and depletion less an
issue (3, 4,11, 104).
4
Since 1980, many donor programs have developed and disseminated new tech-
nologiesfor efficient biomasscookstovesin developing countries,withcloseto 220
million improved biomass stoves disseminated (4,8, 117,118). The largest pro-
gram is in China, where between 1982 and 1999, the Chinese National Improved
Stoves Program disseminated 180 million improved biomass stoves (79, 82). This
program established local energy offices to provide training, service, installation
support, and program monitoring. It also fostered self-sustaining rural energy en-
terprises that manufactured, installed, and serviced the stoves. Users paid the full
direct costsofthe stoves (about$10), and government subsidieswere limited to the
indirect costs of supporting the enterprises. A parallel program in India initiated
in 1983 resulted in more than 30 million improved stoves by 2000, through a cen-
tralized government program that subsidized half the cost of the stoves. Surveys
suggest that only one third of the stoves in the India program are still being used.
Reasons cited for the lack of sustained use were that stoves did not save energy,
broke down, and were poorly constructed (4, 84).
In Africa in the 1990s, over 3 million improved biomass stoves were dissemi-
nated. Markets and technology adoption have proven easier for reducing charcoal
4
Improved stoves and solar cookers have been fashionable strategies to address fuelwood
scarcity. But they are actually coping rather than mitigation strategies. Earlier notions that
household biomassuse causes deforestationhave beenlargelydiscredited, giving way to the
realization thathousehold biomassscarcities result from deforestation due to forestclearing
for cultivation, timber sales, and commercial charcoal production (4, 11,116).
30 Sep 2002 15:7 AR AR171-EG27-10.tex AR171-EG27-10.sgm LaTeX2e(2002/01/18) P1: IBC
324 MARTINOT ET AL.
consumption (as opposed to wood), and for urban markets to save purchased fuel
(as opposed to saving collected fuel). Kenya has led this market, with close to
one million improved stoves in that country alone. The Kenya ceramic jiko (KCJ)
has been the most widely disseminated of all improved biomass stoves, notably
with 90,000 stoves sold through private firms. The KCJ success is partly attributed
to a piggyback strategy used for marketing and distributing stoves through exist-
ing sales networks. The KCJ has been replicated in Uganda, Rwanda, Tanzania,
Ethiopia, Sudan, and Malawi (4, 87, 117, 119–121).
Solar cookers have also been disseminated in various countries. There were
more than 800,000 solar cookers installed in developing countries in 2000, mostly
in India and China. The solar box cooker has been the most effective, promoted in
India throughthe AllIndiaWomen’s Conference.Cookbooks forboxcookers have
even been published. However, few real markets exist; most cookers have been
provided free of charge or at subsidized prices through donor programs (65, 84).
Hot water for residential and commercial uses, both in rural and urban areas,
can be provided cost-effectively by solar hot water heaters in many regions. An
estimated 15 million domestic solar hot water collectors are installed worldwide,
about two thirds of them in developing countries. China’s solar hot water in-
dustry has mushroomed in the 1990s, with growth rates of 10%–20% and up to
10 million households now served with solar hot water (48, 122). (Households
must be estimated from square-meter installation statistics. We used a range of
1.5–3 m
2
/household depending on the country.) Markets with hundreds of thou-
sands of households served include Egypt, India, and Turkey. In India, investment
tax policies providing accelerated depreciation, together with low-interest loans,
have stimulated a large market for commercial and public facility installations,
which morethan tripledfrom 1990to 2000.Other emerging marketsareBotswana,
Kenya, Lesotho, Mauritius, Morocco, Namibia, Papua New Guinea, South Africa,
Tanzania, Tunisia, and Zimbabwe (13, 28). Some markets have been driven by
government requirements; for example, solar hot water heaters were required with
new construction of government-owned housing in Namibia (123). Lack of con-
sumer credit, supply and service networks, quality standards, and business finance
have hindered solar hot water markets.
Transport Fuels
Biomass-derived liquid fuels power motor vehicles in Brazil, Kenya, Malawi,
and Zimbabwe. Two separate applications exist, one in which ethanol powers
specially designed vehicles that run on pure ethanol and another in which ethanol
is mixed with gasoline or diesel fuel to produce “gasohol” for use in ordinary
vehicles. Market issues relate to ethanol production efficiency, cost competition
with gasoline, the commercial viability and costs of specially designed ethanol-
only vehicles, fuel distribution infrastructure, and ratios of ethanol to gasoline in
gasohol blending. Global annual ethanol production from biomass is estimated at
18 billion liters, 80% of which is in Brazil (13).
30 Sep 2002 15:7 AR AR171-EG27-10.tex AR171-EG27-10.sgm LaTeX2e(2002/01/18) P1: IBC
RENEWABLE ENERGY MARKETS 325
The commercial viability of converting sugarcane to ethanol for motor vehicles
has been demonstrated in the ProAlcool program in Brazil (13, 25, 32, 124, 125).
Today, more than 60% of Brazil’s sugarcane production goes to produce ethanol.
Technological advances have continued to improve the economic competitiveness
of ethanol and gasohol relative to conventional gasoline, although the price of oil
and competitive forces in global automotive technology greatly affect ethanol’s
prospects.
5
In 2000, over 40% of automobile fuel consumption and 20% of total
motor vehicle fuel consumption in Brazil was ethanol, displacing the equivalent
of 220,000 barrels of oil per day. According to one estimate, about US$140 billion
would have been added to Brazil’s foreign debt if ethanol had not been used as
a fuel over the past 25 years, although this significant benefit has gone largely
unreported and unnoticed by policy makers (32).
Brazil’s policies mandate the blending of ethanol with all gasoline sold in the
country andalso requirethat allgasstations sellpure ethanol.This lastrequirement
made it commercially viable for the automotive industry to produce ethanol-only
cars as early as 1980. In the scale-up phase of the program, the share of ethanol-
only cars as a share of total car sales rose steadily from 27% in 1980 to 96%
in 1985. However, by 1989 the sales share had declined to 51%, triggered by a
temporary ethanol shortage. Ethanol use continued to decline in the 1990s, and
by 2000 sales had declined to around 10,000 ethanol-only vehicles—compared to
more than 800,000 in 1987. These declines were due in part to political uncer-
tainties, lack of attention from policy makers, ethanol producers, and automobile
manufacturers to the program, declining oil prices which made ethanol less com-
petitive, and lack of confidence in supply. More recently, the annual decline in
consumption of ethanol, as ethanol-only vehicles are retired from service and not
replaced, has been balanced by significant growth in the number of vehicles using
gasohol.
The ProAlcool program demonstrated cost reductions and economies of scale
in ethanol production technologies, which achieved improvement in ethanol yield
by factors of two or three from a given acreage of sugarcane. It also brought
about policy changes in sugarcane pricing (from being based on weight to being
based on sucrose, or energy, content) that changed the composition of the sugar-
cane crop and made ethanol productioneven more effective. Potential productivity
improvements of 20% or more are still possible (126). Early government subsi-
dies for ethanol production declined significantly but were not fully eliminated.
5
Disagreementhas existed about thecommercialviabilityofethanol fuels withoutsubsidies,
with past analyses showing higher costs for ethanol relative to gasoline (14). Significant
progress in technology and management of ethanol production occurred in the late 1990s.
Although oil prices declined during much of this period, ethanol production costs also
declined. In many parts of Brazil, ethanol subsidies have now been entirely eliminated and
some retail ethanol prices are almost half those of gasoline. Other countries are moving to
ethanol vehicle fuels, including India, Japan, and Thailand. Growing interest in fuel cells
could also stimulate ethanol demand.
30 Sep 2002 15:7 AR AR171-EG27-10.tex AR171-EG27-10.sgm LaTeX2e(2002/01/18) P1: IBC
326 MARTINOT ET AL.
Because some ethanol production is not competitive with gasoline at lower oil-
price levels, the viability of the ethanol market continues to depend on subsidies,
further efficiency improvements, and the economic value placed on externalities
of fossil-fuel use. Future markets appear to favor use of gasohol rather than pure
ethanol.
In Africa, ethanol is produced in Kenya, Malawi, and Zimbabwe for blending
with gasoline (87). Zimbabwe is the only one of the three, however, to mandate
that ethanol be blended with all gasoline sold. Due to its recent economic crisis,
Zimbabwe increased the proportion of ethanol in gasohol to counter gasoline
shortages. In Kenya, a gasohol plant continued to operate, but with annual fi-
nancial losses due to government controlled retail prices (since liberalized), in-
adequate plant maintenance and operation, resistance from local subsidiaries of
multinational oil companies, and unfavorable exchange rates that increased costs
of servicing foreign loans (120). As in Brazil, in these countries ethanol markets
have saved foreign exchange that would otherwise be needed to import gasoline.
EMERGING LESSONS
Impacts on Rural Development
After decades of renewable energy programs and investments in rural areas of
developing countries, relatively little is known about the ability of renewables to
deliver services that will raise incomes and provide other social benefits. Certainly
there are social benefits from lighting, TV, and radio powered by solar home
systems, mini-grids, and biogas, and even some economic benefits from reduced
kerosene and candle use. Biogas for cooking and improved biomass stoves may
also reduce expenditures for fuel wood, either in time or money, as well as create
jobs. A clear result of the Nepal biogas program is that women spend less time and
labor for fuelwood collection and cooking. In China, however, the direct financial
benefits of biogas to households, beyond the social benefits of lighting, are not
as clear. On balance, the literature does not offer a strong case that large rural
development benefits have occurred from renewable energy (2,31, 85,87, 127).
Most insight on the economic benefits of rural electricity comes from literature
on rural electrification through extension of central power grids. Studies clearly
show the consumptive benefits and improvements in quality of lifethrough electri-
fication (2,127, 128).For example,a study inNamibiaindicates that electrification
has improved household welfare, but almost exclusively as a consequence of elec-
tric lighting. Access to high-quality light is the majorchangereported, particularly
the ability to study in the evenings (100, 129). But where rural electrification took
place without other supporting economic infrastructure and skills, as happened
in many development projects, productive economic development did not follow,
acknowledgedboth the WorldBank and theGerman aid agency GTZ (11,26, 130).
The few examples mentioned earlier of rural small industry, agriculture, and
other productive uses powered by renewable energy offer some promise of
30 Sep 2002 15:7 AR AR171-EG27-10.tex AR171-EG27-10.sgm LaTeX2e(2002/01/18) P1: IBC
RENEWABLE ENERGY MARKETS 327
economic and development benefits. However, as just noted, economic benefits
depend not just on the availability of energy but also on other conditions favoring
small business in rural areas, such as access to markets, finance, communications,
education, and health care. That is, economic benefits from rural renewable en-
ergy are more likely in areas where economic development is already taking place.
Further, those who most benefit from the availability of energy are those who can
afford the electrical equipment and other infrastructure needed to convert energy
into useful services and productive activity (26, 127,130).
There is little question that solar home and solar community systems provide
benefits that increase household welfare and quality of life, which include im-
proved lighting for children’s education, adult study, evening cottage industry, as
well as television and radio. Anecdotal evidence suggests that demand for tele-
vision has been a major driver of some markets (with soccer often mentioned).
Distance education via television is also cited for subjects like farming, health
care, and language. But little research has measured or quantified these benefits.
“So far, there is little evidence that SHS have an impact on poverty alleviation”
wrote GTZ in a review of its experience (27). In fact, GTZ concluded that rural
households do not buy solar home systems for reduced energy costs, but rather
for improved services like longer TV viewing and better lighting quality. Other
anecdotal evidence supports this view of increased services rather than decreased
costs: Some households continue to use kerosene for lighting so that the electricity
from solar home systems can be conserved for television viewing.
Research is emerging slowly. In Inner Mongolia, a socioeconomic assessment
of small household-scale wind turbines found that households bought appliances
such as refrigerators, washing machines, rice cookers, irons, andelectric heaters to
improve living conditions and save time, particularly for women. The study found
that television and radio provide language instruction and information on com-
modity prices, weather, and new farming methods and practices. Electricity also
increased income-generating activities, adding up to $30–$150/month to incomes
(131). In Bangladesh, Grameen Shakti reports that community solar-powered cell
phones, operated primarily by local women villagers in their homes, produce up
to $200/month in revenue for the operators. Villagers appear willing to pay per-
minute connection charges for calls because of the financial benefits from learning
about commodity prices, exchange rates, market trends, and from verifying cash
deliveries made by relatives (64, 99).
On balance, it is not clear how welfare and quality of life benefits will drive
demand for renewable energy systems beyond the wealthiest rural households.
“Acquisition of SHS is often a lower priority for rural households than other ba-
sic needs and commodities; only after these other needs have been met do solar
home systemsbecome anoption,” whichlimits demandfor consumerapplications,
wrote GTZ (27). We hypothesize that applications of renewable energy that pro-
vide income generation and social benefits, such as clean drinking water, cottage
industry, distance education, and improved agricultural productivity, will appeal
to increasing segments of rural populations (31).
30 Sep 2002 15:7 AR AR171-EG27-10.tex AR171-EG27-10.sgm LaTeX2e(2002/01/18) P1: IBC
328 MARTINOT ET AL.
Lessons suggested by experience are that: (a) Social benefits and quality of
life, rather than income and economic benefits, have driven markets for renewable
energy in rural areas; (b) experience with productive uses of renewable energy is
still in its infancy and deserves much greater attention from donors, development
agencies, andgovernments; (c) economicbenefits from renewables are morelikely
in rural areas that are already undergoing development and can incorporate the
additional energy dimension into existing development activities for water, health,
education, agriculture, and entrepreneurship; and (d) published studies of income
generation and economic benefits from renewable energy are still limited and call
for further research.
Affordability, Consumer Credit, and Sales Versus Rentals
Inthe ruralenergyand development literature,muchhas beenmade ofaffordability
of rural household systems such as solar home systems, biogas digesters, and
improved biomass stoves. For example, many argue that households can afford to
substitutesolar homesystemsforcandles andkerosenelightingifthe monthlycosts
for each are comparable (11, 53,54). Based on affordability analyses, some donor
programs for solar home systems began by offering large 100-watt sizes. Donors
soon foundthese sizes tooexpensive for ruralhouseholds and decreasedsizes to 50
watts and even to 20 watts (40). This small-size approach to affordability also has
occurred in the private markets in Kenya, Morocco, and China, where households
often buy very small systems (i.e., 10–15 watts). In these cash markets, smaller
systems may represent up to 80% of the market (27,51). Even so, most buyers are
among the wealthiest households in rural areas. Some households upgrade later to
larger systems when they can afford them.
Consumer credit is another approach to affordability. Credit may be provided
either by vendors themselves, by rural development banks, or by microcredit or-
ganizations (132). The Grameen Bank in Bangladesh is perhaps the best known
and analyzed example of a microcredit organization, with many success stories
(133). But some people question how relevant microcredit models are to consumer
purchases like solar home systems. Consumer loans do not fit the traditional mi-
crocredit lending models, which tend to provide short-term (i.e., one-year) finance
for income-producing activities only. “Most microfinance institutions and pro-
grams that deliver financial services to the low-income population do not fit the
requirements of SHS finance,” said GTZ (27). Reasons include credit size, depen-
dence on savings (which in turn result from income generating activities), pay-
ment frequency, group-based lending, focus on women, and short lending terms
(42, 64). In addition, microcredit organizations themselves need credit from banks
or donors; the success of the Grameen Bank partly rests on early infusions of
donor aid.
Fournotableexamplesofconsumercreditforsolarhomesystemshaveemerged.
In Bangladesh, Grameen Shakti, a nonprofit vendor, has offered consumer credit
for terms up to 3 years with 15–25% downpayment (39,64, 99). The Vietnam
30 Sep 2002 15:7 AR AR171-EG27-10.tex AR171-EG27-10.sgm LaTeX2e(2002/01/18) P1: IBC
RENEWABLE ENERGY MARKETS 329
Women’s Union offered similar credit terms for systems sold by a private vendor
in Vietnam (134). In Sri Lanka, Sarvodaya, a national microfinance organization,
has offered 2- to 5-year credit with 20%–25% downpayment for purchases from
any of three private vendors in that market (39, 43, 135). In Zimbabwe, vendors
sold several thousand systems on credit provided by the Agricultural Finance
Corporation.
6
The total number of systems sold for credit under these four cases is
approaching 25,000,still small comparedto the boomingcash markets incountries
such as Kenya, Morocco, and China.
In India, urban businesses were offered government incentives to provide credit
toruralhouseholdsforsolarhome systems,butthe businessesprovedtooconcerned
about householdcreditworthiness andthe transactioncosts ofloans andcollections
to act.Attentionhasturnedto India’s well-developed network ofrural development
banks and financing institutions, but these organizations first needed to become
familiar with solar technologies, sometimes through direct demonstrations, and
convinced that such loans are viable (134, 136).
The prospects for consumer credit are very specific to cultural, legal, and finan-
cial factors in each country. The Sri Lanka microcredit model appears sustainable
but perhaps only because Sri Lanka has a strong and long-standing microfinance
culture and set of institutions in rural areas, along with a well-developed com-
mercial banking system. Still, banks have lent capital to only one microfinance
organization, through a World Bank/Global Environment Facility (GEF) project,
but have not deemed other microfinanciers creditworthy (39,43, 57). In China,
credit is an unfamiliar concept in rural areas, and the few experiments with rural
credit have not yet been successful (67,137). Credit in rural areas of Kenya is also
minimal, but some solar PV purchases with credit are emerging, partly due to the
interest of the Kenya Commercial Bank.
Another approach to affordability that is receiving much attention is the rental
model. Typically, an energy service company supplies households withsolarhome
systems for a flat monthly fee, which sometimes includes lights or other end uses.
Under this arrangement, called “fee-for-service,” the company retains ownership
and provides maintenance. Monthly fees for a 50-watt system might be $15–$20
equivalent. However, rental models are employed in only three countries so far:
In the Dominican Republic, the firm Soluz Dominicana has installed 2000 rental
systems and is attempting to develop a viable business model (39,58); in South
Africa, Shell has installed 6000 rental systems (75, 78,138); and a utility company
in Argentina has installed 700 rental systems (39,139). The Argentina and South
Africa cases are a variation of the rental model called “concessions” (63). With a
concession, the government selects one company to exclusively serve a specific
geographic region, with an obligation to serve all who ask. The government also
provides subsidies and regulates the fees and operations of the concession.
6
Mulugetta et al. (62) question the effects of the credit provided in Zimbabwe. They argue
some households went beyond their means in borrowing because solar home systems were
perceived as a status symbol.
30 Sep 2002 15:7 AR AR171-EG27-10.tex AR171-EG27-10.sgm LaTeX2e(2002/01/18) P1: IBC
330 MARTINOT ET AL.
An ongoing debate is whether sales or rental models ultimately will prevail
in rural markets. Some argue that rental models provide greater affordability to
rural households because large capital purchases are not necessary. Others cite the
difficultiesofrentalbusinesses,particularlythecostsofmonthlyfeecollectionsand
the needto own largecapital assets(26, 39,63). There maybe anatural progression
from cash to credit/rentals in the evolution of a given market; some analyses
estimate that up to 10% of rural households will pay cash and that once the cash
market expands, larger but poorer segments of rural areas, perhaps up to 50%, will
be able to afford credit or rentals (26,60).
Lessons suggested by experience are that: (a) Historically, affordability of rural
energy has been addressed through government subsidies, donor programs, and
private cash sales of small systems; (b) new approaches to affordability are emerg-
ing, including vendor-supplied credit, microcredit, and rental models but are still
largely untested; (c) credit risk is a serious concern of both financiers and dealers
and makes credit sales challenging; (d) lower income rural households will need
long-term credit or rental options; (e) even with credit or rentals, lower income
groups will only benefitwith targeted policies, includingsubsidy policies, justified
by development goals.
Equipment Subsidies and Market Distortions
Subsidies for renewable energy equipment have been driven by three interwoven
factors: (a) donors using equipment installation as a visible and politically viable
approach to development aid (particularly “tied aid” that requires the equipment
to come from the donor country); (b) the need for subsidies to build market vol-
ume on the premise that costs will decline as volume increases, due to economies
of scale and learning; and (c) government goals for addressing poverty and eco-
nomic development in rural areas. Many expect renewable energy to compete with
conventional fuels with few subsidies and also expect it to alleviate poverty—a
heavy burden. Renewables must also compete against many hidden subsidies for
conventional fuels—everything from subsidized kerosene and coal to government
investmentsinpowergridextensions notrecovered byelectricity rates. Many stud-
ies have lamented that if renewable energy received the same subsidies as fossil
fuels and grid extensions, it would be more widely adopted (25, 45,140). For ex-
ample, biogas-powered water pumps for agriculture have been hindered in India
due to subsidized rural electricity, free electric connections to water pumps, and
subsidies for diesel fuel (65).
One important lesson emerging is that donations without any cost recovery
destroy markets. Despite bad experiences with the unsustained use of donated
renewable energy equipment in developing countries, donors are still undermining
markets with large capital cost subsidies and donated equipment (141–143). An
executiveof Shell,remarkingonIndonesia,notedthatsubsidies hadleftthatmarket
in disarray: “after only five years, most of the state-financed photovoltaic facilities
are damaged People don’ttake care of thingsthat they get forfree” (144). This
30 Sep 2002 15:7 AR AR171-EG27-10.tex AR171-EG27-10.sgm LaTeX2e(2002/01/18) P1: IBC
RENEWABLE ENERGY MARKETS 331
is symptomatic of the earliest donor projects, which simply provided equipment
and left users on their own. Later came donor projects that still provided free
equipment, but these also set up sustainable schemes for collecting small user fees
to pay for ongoing maintenance and spare parts. However, such an approach is not
replicable. Without moredonor assistance,no moresystems canbeinstalled. Some
donors have claimed that feescharged in some projects are setaside into long-term
revolving funds to pay for future purchases, but most fees appear adequate only to
pay for maintenance and component replacements (27, 63,145).
Another problem is that these approaches can inhibit commercial markets be-
cause consumers come to expect more donor aid and will wait rather than pay
market prices (142). Donor projects are still valuable—they can help familiarize
governments with technologies and demonstrate market viability. But in doing
so, donors need to understand existing private activities. In a recent example in
Namibia, donorsubsidies undermineda nationalprogram to develop thelocal solar
home systemindustry,which featured arevolvinglow-interest consumerloan fund
administered by a commercial bank. Households were unhappy about taking these
loans because two neighboring villages were receiving free equipment through a
donor program (146).
In China, bilateral donors have provided concessional loans for wind power
projects. One example is Denmark’s provision of zero-interest loans to Danish tur-
bine manufacturers to gain access to the Chinese market. Such loans have helped
the Chinese wind sector in the short run by facilitating installations. But over the
long run, a commercial market is stifled because installations remain limited to
those obtainingconcessionalfinance. So far, onlya handful of windpower projects
have occurred on a commercial basis, despite the great interest of both domestic
and foreign private developers. Continued donor-subsidized equipment has cre-
ated perceptions among utilities that wind power is not commercial and requires
continued donor aid. In fact, lack of commercial competition has contributed to
higher wind power purchase prices, which further reinforcesperceptionsthat wind
power is too expensive (106,109,147).
Most recently, the use of “smart subsidies” has been advocated (141). These
subsidies exist only for a limited program duration and are supposed to be self
eliminating. The theory is that subsidized investments and business development
eventuallylowertransaction andtechnologycosts, throughlearningandeconomies
of scale, to a point where subsidies become unnecessary. Smart subsidies also im-
ply payments based on operational performance,ratherthan on capital investment.
This was the case in the Nepal biogas program, where subsidy payments to indi-
vidual projects were based on operational milestones over periods of up to three
years (85). The Nepal program also set subsidies inversely related to income. Re-
cent renewable energy projects utilizing grants from the GEF have adopted these
approaches (41, 88,139).
Lessons suggested by experience are that: (a) Subsidies are unlikely to lead
to sustainable markets unless they explicitly create the conditions whereby they
are no longer needed (i.e., smart subsidies); (b) subsidies can undermine private
30 Sep 2002 15:7 AR AR171-EG27-10.tex AR171-EG27-10.sgm LaTeX2e(2002/01/18) P1: IBC
332 MARTINOT ET AL.
investments and business in new markets and should be applied with attention to
private-sector conditions in a particular market; (c) subsidies can be used effec-
tivelyto build upinitialmarketvolume,local expertise, userawareness,appropriate
technology adaptation, quality standards, and entrepreneurial activities; (d) subsi-
dies are more effective when tied to operating performance rather than investment;
and (e) continuing subsidies may always be needed for poorer segments of the
population.
Rural Enterprise Development, Financing,
and Business Viability
Rural entrepreneurship is neglected in much of the literature on rural renewable
energy in developing countries. The track record of donor programs in creating
and sustaining enterprises is particularly poor. No better illustration exists than
Zimbabwe, where dozens of enterprises entered the market in the mid-1990s in
response to a donor program but then went out of business after the program ended
(51, 62). If businesses are not viable, the sustained provision of after-sales service
suffers. Many households in Zimbabwe were left without local servicing once
these enterprises collapsed. Similarly in South Africa, many solar home systems
no longer work because maintenance service is not available, original equipment
suppliers left the market, and replacement components are unavailable (75–78).
“Most evaluations of solar home systems projects focus on technical performance
and economics, rather than evaluating the long-term viability and sustainability of
the business models and institutional dimensions,” said GTZ (27).
Some have estimated that tens of thousands of rural enterprises offering renew-
able energy-based products and services would be required to meet the needs of
hundreds of millions of households. The number of such enterprises today is in the
hundreds. The challenges are large: Entrepreneurs often face high business costs
in rural areas because of long travel distances, poor transport infrastructure, low
literacy rates, poor communications, and a lack of trained personnel. Fortunately,
promising approaches are emerging that support rural entrepreneurs with train-
ing, marketing, feasibility studies, business planning, management, financing, and
connections to banks and community organizations (39, 40, 43, 55, 99, 148–150).
These experiences highlight four key dimensions to rural entrepreneurship:
1. MARKETING Marketing can be challenging and expensive, especially in
dispersed rural areas where literacy is low. Grameen Shakti in Bangladesh,
for example, has found that the high costs of marketing and consumer ed-
ucation critically affect prospects for profitability (39, 99). Many are trying
innovative approaches. The Vietnam Women’s Union demonstrates solar
home systems at health camps. Sri Lanka vendors demonstrate products
at village fairs and community gatherings. Chinese vendors promote solar
lighting through testimonials read on the radio (134). An Indian vendor em-
ploys local technicians for marketing because they can speak customers’
local languages and best understand user concerns (151).
30 Sep 2002 15:7 AR AR171-EG27-10.tex AR171-EG27-10.sgm LaTeX2e(2002/01/18) P1: IBC
RENEWABLE ENERGY MARKETS 333
2. BUSINESS FINANCING The lack of rural business financing is often cited
as one of the primary factors hindering the development of markets. Credit
may be unavailable, too expensive, or too limited in time to be usable (75).
Entrepreneursfirstfaceone-time business developmentcosts, suchasmarket
surveys, personnel training, establishing sales and service networks, and
writing a business plan. Then they must convince a bank that the business
plan is sound—difficult if bankers lack familiarity with renewable energy
technology andapplications.Financial intermediaries mayhelp—if they can
package smaller loans into blocks of financing from larger banks and find
ways to mitigate risks.
3. BUNDLING RENEWABLE ENERGY WITH EXISTING PRODUCTS Costs may be
lower if vendors of existing products and services add renewable energy
to their activities—and use their existing networks of sales outlets, dealers,
and service personnel. Dealers of farm machinery, fertilizers, pumps, gen-
erators, batteries, kerosene, liquid propane gas (LPG), water, electronics,
telecommunications, and other rural services can bundle renewable energy
with these services. Of course, dealers must still develop new technical ex-
pertise and train their staff. Kenya is an example where market growth was
rapid because existing electronics and other retail businesses added solar
home systems to their offerings (71).
4. RURAL ELECTRIFICATION POLICY FRAMEWORK Experience also suggests
that rural electrification policies and planning have a major influence on
market growth and sustainability in specific locations. Unrealistic political
promises or plans for rural electric grid extension can be serious barriers
to solar-home-system market expansion because households expect to be
connected soon. Subsidies for kerosene also undermine markets. “Our main
competition is the false promise of the grid and kerosene, not other compa-
nies,” said one supplier in Sri Lanka when asked about competition (39).
Lessons suggestedby experienceare that: (a) Afew donorprograms have effec-
tively assisted rural renewable energy-based enterprises to build a sustainable and
viable business; (b) rural energy enterprises face a high-risk, low-margin business
with high transaction costs; (c) commercial banks and financial intermediaries
are key decision makers, who must understand the technologies and manage risks;
(d) demonstration of viable business models that eventually show sustainedprofits
for the enterprise is key to achieving market sustainability.
Policies and Financing for Private Power Producers
Ongoing power sector restructuring in many developing countries greatly affects
the prospects for grid-connected renewable energy. Six key trends occurring are
competitive wholesale power markets, self-generation by end users, smaller-scale
generation technologies, privatization and/or commercialization of utilities, un-
bundling of generation from transmission and distribution, and competitive retail