Báo cáo khoa học: "Comparison and Classification of Dialects" doc
Bạn đang xem bản rút gọn của tài liệu. Xem và tải ngay bản đầy đủ của tài liệu tại đây (295.41 KB, 2 trang )
Proceedings of EACL '99
Comparison and Classification of Dialects
John Nerbonne and Wilbert Heeringa and Peter Kleiweg
Alfa-informatica, BCN, University of Groningen
9700 AS Groningen, The Netherlands
{nerbonne, heeringa, kleiweg}@let, rug. nl
Abstract
This project measures and classifies lan-
guage variation. In contrast to earlier
dialectology, we seek a comprehensive
characterization of (potentially gradual)
differences between dialects, rather than
a geographic delineation of (discrete) fea-
tures of individual words or pronuncia-
tions. More general characterizations of
dialect differences then become available.
We measure phonetic (un)relatedness
between dialects using Levenshtein dis-
tance, and classify by clustering dis-
tances but also by analysis through mul-
tidimensional scaling.
1 Data
and Method
Data is from
Reeks Nederlands(ch)e Dialectat-
lassen
(Blancqua~rt and P6e, 1925 1982)). It con-
tains 1,956 Netherlandic and North Belgian tran-
scriptions of 141 sentences. We chose 104 dialects,
regularly scattered over the Dutch language area,
and 100 words which appear in each dialect text,
and which contain all vowels and consonants.
Comparison is based on Levenshtein distance,
a sequence-processing algorithm which speech
recognition has also used (Kruskal, 1983). It cal-
culates the "cost" of changing one word into an-
other using insertions, deletions and replacements.
L-distance (sl, s2) is the sum of the costs of the
cheapest set of operations changing sl to s2.
s~agIrl delete r 1
s~agIl replace I/0 2
saag¢l insert r 1
sarag¢l
Sum distance 4
The example above illustrates Levenstein distance
applied to Bostonian and standard American pro-
nunciations of
saw a girl.
Kessler (1995) applied
Levenshtein distance to Irish dialects. The ex-
ample simplifies our procedure for clarity: refine-
ments due to feature sensitivity are omitted. To
obtain the results below, costs are refined based
on phonetic feature overlap. Replacement costs
vary depending on the phones involved. Differ-
ent feature systems were tested; the results shown
are based on Hoppenbrouwers' (SPE-like) features
(Hoppenbrouwers and Hoppenbrouwers, 1988).
Comparing two dialects results in a sum of 100
word pair comparisons. Because longer words
tend to be separated by more distance than
shorter words, the distance of each word pair is
normalized by dividing it by the mean lengths
of the word pair. This results in a halfmatrix of
distances, to which (i) clustering may be applied
to CLASSIFY dialects (Aldenderfer and Blashfield,
1984); while (ii) multidimensional scaling may be
applied to extract the most significant dimensions
(Kruskal and Wish, 1978).
2 Results
We have validated the technique using cross-
validation on unseen Dutch dialect data (Ner-
bonne and Heeringa, 1999). The map in Fig-
ure 1 distinguishes Dutch "dialect area" in a way
which nonstatistical methods have been unable to
do (without resorting to subjective choices of dis-
tinguishing features). Ongoing work applies the
technique to questions of convergence/divergence
of dialects using dialect data from two different
periods. Finally, the MDS analysis gives math-
ematical form to the intuition of dialectologists
in Dutch (and other areas) that the material is
best viewed as a "continuum". The map is ob-
tained by interpreting MDS dimensions as col-
ors and mixing using inverse distance weighting.
Further information on the project is available at
x~r~. let. rug. nl/alfa/, "Projects."
3
Acknowledgements
Joseph Kruskal's advice has been invaluable.
281
Proceedings of EACL '99
Oost-Vli~
Hollum Nes ~ermon~koog
Renesse
• .L¢
late ',i q
,~ = ,
Kerkrade
Bael~
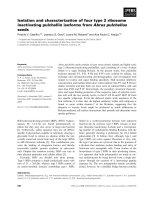
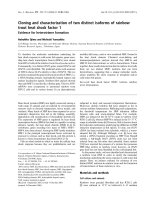
Figure 1: The most significant dimensions in average Levenshtein distance, as identified by multi-
dimensional scaling, are colored red, green and blue. The map gives form to the dialectologist's intuition
that dialects exist "on a continuum," within which, however significant differences emerges. The Frisian
dialects (blue), Saxon (dark green), Limburg (red), and Flemish (yellow-green) are clearly distinct.
References
Mark S. Aldenderfer and Roger K. Blashfield.
1984.
Cluster Analysis. Quantitative Applica-
tions in the Social Sciences. Sage, Beverly Hills.
E. Blancquaert and W. P@e. 1925-1982.
Reeks Nederlandse Dialectatlassen. De Sikkel,
Antwerpen.
Cor Hoppenbrouwers and Geer Hoppenbrouwers.
1988. De featurefrequentiemethode en de clas-
sificatie van nederlandse dialecten.
TABU: Bul-
letin voor TaaIwetensehap ,
18(2):51-92.
Brett Kessler. 1995. Computational dialectology
in Irish Gaelic. In
Proc. of the European ACL,
pages 60-67, Dublin.
Joseph Kruskal and Myron Wish. 1978.
Multidi-
mensional Scaling.
Sage, Beverly Hills.
Joseph Kruskal. 1983. An overview of sequence
comparison. In David Sankoff and Joseph
Kruskal, editors,
Time Warps, String Edits
and Macromolecules: The Theory and Practice
of Sequence Comparison,
pages 1-44. Addison-
Wesley, Reading, Mass.
-John Nerbonne and Wilbert Heeringa. 1999.
Computational comparison and classification of
dialects.
Zeitschrift fiir Dialektologie und Lin-
guistik.
Spec. iss. ed. by Jaap van Marie and Jan
Berens w. selections from 2nd Int'l Congress of
Dialectologists and Geolinguists, Amsterdam,
1997.
282