Global demand for wood products pptx
Bạn đang xem bản rút gọn của tài liệu. Xem và tải ngay bản đầy đủ của tài liệu tại đây (497.13 KB, 33 trang )
STATE OF THE WORLD’S FORESTS 2009
62
D
emandforwoodproductsisoneofthemain
driversofinvestmentinforestmanagement.
Althoughshort-termmarketchangesinuence
individualdecision-making,long-termchangesindemand
haveagreaterinuenceoninvestmentsinforestryand
forestindustryattheaggregatelevel.Thischapterprojects
someofthelong-termchangesinthedemandforwood
products(basedonFAO,2008c).
DRIVERS OF CHANGE
Themainfactorsaffectinglong-termglobaldemandfor
woodproductsinclude:
• Demographicchanges:theworld’spopulationis
projectedtoincreasefrom6.4billionin2005to
7.5billionin2020and8.2billionin2030.
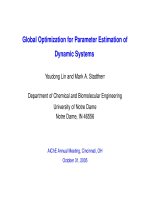
• Continuedeconomicgrowth:globalGDPincreased
fromaboutUS$16trillionin1970toUS$47trillion
in2005(at2005pricesandexchangerates)andis
projectedtogrowtoalmostUS$100trillionby2030
(Figure50).
• Regionalshifts:developedeconomiesaccounted
formostoftheGDPintheperiod1970–2005.The
rapidgrowthofdevelopingeconomies,especiallyin
Asia,willswingthebalancesignicantlyinthenext
25years.
• Environmentalpoliciesandregulations:moreforests
willbeexcludedfromwoodproduction.
• Energypolicies:theuseofbiomass,includingwood,
isincreasinglyencouraged.
Otherimportantfactorsinthewoodproductsoutlook
includeadeclineinharvestingfromnaturalforestsand
theemergenceofplantedforestsasthemajorsourceof
woodsupply(Box31),andtechnologicaldevelopments
suchasincreasedplantationproductivitythroughtree
improvement,reducedwoodrequirementsowingto
expandedrecycling,higherrecovery,wideruseofnew
compositeproductsandproductionofcellulosicbiofuel
(seethechapter“Developmentsinforestscienceand
technology”inPart2).
OUTLOOK
Sawnwood
Long-termannualgrowthinsawnwoodproductionand
consumptionwasabout1.1percentgloballyintheperiod
1965–1990,butdeclineddrasticallyfrom1990to1995,
mostlyasaresultofreductionsinEasternEuropeandthe
formerSovietUnion(Table21;Figure51).Sawnwood
productionandconsumptionhavealsodeclinedinAsia
andthePacicsince1995.
EuropeandNorthAmericaaccountforabouttwo-
thirdsofglobalsawnwoodproductionandconsumption
andarenetexportersofsawnwood.LatinAmericaandthe
Caribbean,theothernetexportingregion,accountsfor
almost10percentofproduction,whileAsiaandthePacic
accountsforslightlymorethan15percentofproduction
andistheworld’smainnetimportingregion.Production
andconsumptionofsawnwoodinAfricaandinWestern
andCentralAsiaaremodest,amountingtolessthan
5percentoftheglobaltotalbetweenthem.
Global demand
for wood products
FIGURE 50 Global gross domestic product
100
90
80
70
60
50
40
30
20
10
0
1970 1975 1980 1985 1990 1995 2000 2005 2010 2015 2020 2025 2030
US$ trillion
NOTE: 2005 prices and exchange rates.
SOURCES: FAO, 2008a, 2008c.
Africa Western and Central Asia
Asia and the Pacific Latin America and the Caribbean
North America Europe
PART 2 Adapting for the future
63
The world’s forest plantation area, as reported to the Global
Forest Resources Assessment 2005 (FAO, 2006a), is
140.8 million hectares. The area of planted forests, defined
more broadly to include the planted component of semi-natural
forests, is estimated to be 271 million hectares (FAO, 2006b).
The outlook for global wood production from planted
forests to 2030 was estimated based on a survey of planted
forests in 61 countries, representing about 95 percent of the
estimated global planted forest area (FAO, 2006b). The outlook
was calculated based on predicted changes in planted forest
area (mainly through new plantings) as well as opportunities
for increased productivity from more efficient management
practices, new technology and genetic improvements, following
three scenarios:
•Scenario 1: increase in planted forests slowing to half the
pace of previous trends (owing to constraints including
lack of suitable land and slow growth in demand), with no
change in productivity;
•Scenario 2: area changes continuing at the current rate
until 2030, without productivity increases;
•Scenario 3: area changes continuing at the current rate
until 2030, with an annual productivity increase (for those
management schemes where genetic, management or
technological improvements are expected).
The model results indicate that the area of planted forests
will increase in all scenarios in all regions except Africa, with
the highest increase in Asia (figure on the left). Among species
groups, the highest increase will be in pine forests.
The total wood volume produced will increase across all
scenarios from 2005 to 2030 (figure on the right). The widest
variation among scenarios is in Asia and South America,
where the higher-productivity Scenario 3 gives a considerable
increase in wood production, mainly in eucalyptus and other
hardwood species. The differences between Scenarios 1 and
2 are small, as additional planted area in Scenario 2 may not
generate wood within the period of the projection.
Actual production could vary significantly from the
projections. Often, planted forests are not harvested even
on reaching maturity, particularly when they are established
without considering access to markets and potential end uses.
BOX 31 Outlook for wood production from planted forests
Current and projected planted forest area in
61 countries
Total
Asia and the Pacific
Europe
North and Central
America
South America
Africa
0 50 100 150 200 250 300 350 400
Million ha
2005 Scenario 1 for 2030
Scenarios 2 and 3 for 2030
Current and projected wood production from planted
forests in 61 countries
Total
Asia and the Pacific
Europ
e
North and Central
America
South America
Africa
0 500 1 000 1 500 2 000 2 500
Million m
3
/year
2005 Scenario 1 for 2030
Scenario 2 for 2030 Scenario 3 for 2030
SOURCE: Carle and Holmgren, 2008.
STATE OF THE WORLD’S FORESTS 2009
64
Projectionssuggestthatthedistributionofproduction
andconsumptionamongdifferentregionswillnotchange
markedlybefore2030,butthatgrowthwillincreaseatthe
globallevel.Productiongrowthisexpectedtobehighest
intheRussianFederation,EasternEuropeandSouth
America.Highgrowthinconsumptionisexpectedin
AfricaandinAsiaandthePacic.Theseregions,together
withWesternandCentralAsia,willremaindependent
onimportstomeettheirdemand.Consumptiongrowth
indevelopedcountriesisexpectedtobemoremoderate
becauseofreplacementbyengineered(composite)wood
products.
Large-scale payments for ecosystem services (especially
for climate-related services) offer the best prospect for
generating funds to secure the tropical forest resource base.
However, the main source of income from tropical forests
remains timber and wood products. Annual exports of
primary and secondary wood products from tropical forests
have exceeded US$20 billion in recent years, with further
increases foreseen as more countries focus exports on
higher-valued secondary wood products.
Much of the raw material already comes from planted
forests. The vast areas of degraded forest land in the tropics
provide much scope for further increasing planted area,
with potential benefits for the wood-processing sector and
opportunities for capturing funds from emerging greenhouse
gas markets. However, it is important to ensure that
payments for ecosystem services do not lead countries to
convert natural forest to fast-growing plantations.
Certification and public-purchasing policies are likely
to become more important for exporters of tropical wood
products in the future, especially as more countries begin
to insist on evidence of sustainability, including China
(in response to demands from its own export markets).
Cellulosic biofuels are likely to provide economic alternatives
for tropical countries, but technology transfer from developed
countries will be required in order to realize this potential.
The main challenge in the future, as now, will be to add
value to tropical forests so that deforestation becomes an
economically unattractive option. Despite the potential of
new funding mechanisms for tropical forests, it is highly likely
that there will be less money available than required.
n
Timber and the future of tropical forests
From the International Tropical Timber Organization (ITTO)
Views from CPF partners
TABLE 21
Production and consumption of sawnwood
Region
Amount
(million m
3
)
Average annual change
(%)
Actual Projected Actual Projected
1965 1990 2005 2020 2030 1965–1990 1990–2005 2005–2020 2020–2030
Production
Africa 3 8 9 11 14 3.7 0.5 1.6 1.9
Asia and the Pacific 64 105 71 83 97 2.0 –2.6 1.1 1.6
Europe 189 192 136 175 201 0.1 –2.2 1.7 1.4
Latin America and the Caribbean 12 27 39 50 60 3.3 2.5 1.7 2.0
North America 88 128 156 191 219 1.5 1.3 1.4 1.4
Western and Central Asia 2 6 7 10 13 4.6 1.5 2.6 2.2
World 358 465 417 520 603 1.1 –0.7 1.5 1.5
Consumption
Africa 4 10 12 19 26 3.6 1.2 2.8 3.5
Asia and the Pacific 64 112 84 97 113 2.3 –1.9 1.0 1.6
Europe 191 199 121 151 171 0.2 –3.3 1.5 1.2
Latin America and the Caribbean 11 26 32 42 50 3.3 1.5 1.7 1.8
North America 84 117 158 188 211 1.3 2.0 1.2 1.2
Western and Central Asia 3 7 13 18 23 4.0 3.7 2.5 2.2
World 358 471 421 515 594 1.1 –0.8 1.4 1.4
NOTE: Data presented are subject to rounding.
SOURCES: FAO, 2008a, 2008c.
PART 2 Adapting for the future
65
Global demand for wood products
Wood-based panels
Althoughproductionandconsumptionofwood-based
panels–includingplywood,veneersheets,particleboard
andbreboard–arecurrentlyonlyhalfthoseof
sawnwood,theirhighergrowthrateswillbringthemto
thelevelsofsawnwoodby2030(Table22;Figure52).
However,futuregrowthinproductionandconsumption
willbeslightlyslowerthaninthepastinmostregions,
whichsuggeststhatthesubstitutionofwood-based
panelsforsawnwoodmaybeslowing.
Productionandconsumptionarecurrentlyevenly
balancedamongthethreemainmarkets(Asiaand
thePacic,EuropeandNorthAmerica).Asiaandthe
Pacicwillaccountforagreaterproportionofglobal
wood-basedpanelproductionandconsumptioninthe
future.
FIGURE 51 Sawnwood production
700
600
500
400
300
200
100
0
Million m
3
SOURCES: FAO, 2008a, 2008c.
1965 1970 1975 1980 1985 1990 1995 2000 2005 2010 2015 2020 2025 2030
TABLE 22
Production and consumption of wood-based panels
Region
Amount
(million m
3
)
Average annual change
(%)
Actual Projected Actual Projected
1965 1990 2005 2020 2030 1965–1990 1990–2005 2005–2020 2020–2030
Production
Africa 1 2 3 4 5 4.6 3.8 2.1 2.4
Asia and the Pacific 5 27 81 160 231 6.9 7.5 4.6 3.7
Europe 16 48 73 104 129 4.5 2.8 2.4 2.2
Latin America and the Caribbean 1 4 13 21 29 7.4 7.6 3.3 3.2
North America 19 44 59 88 110 3.4 2.0 2.7 2.2
Western and Central Asia 0 1 5 11 17 6.8 8.9 5.4 4.7
World 41 127 234 388 521 4.6 4.2 3.4 3.0
Consumption
Africa 0 1 3 4 5 4.8 5.3 1.9 2.4
Asia and the Pacific 4 24 79 161 236 7.4 8.2 4.8 3.9
Europe 16 53 70 99 122 4.9 1.9 2.4 2.1
Latin America and the Caribbean 1 4 9 12 15 7.0 5.7 2.2 2.3
North America 20 43 70 96 115 3.1 3.3 2.1 1.8
Western and Central Asia 0 2 9 18 28 8.1 10.6 4.5 4.5
World 42 128 241 391 521 4.6 4.3 3.3 2.9
NOTE: Data presented are subject to rounding.
SOURCES: FAO, 2008a; FAO, 2008c.
FIGURE 52 Global wood-based panel production
700
600
500
400
300
200
100
0
Million m
3
SOURCES: FAO, 2008a, 2008c.
1965 1970 1975 1980 1985 1990 1995 2000 2005 2010 2015 2020 2025 2030
Africa Western and Central Asia
Asia and the Pacific Latin America and the Caribbean
North America Europe
Africa Western and Central Asia
Asia and the Pacific Latin America and the Caribbean
North America Europe
STATE OF THE WORLD’S FORESTS 2009
66
Withinthecategoryofwood-basedpanels,thereisan
increasingshiftfromplywood(whichaccountedformostof
thewood-basedpanelproductionandconsumptioninthe
1960s)toparticleboardandbreboard.Thisshift,whichhas
importantimplicationsforwoodraw-materialrequirements,
beganinEurope(whereparticleboardandbreboard
accountedfor90percentofthepanelmarketin2005)and
hascontinuedinNorthAmerica(70percent).Ithasonly
recentlystartedtooccurinAsiaandthePacic,where
plywoodstillaccountsformorethanhalfofproductionand
consumption,withtwomainproducers(Indonesiaand
Malaysia)andtwomainconsumers(ChinaandJapan).
AsiaandthePacic,EuropeandLatinAmericaandthe
Caribbeanarenetexportingregions,whiletheothersare
netimporters.Europeexportsmainlyparticleboardand
breboard,whiletheothertworegionsexportplywood.
Thesetrendsareexpectedtocontinue,withinternational
tradeaccountingforabout26–27percentofglobal
productionandconsumption.
Paper and paperboard
Aswithpanelproducts,globalproductionofpaperand
paperboardisalsoexpandingrapidly(althoughlessso
thaninrecentdecades),withanannualgrowthrate
of3.7percentbetween1965and1990and2.8percent
between1990and2005.Growthratesforconsumption
havebeenaboutthesameasthoseforproduction
(Table23;Figure53).
Historically,NorthAmericadominatedglobal
productionandconsumption,butbecauseofrapidgrowth
inAsiaandthePacicandEurope,allthreemajormarkets
nowaccountforasimilarshare.Therapidgrowthin
AsiaandthePacicisaconsequenceofthehighrateof
economicgrowthinrecentdecades,rstinJapananda
fewotherindustrializingeconomiesandmorerecentlyin
ChinaandIndia.
TABLE 23
Production and consumption of paper and paperboard
Region
Amount
(million tonnes)
Average annual change
(%)
Actual Projected Actual Projected
1965 1990 2005 2020 2030 1965–1990 1990–2005 2005–2020 2020–2030
Production
Africa 1 3 5 9 13 6.4 4.3 3.9 3.7
Asia and the Pacific 13 58 121 227 324 6.3 5.0 4.3 3.6
Europe 33 76 111 164 201 3.4 2.6 2.6 2.1
Latin America and the Caribbean 2 8 14 21 27 5.7 3.6 2.9 2.7
North America 48 91 109 141 169 2.6 1.2 1.8 1.8
Western and Central Asia 0 1 3 6 9 9.2 5.9 4.2 3.5
World 96 238 363 568 743 3.7 2.8 3.0 2.7
Consumption
Africa 1 4 7 14 21 5.1 4.2 4.6 4.4
Asia and the Pacific 13 63 128 234 329 6.3 4.9 4.1 3.5
Europe 32 73 101 147 180 3.3 2.2 2.6 2.0
Latin America and the Caribbean 3 9 16 24 31 4.7 3.9 2.9 2.6
North America 46 87 106 138 165 2.6 1.3 1.8 1.8
Western and Central Asia 0 3 8 14 20 7.5 7.5 4.0 3.4
World 96 237 365 571 747 3.7 2.9 3.0 2.7
NOTE: Data presented are subject to rounding.
SOURCES: FAO, 2008a, 2008c.
FIGURE 53 Global paper and paperboard
production
800
700
600
500
400
300
200
100
0
Million tonnes
SOURCES: FAO, 2008a, 2008c.
1965 1970 1975 1980 1985 1990 1995 2000 2005 2010 2015 2020 2025 2030
Africa Western and Central Asia
Asia and the Pacific Latin America and the Caribbean
North America Europe
PART 2 Adapting for the future
67
Global demand for wood products
InEurope,productiongrowthhasbeendrivenpartlyby
theexpansionofexports;Europeisthelargestexporterof
paperproducts.Onthesupplyside,Europeanproduction
hasalsobenetedfromhighgrowthinwastepaper
recovery.
Thedifferencesinpastandfuturegrowthalsoreect
thestructureofthepaperandpaperboardmarketsand
industryinthethreemainregions:
• Currently,globalnewsprintproductionisdivided
roughlyequallyamongAsiaandthePacic,Europe
andNorthAmerica,butgrowthisslowingbecauseof
therapidspreadofelectronicmedia.
• AsiaandthePacicandEuropeproducefarmore
printingandwritingpaperthanNorthAmerica.
• Productionofotherpaperandpaperboardishighest
inAsiaandthePacic.
Paperandpaperboardisoneofthemostglobalized
commoditygroups,withahighshareofproduction
exportedandahighshareofconsumptionimported.
Internationaltradeexpandedsignicantlyinthe1990s,
especiallyinEurope,andtheglobalizationofpaperand
paperboardmarketswillcontinueinthefuture.
Industrial roundwood
Industrialroundwooddemandisderivedfromgrowth
indemandforendproducts–sawnwood,wood-based
panelsandpaperandpaperboard.Woodrequirements
fortheseproductsvarydependingonthetechnology
employedandthepotentialtousewoodandbrewaste.
Growthinsawnwoodproductionrequiresmoreindustrial
roundwood,whereasashifttoreconstitutedpanel
production(particleboardandbreboard)increasesthe
potentialtousewoodresiduesandbrewaste,reducing
industrialroundwoodrequirements.Recyclingpolicies
haveledtoincreaseduseofrecoveredpaperandreduced
pulpwooddemand.
Increaseduseofwoodresiduesandrecycledmaterials
willreducetheshareofindustrialroundwoodintotal
woodandbreusefromalmost70percentin2005to
about50percentin2030.
Thetotalderiveddemandinwoodraw-material
equivalent(WRME)ishigherthantheconsumptionof
industrialroundwood.In2005,globalderiveddemand
amountedtoabout2.5billioncubicmetresWRME,of
which1.7billioncubicmetreswasindustrialroundwood.
Approximately0.5billioncubicmetresWRMEcamefrom
recoveredpaperandtheremainderfromwood-processing
residues,recoveredwoodproductsandothersources.
Globalproductionofindustrialroundwoodisexpected
toincreasebyslightlymorethan40percentupto2030
(Table24;Figure54).Thisisconsiderablylessthanthe
projectedriseintotalwoodandbredemand(which
isexpectedtoalmostdouble)becausethehighestrates
ofproductiongrowthareexpectedinthepaperand
paperboardsectorandahigherproportionofpaper
consumptionwillberecycledinthefuture.
TABLE 24
Production and consumption of industrial roundwood
Region
Amount
(million m
3
)
Average annual change
(%)
Actual Projected Actual Projected
1965 1990 2005 2020 2030 1965–1990 1990–2005 2005–2020 2020–2030
Production
Africa 31 55 72 93 114 2.4 1.8 1.8 2.0
Asia and the Pacific 155 282 273 439 500 2.4 –0.2 3.2 1.3
Europe 505 640 513 707 834 0.9 –1.5 2.2 1.7
Latin America and the Caribbean 34 114 168 184 192 5.0 2.6 0.6 0.4
North America 394 591 625 728 806 1.6 0.4 1.0 1.0
Western and Central Asia 10 9 17 15 11 –0.6 4.5 –0.8 –3.0
World 1 128 1 690 1 668 2 166 2 457 1.6 –0.1 1.8 1.3
Consumption
Africa 25 51 68 88 109 2.9 1.9 1.8 2.1
Asia and the Pacific 162 315 316 498 563 2.7 0.0 3.1 1.2
Europe 519 650 494 647 749 0.9 –1.8 1.8 1.5
Latin America and the Caribbean 33 111 166 181 189 4.9 2.7 0.6 0.4
North America 389 570 620 728 808 1.5 0.6 1.1 1.0
Western and Central Asia 10 10 19 22 19 –0.2 4.4 1.1 –1.3
World 1 138 1 707 1 682 2 165 2 436 1.6 –0.1 1.7 1.2
NOTE: Data presented are subject to rounding.
SOURCES: FAO, 2008a; 2008c.
STATE OF THE WORLD’S FORESTS 2009
68
Mostofthegrowthwilloccurinthethreemain
regionalmarkets.Thegreatestproductionexpansionwill
beinEurope(morethan300millioncubicmetres),mostly
becauseofincreasesintheRussianFederation.Production
inAsiaandthePacicandNorthAmericawillalsoexpand,
largelybecauseofincreasedproductionfromplanted
forests.
AsiaandthePacicwillhaveahighdecitbetween
productionandconsumption,increasingfromabout
43millioncubicmetresin2005to63millioncubicmetres
in2030.Thus,theregionwilldependonpotentialsurplus
countries,especiallytheRussianFederationandpossibly
somecountriesinLatinAmericaandtheCaribbean.
Inthe1990s,Europe,whichhadbeenanetimporter
ofindustrialroundwood,becameanetexporter,largely
becauseofexportsfromtheRussianFederation.The
oppositetrendwasobservedinAsiaandthePacic.This
situationislikelytocontinueinthefuture,althoughit
couldbeinuencedbyrecentchangesintheRussian
Federation’sforestpolicies(seeBox10onpage26).
Wood energy
Roundwoodusedinenergyproductioniscomparablein
quantitywithindustrialroundwood.Energyproduction
usingwoodincludestraditionalheatingandcookingwith
fuelwoodandcharcoal,heatandpowerproductioninthe
forestindustry(usuallyusingprocessingwastessuchas
blackliquorfrompulpproduction)forownuseorsale
toothers,andheatandpowergenerationinspecically
designedpowerfacilities.
Statisticsonenergyproductionfromwoodaredifcult
toobtainbecauseofthisdiversityofusesandthehigh
shareofinformalproduction.Furthermore,thetwo
mainagenciesthatcollectthesestatistics–FAOandthe
InternationalEnergyAgency(IEA)–presentdifferent
guresbecauseofdifferentdenitionsandprimarydata
sources.IEApresentsbiomassenergyproductiongures
thatincludeothertypesofbiomassbesideswood(i.e.
agriculturalresiduesanddung).Itsstatisticsalsoinclude
heatandpowergenerationintheforestindustryandby
commercialenergyproducers,whicharenotfullycaptured
inFAOstatistics.
Trendsandprojectionsforbiomassenergyproduction
estimatedfromacombinationofthesetwodatasources
revealanincreaseinglobalproductionfromabout
530milliontonnesoilequivalent(MTOE)in1970to
about720MTOEin2005,projectedtoreach1075MTOE
in2030(Table25;Figure55).
Interpolationsuggeststhatwoodusedforbioenergy
productionincreasedfromabout2billioncubicmetresin
1970to2.6billioncubicmetresin2005.Thissuggeststhat
upto3.8billioncubicmetresofwoodcouldberequiredby
2030.However,someofthefuturedemandmaybesatised
bybiomassproducedfromagriculturalresiduesandenergy
crops(includingshort-rotationcoppiceandgrasses).
Until2005,globalbiomassenergyproduction
increasedrelativelyslowly,atlessthan1percentperyear.
Mostoftheincreaseinproductionoccurredindeveloping
countries,wherewoodcontinuestobeamajorsource
ofenergy.TheexceptionisAsiaandthePacic,where
growthhasdeclinedconsiderablybecauseofswitchingto
otherpreferredtypesofenergyasaresultofincreasing
income.
Theprojectionsreectafuturemarkedincreaseinthe
useofbiomassforenergyproductioninEuropeand,toa
lesserextent,NorthAmericaasrenewableenergypolicies
andtargetstakeeffect.Europe’spercapitabiomassenergy
useisprojectedtotripleby2020inresponsetorenewable
energytargets,althoughsomeproductionwillalso
comefromenergycropsandagriculturalresidues.Most
developedcountrieshavesetrenewableenergytargetsfor
2020;hence,rapidgrowthinproductionisexpecteduntil
thattime,followedbyaslowerrateofgrowth.
Furthermore,futurelarge-scalecommercialproduction
ofcellulosicbiofuelcouldincreasethedemandforwood
drastically,beyondthatshownintheprojections.
Theprojectionsforbiomassenergyproductionin
developingcountriesalsohaveinterestingfeatures:
• InAfrica,thegrowthinbiomassenergyproduction
willcontinue,butwillslowsignicantly.Withthe
region’srelativelysmallprocessingsectorandfew
renewableenergytargets,mostofitsbioenergy
productionwillcontinuetobefromtraditional
woodfuel(fuelwoodandcharcoal).Followingthe
trendinotherregions(e.g.AsiaandthePacic),this
FIGURE 54 Global production of industrial
roundwood
2 500
2 000
1 500
1 000
500
0
Million m
3
SOURCES: FAO, 2008a, 2008c.
1965 1970 1975 1980 1985 1990 1995 2000 2005 2010 2015 2020 2025 2030
Africa Western and Central Asia
Asia and the Pacific Latin America and the Caribbean
North America Europe
PART 2 Adapting for the future
69
Global demand for wood products
growthisexpectedtodeclineasincomesriseand
morepeopleswitchtoothertypesofenergy.
• InAsiaandthePacic,traditionalwoodfuel
productionisexpectedtodecline,butthiswillbe
outweighedbyincreasedproductionofbioenergyin
theforestindustryand,inafewcases(e.g.China),
commercialbioenergyproductioninresponseto
renewableenergytargets.
• InLatinAmericaandtheCaribbean,biomassenergy
productionisprojectedtoincreaseinalldimensions,
withariseintraditionalwoodfuelproductionin
thepoorercountriesoftheregionandincreased
bioenergyproductionbytheforestindustryand
othersinthemoreadvancedeconomies.
SUMMARY
Theproductionandconsumptionofwoodproductsand
woodenergyareexpectedtoincrease,largelyfollowing
historicaltrends.Oneshiftwillbethehighergrowthin
theproductionandconsumptionofwoodproductsinAsia
andthePacic,mainlystemmingfromtherapidgrowthin
demandfromemergingeconomiessuchasChinaandIndia.
Themostdramaticchangewillbetherapidincreaseinthe
useofwoodasasourceofenergy,particularlyinEuropeasa
resultofpoliciespromotinggreateruseofrenewableenergy.
TheAsiaandthePacicregionisbecomingthemajor
producerandconsumerofwood-basedpanelsandpaperand
paperboard(althoughpercapitaconsumptionwillremain
higherinEuropeandNorthAmerica).Theregion’sindustrial
roundwoodproductionwillbefarshortofconsumption,
increasingdependenceonimportsunlesssubstantialefforts
aremadetoboostwoodproduction.However,itwillbe
difculttoexpandwoodproductioninAsiaandthePacic
giventhehighpopulationdensityandcompetinglanduses.
Changesintheuseofwoodforenergyandparticularly
thepotentialforlarge-scalecommercialproductionof
cellulosicbiofuelwillhaveunprecedentedimpactson
theforestsector.Increasingtransportcostscouldalso
inuencetheseprojections.Mostofthegrowthinglobal
forestproductsvaluechainshasbeenfoundedonthe
drasticdeclineintransportcostsinthepasttwodecades.
Thesefactorsandothers,includingchangesinexchange
rates,willinuencethecompetitivenessoftheforest
sectorandaffecttheproductionandconsumptionofmost
forestproducts.
Furthermore,theindustrialroundwoodthatisusedis
increasinglylikelytocomefromplantedforests,asgrowth
inproductionfromplantedforestsisexpectedtokeepup
withdemandgrowthforindustrialroundwood.This
presentsinterestingopportunitiesandchallengesfor
managementoftheremainingforestestate.
TABLE 25
Production of bioenergy
Region
Amount
(MTOE)
1
Average annual change
(%)
Actual Projected Actual Projected
1970 1990 2005 2020 2030 1970–1990 1990–2005 2005–2020 2020–2030
Africa 87 131 177 219 240 2.1 2.0 1.4 0.9
Asia and the Pacific 259 279 278 302 300 0.4 0.0 0.6 –0.1
Europe 60 70 89 272 291 0.7 1.6 7.7 0.7
Latin America and the Caribbean 70 88 105 123 133 1.1 1.2 1.1 0.8
North America 45 64 65 86 101 1.8 0.1 2.0 1.6
Western and Central Asia 11 7 6 8 10 –2.7 –1.0 2.4 1.9
World 532 638 719 1 010 1 075 0.9 0.8 2.3 0.6
1
MTOE = million tonnes oil equivalent.
NOTE: Data presented are subject to rounding.
SOURCES: FAO, 2008a, 2008c.
FIGURE 55 Global production of energy from
biomass
1 200
1 000
800
600
400
200
0
Million tonnes oil equivalent
NOTES: 1 tonne of oil equivalent is equal to approximately 4 m
3
of wood.
Figures include the use of black liquor, agricultural residues and dung in addition to wood.
SOURCES: FAO, 2008a, 2008c.
1970 1975 1980 1985 1990 1995 2000 2005 2010 2015 2020 2025 2030
Africa Western and Central Asia
Asia and the Pacific Latin America and the Caribbean
North America Europe
STATE OF THE WORLD’S FORESTS 2009
70
In 2006, the forest industry contributed approximately
US$468 billion or 1 percent of the global gross value added.
Although this represents an increase in the absolute value
of about US$44 billion since 1990, the share of the forestry
sector has declined continuously because of the much
faster growth of other sectors (see figure). Between 1990
and 2006, value addition increased significantly in the
wood-processing subsector, rose marginally in roundwood
production and remained stable in pulp and paper, which
accounted for nearly 43 percent of the forestry sector’s
value added in 2006.
Asia and the Pacific registered the most significant
increase in gross value added, a large part of it in
the pulp and paper subsector (see table). Its share of
roundwood production was relatively stable. Growth
in Latin America and the Caribbean was also strong,
mostly as a result of expansion in roundwood production.
Roundwood production also accounted for the increase
in Africa. The increase in North America was mainly in
the wood-processing sector, while the pulp and paper
sector remained stable. Forestry’s value added fell only in
Europe, mainly owing to a decline in the pulp and paper
subsector. Value added in Western and Central Asia
remained stable.
These trends are likely to continue in the next few
years, especially as investments in wood production and
processing increase in Asia and the Pacific and in Latin
America and the Caribbean.
Gross value added in forestry
Gross value added
Region Roundwood
production
(US$ billion)
Wood processing
(US$ billion)
Pulp and paper
(US$ billion)
Total
(US$ billion)
Contribution
to GDP
(%)
1990 2006 1990 2006 1990 2006 1990 2006 1990 2006
Africa 6 9 2 2 3 3 11 14 1.7 1.3
Asia and the Pacific 29 33 21 30 40 56 90 119 1.4 1.0
Europe 27 25 57 57 74 60 159 142 1.4 1.0
Latin America and
the Caribbean
13 21 6 7 11 12 30 40 2.0 1.9
North America 21 27 35 53 73 67 129 147 1.4 1.0
Western and
Central Asia
2 2 1 1 2 2 5 5 0.5 0.3
World 98 118 123 150 202 201 424 468 1.4 1.0
NOTE
: Data presented are subject to rounding.
Forestry sector’s contribution to GDP
Gross value added (US$ billion) Contribution to GDP (percentage)
Roundwood production
Wood processing Pulp and paper Total
1990 1992 1994 1996 1998 2000 2002 2004 2006 1990 1992 1994 1996 1998 2000 2002 2004 2006
500
450
400
350
300
250
200
150
100
50
0
1.50
1.25
1.00
0.75
0.50
0.25
0.00
STATE OF THE WORLD’S FORESTS 2009
72
A
sthedemandforfood,breandfuelhasincreased,
sohasthedemandforcleanairandwater,unspoilt
landscapesandotherenvironmentalservices
providedbyforests.Whereforestsareconvertedto
otherlanduses,theservicestheysupplyarediminished.
Maintainingsuchservicesposeschallenges,especially
wheretrade-offsbetweentheproductionofgoodsandthe
provisionofservicesmustbeaddressed.
Publiclyownedforestshavebeenamajorsource
ofenvironmentalservices,providedmainlythrough
regulatory,non-marketapproachessuchasprotected
areas.Withnon-stateactorsplayinganincreasingrole
inresourcemanagement,aneedforincentivesforthe
provisionofenvironmentalserviceshasbecomeevident.
Thischapterdiscussestheoutlookandchallengesinthe
provisionofenvironmentalservicesfromforests.
REGULATORY APPROACHES
Protected areas
Establishmentofprotectedareashasbeenanimportant
andwidelyadoptedregulatoryapproachtoprotectingthe
environment.Amainobjectiveistorestrictorprohibit
activitiesthatunderminethesupplyofenvironmental
services.Protectedareasaregroupedintodifferent
categoriesdependingonthedegreeofprotectionafforded.
Theextentofterrestrialprotectedareas(includingbut
notonlyforestprotectedareas)hasregisteredsignicant
growthinthepastthreedecades,althoughitseemsto
havebeenlevellingoffsince2000(Figure56).Thetotal
extentofprotectedareasisabout1.9billionhectares,or
about14.5percentofgloballandarea.Thisrepresentsan
increaseof35percentsince1990(UN,2008c).Thearea
protectedvariesconsiderablyamongtheregions.The
outlookforprotectedareamanagementdependsonboth
thescopeforincreasingtheextentofprotectedareasand
theeffectivenessoftheirmanagement.
About13.5percentoftheworld’sforestsareinsome
categoryofprotectedarea(Schmitt
et al.,2008).With
theexceptionofsomeofthelargeforestedregionswhere
populationdensitiesarelow–theAmazonBasin,the
CongoBasinandtheborealforestsofCanadaand
theRussianFederation–thescopeforfurtherexpansion
ofprotectedareasisprobablylimited.
Effectivemanagementofprotectedareasposes
enormouschallenges.Muchdependsonthewillingness
andabilityofsocietytomeetthedirectandindirectcosts
oftheirmanagement.
Indenselypopulatedcountries,protectedareasare
vulnerabletodegradationcausedbyillegallogging,
woodfuelcollection,grazingandpoaching.The
ineffectivenessofexcludingpeoplehasledtoashiftin
managementapproach,favouringpeople’sparticipation
inprotectedareamanagement,includingincome-sharing
arrangementswithlocalcommunities.Thesuccessofsuch
approachesdependsonestablishingappropriatetrade-
offsbetweenconictingobjectives.Thisrequiresarobust
institutionalframeworkandgoodmediationskillsto
negotiatealastingcompromise.
Protectedareasareoftenthelastfrontierforlarge-scale
developments,especiallyinvolvingmining,oildrilling,
infrastructureandlarge-scaleagriculture.Low-income
Meeting the demand for
environmental services of forests
FIGURE 56 Growth in terrestrial protected areas
500
400
300
200
100
0
1990 1992 1994 1996 1998 2000 2002 2004 2006
Million hectares
SOURCE: UN, 2008c.
Africa Asia and the Pacific
Europe Latin America and the Caribbean
North America Western and Central Asia
PART 2 Adapting for the future
73
countriesdependentonlandandothernaturalresources
fortheirdevelopmentoftennditextremelydifcultto
resistsuchoptions.
Sustainable forest management
Aslessthanone-seventhoftheworld’sforestsaresetaside
asprotectedareas,mostforestenvironmentalservicesare
providedinconjunctionwiththeproductionofwoodand
otherproducts.Productioncanbecompatiblewithprovision
ofenvironmentalservices,butonlyuptoacertainlevel.
Thus,considerableattentionhasbeendevotedtodeveloping
woodproductionsystemsthatminimizeenvironmental
damageandsupportcontinuedprovisionofservices.
Implementationofsustainableforestmanagement–which
addressestheeconomic,socialandenvironmentalfunctions
offorests–isanimportantapproachtoensuringabalance
betweentheobjectivesofproductionandconservation.
Maintainingcriticalecosystemfunctionsisakeypillar
ofsustainableforestmanagement.“Close-to-nature
silviculture”andthe“ecosystemapproach”areessentially
variantsofsustainableforestmanagement,givinggreater
emphasistoenvironmentalservices.
Whiletheconceptofsustainableforestmanagement
isacceptedastheframeworkformanagingforestsin
mostcountries,itsimplementationdiffersconsiderably
amongthem.Barrierstoitsadoptionarerelativelyfew
whereinstitutionsarewelldevelopedandsocietyisable
tomeetthehighercosts,asisthecaseinmanydeveloped
countries.However,inlow-incomesituations,sustainable
forestmanagementfacesfarmoreconstraints,reecting
limitedabilityandwillingnesstopayfortheadditionalcosts
involvedinadheringtothesocialandenvironmentalcriteria.
Consequently,inthetropics,theproportionofforeststhatare
sustainablymanagedremainsverylow(ITTO,2006).
Green public procurement
Publicprocurementpoliciesthataimtoensurethatwood
productspurchasedhavebeenproducedlegallyhave
thepotentialtopromotesustainableforestmanagement
andenvironmentalprotection.Forexample,Japan,
NewZealandandseveralcountriesinEuropehave
operationaltimberprocurementpolicies,andmany
regionalandlocalgovernmentshaveestablishedrestrictive
rulesfortheirprocurementcontracts(UNECEandFAO,
2006a).Anincreasingnumberofpublic-andprivate-
sectorplayersarealsoadoptinggreenbuildingand
procurementpolicies(Metafore,2007)(Box32).
MARKET MECHANISMS: THE DEMAND SIDE
Certification for green products
Amajorconditionfortheadoptionofsustainableforest
managementisademandforproductsthatareproduced
sustainablyandconsumerwillingnesstopayforthe
highercostsentailed.Certicationrepresentsashiftfrom
“Green building” is construction that conserves raw
materials and energy and reduces environmental impacts.
It includes consideration of future water use and energy
demands, ecological site selection and the procurement
of sustainably produced materials. In the United States of
America, many public agencies and schools have adopted
green building standards. Leadership in Energy and
Environmental Design is a green building rating system
developed in 1994 by the United States Green Building
Council (a member of the World Green Building Council,
which has members in more than ten countries). It is a
national third-party certification programme for the design,
construction and operation of high-performance green
buildings. Green building legislation, policies and incentives
are in place in 55 cities, 11 counties and 22 states.
While green building provides healthier work
environments at both the environmental and human
levels, the high costs involved are frequently a
disincentive. However, the initial costs are often mitigated
over time by gains in overall efficiency.
SOURCE: USGBC, 2008.
BOX 32 Green building in the United States
of America
STATE OF THE WORLD’S FORESTS 2009
74
regulatoryapproachestomarketincentivestopromote
sustainableforestmanagement.Bypromotingthepositive
attributesofforestproductsfromsustainablymanaged
forests,certicationfocusesonthedemandsideof
environmentalconservation.
In2008,morethan300millionhectares,or
almost8percentoftheworld’sforests,werecertied
byindependentthirdparties,asignicantincrease
sincethird-partycerticationwasintroducedin1993
(Figure57).Thetwomajorcerticationsystemsare
thoseoftheForestStewardshipCouncil(FSC)andthe
ProgrammefortheEndorsementofForestCertication
Schemes(PEFC).Inaddition,manycountrieshave
nationalcerticationsystems,oftenafliatedwithPEFC
(UNECEandFAO,2006b;ITTO,2008).
In2006,certiedforestssuppliedabout24percent
oftheglobalindustrialroundwoodmarket
(UNECEand
FAO,2006b).FSC(2008)estimatesannualsalesofFSC-
labelledproductsatUS$20billion.PEFCestimatesthat
45percentoftheworld’sroundwoodproductionwillcome
fromcertiedforestsby2017(Clark,2007).Inaddition
towood,otherproductsareincreasinglybeingcertied,
includingwoodfuelandNWFPs(UNECEandFAO,2007).
Bothmajorcerticationsystemsnowallownon-
certiedwoodtobesoldtogetherwithcertiedwood
undera“mixedsources”label,provideditmeetscertain
basicrequirementsofacceptableforestmanagement
(WorldResourcesInstitute,2007).
Thefollowingarekeyissuesandtrendsincertication:
• Althoughcerticationstartedwiththeobjectiveof
encouragingsustainableforestmanagementinthe
tropics,only10percentofthecertiedforestareain
2008wasinthetropics.TherestwasinEuropeand
NorthAmerica,reectingeconomicandinstitutional
advantagesinadoptingcerticationindeveloped
countries.
• Certicationprovidesaccesstomarketswhere
consumersprefergreenproducts,butnoprice
premiumtocoverthecostsofcertication.Formany
producers,accesstothegreenmarketisinsufcient
incentiveforseekingcertication,especiallywhen
thereisdemandforcomparableuncertiedproducts
producedatalowercost.
• Majorexpansionincerticationwilldependonthe
responseofconsumersinrapidlygrowingmarkets
(especiallyChinaandIndia).Whilethedesire
formarketaccessmayencouragethegrowthof
certication,themainconstraintscouldbeonthe
supplyside,especiallytheinvestmentsrequiredto
reachtheminimumthresholdlevelofmanagement
allowingcertication.
MARKET MECHANISMS: THE SUPPLY SIDE
Encouragingthesupplyofenvironmentalservicesthrough
appropriatepaymentstoforestownershasreceived
considerableattentionasameansofsupportingforest
conservation.Whilesuchpaymentshavelongexisted
forrecreationalservices(forexample,throughentry
feestorecreationalsites),theyarebeingadoptedfor
otherservicessuchaswatershedprotection,biodiversity
conservationandcarbonsequestration(Box33).Theidea
istoplaceenvironmentalservicesonaparwithother
marketedproducts,correctingthebiasagainsttheirsupply.
Paymentsforenvironmentalservices(PES)have
beendevelopedmainlyforwatershedservices,carbon
sequestrationandtosomeextentbiodiversityconservation.
Thegrowthofecotourismhasalsofacilitatedthe
developmentofmarketsforscenic
andnaturevalues,
especiallythroughaccessfeesandpermits.
Watershed protection
Watershedprotectionisoneofthemostimportant
environmentalservicesinvolvingforestsandhasreceived
considerableattentionforpaymentschemes.These
schemesinvolvepaymentstoupstreamlandusersfor
improvingwaterqualityandquantitythroughappropriate
land-usepractices.Sucharrangementstendtobemost
effectiveinsmallwatersheds,whereserviceproviders
andbeneciariesareabletointeractandtheinformation
owisrelativelysmooth.Atlargerscales,morecomplex
arrangementsbecomenecessary.Inmostcases,the
paymentsarefromutilitycompaniestolandusers.
Aswaterisindispensableandtangible,usersaregenerally
willingtopayforimprovingthequality,quantityand
regularityofitssupply.Moreover,itiseasygeographically
toidentifytheprovidersandbeneciariesoftheservice.
FIGURE 57 FSC- and PEFC-certified forest area, 2008
Total
Western and
Central Asia
Africa
Asia and the Pacific
Latin America and
the Caribbean
North America
Europe
0 50 100 150 200 250
Million hectares
SOURCES: FSC, 2008; PEFC, 2008.
FSC PEFC
PART 2 Adapting for the future
75
Meeting the demand for environmental services of forests
The UNCCD promotes synergies offered by forests among
multilateral environmental agreements. Sustainable forest
management, sustainable land management and climate
change adaptation strategies are interrelated; solutions for
forest degradation and deforestation overlap with those for
land degradation. The Global Mechanism uses national policy
processes for coordination and reconciliation, with the aim
of increasing investments and financial flows in forests and
agriculture. It supports efforts to increase resource allocations
in national budgets, to take full advantage of innovative
financial mechanisms and to obtain “vertical funds” focused
on specific themes.
From a financing perspective, the potential for increased
financial flows to address land degradation and degraded forests
in the future climate regime is interesting but demands careful
preparation. A responsible pro-poor policy framework would
provide equitable compensation to smallholder farmers that
offer environmental services to the country and climate change
resilience to the world. Subsistence farmers in fragile ecosystems
could become key players in the international market.
Although forests in arid and semi-arid lands have
comparatively low carbon values, they are being degraded at
relatively high rates in some regions and, therefore, are targets
of national and international schemes. In addition, low-carbon-
density forest lands may act as buffer areas between agricultural
lands and more dense forests. Their protection is particularly
important in preventing encroachment, conversion, further land
degradation and eventual desertification.
n
Forests and synergies among multilateral environmental agreements
From the Global Mechanism of the United Nations Convention to Combat Desertification (UNCCD)
Views from CPF partners
Climate change poses a major challenge to forests. Its
impacts on the supportive and regulating processes of
forests and on how people use forest resources are difficult
to predict. The best response to the uncertainty climate
change presents is to maintain or increase the functioning
and resilience of all forests as a matter of urgency. This
challenge provides opportunities for forest stakeholders at
the national and international levels to increase cooperation.
UNEP promotes an ecosystem approach that considers
lessons learned from the past and seeks preparedness for
challenges such as climate change. The services that forests
provide need to be part of development strategies and
incorporated into financial decision-making. Climate regulation
is just one of the services for which a monetary value
urgently needs to be established. Others include hydrological
regulation, protection from natural hazards, nutrient cycling,
energy, waste treatment and freshwater provisioning.
As population growth persists and the decline of forest
ecosystem services continues, UNEP will promote equitable
distribution of ecosystem services across socio-economic
groups as an important measure for increasing human well-
being and for mitigating conflicts and disasters.
n
Valuing ecosystem services
From the United Nations Environment Programme (UNEP)
Views from CPF partners
•An operational PES scheme can take years to develop.
The crucial step is finding willing buyers.
•Most voluntary, private-driven PES schemes have been
small, have high transaction costs and deliver modest
rural incomes and modest conservation gains.
•Government-driven PES schemes have tended to be
larger and deployed faster, and they have resulted in
improved forest practices in some instances.
•Regulation-driven PES with private buyers (e.g. markets
for carbon credits) have generated high expectations
that have yet to be fully realized.
•PES schemes require supportive legal and institutional
frameworks, clear property rights and assistance to
small farmers and rural communities.
•National governments remain the most important
source of funding for PES programmes, with the
international community acting as a catalyst.
•Ecosystem service payments may be insufficient to
provide incentives for forest conservation where there
are high opportunity costs for land.
BOX 33 Key lessons on developing payment for environmental services schemes
SOURCE: FAO, 2007d.
STATE OF THE WORLD’S FORESTS 2009
76
Nevertheless,developingasystemofpaymentsfor
watershedservicesentailsanumberofchallenges,suchas:
• lackofclarityaboutthehydrologicalprocesses
involvedand,inparticular,theimpactofdifferent
landusesonthequantity,qualityandregularityof
waterow;
• publicoppositionrelatedtoprivatization,
perceptionsthataccesstowaterisafundamental
rightandconcernsaboutthepotentialforincreased
inequities(i.e.thatpaymentsystemsmightimpede
poorpeople’saccesstowater);
• hightransactioncostsforthedevelopmentofPES,
especiallyforlargewatershedswithmanyproviders
andusersofwatershedservices.
Consequently,marketmechanismsfortheprovision
ofwatershedservicesarestillintheearlystagesof
development.Mostoftheexistingarrangementsare
eitherbetweensmallgroupsofusersandprovidersthat
caninteractefciently,orestablishedbylargeelectricity
orwaterutilitiesthatcanlevythenecessarycharges
andchannelthefundstothoseundertakingwatershed
conservation.
Carbon markets and forestry
Paymentforcarbonsequestrationtomitigateclimate
changeisoneofthefastest-growingenvironmentalmarkets.
UndertheKyotoProtocol,threeexiblemechanismswere
created:theCleanDevelopmentMechanism(CDM),joint
implementationandemissiontrading.UndertheCDM,
AnnexI(industrialized)countriesmayoffsetacertain
partoftheiremissionsthroughinvestmentincarbon
sequestrationorsubstitutionprojectsinnon-AnnexI
(developing)countriesandthusacquiretradablecertied
emissionreductions.Underjointimplementation,
AnnexIcountries
mayjointlyexecutecarbonsequestration
orsubstitutionprojects.Emissiontradingpermitsthe
marketingofcertiedemissionreductions.
Carbonmarketscomprisethecompliancemarket
(whichfollowsstringentrulesundertheKyotoProtocol)
andthevoluntarymarket.In2007,thetotalcarbon
market(includingallvoluntaryandcompliancemarkets)
amountedtoUS$64billion,morethandoublethe2006
total(Hamilton
et al.,2008).Thevoluntarycarbonmarket,
whereasizeableshareofcarboncreditscomesfrom
forestactivities,alsodoubledintermsofemissionstraded
(65milliontonnesofcarbondioxideequivalentin2007),
andtripledintermsofvalue(US$331million)(Box34).
Whiletheappealofafforestationandreforestation
asaclimatechangemitigationstrategyisconsiderable,
forest-basedcarbonoffsetprojectsfaceseveralchallenges,
includingsettingbaselines,permanence,leakageand
monitoringconstraints.Theproblemsareparticularly
severeincountrieswithhighdeforestationrates,which
usuallyalsohavemajorpolicyandinstitutionalconstraints.
Theseissueshavehinderedamoreprominentrolefor
forestsinclimatechangemitigationundertheCDM(one
reforestationprojectoutof1133registeredprojectsasof
August2008).
FollowingthethirteenthsessionoftheConferenceof
thePartiestoUNFCCCinBali,Indonesia,in2007,many
highhopesweregeneratedontheinclusionofREDDinthe
post-Kyotoclimatechangemitigationefforts.Theeconomic
Reduction in emissions from deforestation and forest
degradation is generally recognized as a relatively low-
cost greenhouse gas mitigation option. About 65 percent
of the total mitigation potential of forest-related activities
is located in the tropics, and about 50 percent of the total
could be achieved by reducing emissions from deforestation
(IPCC, 2007) – which would also provide other benefits and
complement the aims and objectives of other multilateral
environmental agreements while addressing some of the
needs of local and indigenous communities.
At the Climate Change Conference in Bali, Indonesia, in
December 2007, countries adopted a decision on reducing
emissions from deforestation in developing countries.
Governments are encouraged to seek to overcome the
barriers to implementation (lack of effective institutional
frameworks, adequate and sustained financing, access
to necessary technology and/or appropriate policies and
positive incentives) through capacity building, provision
of technical assistance, demonstration activities and
mobilization of resources.
Several governments have already announced their
willingness to support such activities, to provide funds and
to address outstanding methodological issues (related
to assessment of changes in forest cover and associated
forest carbon stocks and greenhouse gas emissions,
reference emission levels, estimation of emissions from
forest degradation, implications of national and subnational
approaches, etc.). Several organizations have also launched
initiatives to assist developing countries in these efforts.
Opportunities for collaboration should be explored to ensure
that efforts are complementary and to maximize the benefits
for all countries involved.
n
Reducing emissions from deforestation and forest degradation
From the United Nations Framework Convention on Climate Change (UNFCCC)
Views from CPF partners
PART 2 Adapting for the future
77
Meeting the demand for environmental services of forests
andscienticrationaleforREDDhasbeenwellarticulated
inthattheforestsector(mainlydeforestation)accounts
formorethan17percentofgreenhousegasemissionsand
thataddressingdeforestationanddegradationwouldbea
morecost-effectivemitigationoptionthanbringingabout
changesinenergyuse.However,providingincentives
todesistfromdeforestationinvolvescomplexpolicy,
institutionalandethicalissues(Martin,2008).
Biodiversity conservation
Biodiversityconservationhaslargelybeeninthepublic
domain,primarilythroughestablishmentandmanagement
ofprotectedareas.However,aspublicfundingbecomes
insufcienttosupportbiodiversityconservation,many
The year 2010 will be celebrated the world over as the
International Year of Biodiversity. This occasion should be
used as a starting point for a more sustainable relationship
with our forests.
Forests are home to two-thirds of all terrestrial
species. If we are to achieve the 2010 target to reduce
the loss of biodiversity significantly, all governments
and relevant organizations must redouble their efforts
to halt deforestation and to manage forests sustainably.
For example, market failures that stand in the way of
appreciating the real value of forests need to be addressed.
Biodiversity and the numerous ecosystem services that
forests provide must be properly accounted for, and they
must be marketed. Forest governance must be improved
and the management of forests must become a matter
of societal choice. In addition, information about the
importance and value of forests must reach key decision-
makers. The CBD programme of work on forest biodiversity
(which was reviewed by the ninth meeting of the
Conference of the Parties in Bonn, Germany, in May 2008)
addresses all of these issues.
In a context of rising demand for wood products,
planted forests will meet a greater part of timber needs in
the future. Hence, it is important to ensure that planted
forests increasingly fulfil biodiversity objectives, for example
by forming ecological corridors between protected areas.
New methods and technologies will make it possible to
establish planted forests exclusively on degraded lands,
without damage to primary forests. Primary forests will
serve mostly as reservoirs for biodiversity and as storage
space for carbon.
n
Primary forests, planted forests and biodiversity objectives
From the Convention on Biological Diversity (CBD)
Views from CPF partners
Voluntary carbon markets, or the exchange of offsets by
entities not subject to greenhouse gas emission caps, have two
components:
•the structured and monitored cap-and-trade system of the
Chicago Climate Exchange (CCX);
•the more disaggregated over-the-counter (OTC) system,
which is not driven by an emissions cap and does not
typically trade on a formal exchange.
In 2007, 42.1 million tonnes of carbon dioxide
equivalent (CO
2
e) were transacted on the OTC market and
22.9 million tonnes on the CCX, representing a tripling of
transactions for the OTC market and more than a doubling for
the CCX since 2006.
Within the larger OTC voluntary market, forestry projects
(which include afforestation and reforestation of both planted and
natural forests and avoiding deforestation efforts) accounted for
18 percent of transactions in 2007, down from 36 percent in 2006.
Projects for avoiding deforestation increased from 3 percent of
the volume in 2006 to 5 percent in 2007. Forestry projects and
particularly those involving afforestation or reforestation remained
among the highest-priced project types in 2006 and 2007, with
weighted average prices of US$6.8–8.2 per tonne of CO
2
e.
BOX 34 Forests and voluntary carbon markets
SOURCES: Gorte and Ramseur, 2008; Hamilton et al., 2008.
countrieshavemadeeffortstoidentifyalternativeways
tonanceit,includingthroughsystemsofpayment
fortheservicesprovided.Suchsystemsarecompatible
withobjectivesofincreasedcommunityparticipation
inbiodiversityconservation.Examplesincludeprivate
protectedareas,whichdependonvisitorfeesasthemain
sourceofincome.
Paymentsystemsforconservationarediverse(Jenkins,
ScherrandInbar,2004),including:
• outrightpurchaseofhigh-valuehabitat;
• paymentforaccesstopotentiallycommercialspecies
orhabitat;
• paymentinsupportofmanagementthatconserves
biodiversity;
STATE OF THE WORLD’S FORESTS 2009
78
• tradabledevelopmentrights;
• supportforenterprisesthatadheretoconservation
principlesintheirbusinesspractices.
Eachoftheserequiresaspecicpolicyand
institutionalframework.
Themarketforbiodiversityconservationisstill
nascent.Mostofthepurchasesofhigh-valuehabitats
(oftenunderdebt-for-natureswaps)arebyinternational
agenciesincludingnon-governmentalorganizations
(NGOs)andfoundations.Conservationeasements,under
whichprivatelandownerssurrendercertaindevelopment
rightstoprovideenvironmentalbenetsinperpetuityin
returnforcompensation(includingtaxexemptions),are
widelyadoptedintheUnitedStatesofAmerica(TNC,
2004).
Other compensation arrangements
Somecountries,whenunabletoavoidthedevelopment
offorestsorotherhabitats,compensatefortheloss
bysupportingconservationinotherlocations.Such
arrangementsinvolvetransferpaymentsthatarenot
necessarilylinkedtothequantityorqualityoftheservice
deliveredandarenottruemarketsfortheprovisionof
environmentalservicesintheconventionalsense.A
typicalexampleiswetlandmitigationbankinginthe
UnitedStatesofAmerica,inwhichunavoidableimpacts
onaquaticresourcesarecompensatedbyestablishing,
enhancingorconservinganotheraquaticresourcearea
(USEPA,2008).
Anotherexampleisthecompensatoryafforestation
programmeinIndiaunderwhichanydiversionofpublic
forestsfornon-forestrypurposesiscompensatedthrough
afforestationindegradedornon-forestland.Funds
receivedascompensationareusedtoimproveforest
management,includingafforestation,assistednatural
regeneration,managementandprotectionofforests,and
watershedmanagement.Agovernmentauthorityhasbeen
createdspecicallytoadministerthisprogramme
(SMEToolkitIndia,2008).
SOCIO-ECONOMIC ASPECTS
Supportforprovisionofenvironmentalservicesandthe
appropriatenessofregulatoryandothermeasuresneed
tobeconsideredinthelargersocio-economiccontext.
Countriesandsocietieswithhigherincomestendtobe
morewillingtopayforenvironmentalservices.Low-income
countriesmayhavedifcultygivingprioritytoprovision
ofenvironmentalservices,especiallywhentheyfacemore
economicallyattractivedevelopmentoptions(Box35).
ThisraisesthequestionofthepotentialroleofPES
inpovertyalleviation(FAO,2007e).Therearesome
indicationsthatthepoormaynotbenetparticularlyfrom
ecosystemmarkets(FAO,2004).Theconcernistoensure
thatthepaymentsfortheenvironmentalservicesactually
gotothefarmerswhoprovidetheservicesbyadopting
appropriatelanduse.However,theirabilitytoprovidethe
servicesdependslargelyonrightstoandownershipofthe
land,aswellasotherpolicyandinstitutionalfactorsthat
determinethetransactioncosts.Consequently,itisoften
thelargelandownersthatareabletotakeadvantageofPES
arrangements.
Anadditionalconcernisthat,giventhesocialand
economicinequitiesthatexistinmostcountries,when
marketsdevelopandprotscanbemadebyselling
ecosystemservices,theaccessofpoorpeopletothese
servicesmaybereduced.
Achiefimpedimenttotheprovisionof
environmentalservicesthroughexistingapproaches
isthehightransactioncost.Environmentalmarkets
aremoresophisticatedandcomplexthancommodity
markets,requiringsubstantialinformationontechnical
aspectsofprovisionofservicesandwell-developed
institutionalandlegalarrangements.Thisagainsuggests
theenormouseffortrequiredtodevelopeffective
measurestoprovideenvironmentalservicesinmost
developingcountries.
Conversion of biodiversity-rich delta to sugar-cane
plantations
Kenya has recently embarked on a large-scale sugar
plantation, converting about 2 000 km
2
of the pristine Tana
River Delta, which provides habitat for a large number of
species and a source of livelihood to local communities.
The objections of conservationists and local communities
have led to judiciary intervention, delaying project
implementation.
Closure of sugar-cane plantations for wetland
restoration
The United States Sugar Corporation, the largest
producer of cane sugar in the United States of America,
has agreed to close down about 750 km
2
of sugar-cane
plantations to help in the restoration of the Everglades
wetlands. The State of Florida will pay the company
an estimated US$1.75 billion in order to purchase
the land.
SOURCES: Environment News Service, 2008a, 2008b.
BOX 35 Willingness and ability to pay for
conservation
PART 2 Adapting for the future
79
Meeting the demand for environmental services of forests
OUTLOOK
Theoutlookfortheprovisionofenvironmentalservicesismixed.
Growthinincomecoupledwithgreaterawarenesswillusually
strengthendemandforenvironmentalservicesaswellasthe
abilityofasocietytomeetthecostsofenvironmentalprotection.
However,increasedincomeoftenreducesenvironmental
servicesasmoregoodsandservicesareproduced.Inparticular,
countrieswithrapidlygrowingeconomiesoftengothrougha
periodwhenforestresourcesareexploitedorconvertedtoother
uses,resultinginadeclineinenvironmentalservices.
Thereisnosinglesolutionappropriatetoallcontexts.
Bothmarketandnon-marketapproacheshavetheir
strengthsandlimitations.Itisoftenassumedthat
economicgrowthisaprerequisiteforimprovingthe
environment,buttherealityismorecomplex.Many
factors,includinginstitutionsandlegalframeworks,will
haveanimpactontheabilityofacountrytomanageits
forestsinsuchawayastoprovidestableorincreasing
environmentalservices.
STATE OF THE WORLD’S FORESTS 2009
80
I
nstitutionsarekeytosustainableresourcemanagement
andsocietaladaptationtosocial,economicand
environmentalchanges.Asinothersectors,theoverall
trendinforestryistowardsapluralisticinstitutional
environment,attributabletotwodivergenttrends:
globalizationandlocalization.Increasedcross-border
movementofcapital,labour,technologyandgoods
resultingfromglobalizationhasnecessitatedadaptation
byexistinginstitutionsandtheestablishmentofnew
ones.Atthesametime,localcommunitieshavebecome
moreinvolvedinresourcemanagementthrough
decentralizationanddevolutionofresponsibilities.While
thereareconsiderabledifferencesacrosscountriesand
regions,thischaptersummarizeshowinstitutionsinthe
forestsectorarerespondingtotheemergingdevelopments
outlinedinPart1.
INSTITUTIONAL CHANGE IN FORESTRY:
AN OVERVIEW
Beforethe1990s,theforestsectorwasdominatedby
governmentforestryagencies,severallargeenterprises,
amultitudeofsmallandmediumenterprises(many
operatingoutsidetheformalsystem)andafewinternational
organizationslargelyfocusedonprovidingtechnicalsupport
topublicforestryagencies.Today,theforestsectoris
characterizedbyagreaternumberofinstitutionsaddressinga
widerarrayofissues(Box36).
Theprivatesectorandcivil-societyorganizations
haveexperiencedsignicantgrowthsincethe1990s,
particularlyasaresultof:
• thepoliticalandeconomicchangesfollowingthe
collapseoftheSovietUnion,especiallytheshift
fromcentralizedplanningtomarket-oriented
economicpoliciesandglobalization;
• growthinenvironmentalawarenessandconcerns
andtheproliferationofrelatedinitiativesfollowing
theUnitedNationsConferenceonEnvironmentand
Development(UNCED)in1992;
• changesinfundingforforestry,i.e.increasesin
foreigndirectinvestmentsandprivate-foundation
support(Box37)alongsidedecreasesinofcial
developmentassistance.
Developmentsininformationandcommunication
technologieshavefurthercatalysedinstitutionalchanges,
challenginghierarchicalstructuresandcallingfor
institutionstorespondtothedemandsofamoreinformed
public(seeBox45onpage88).
Changing institutions
Public forestry agencies and enterprises
•National policy formulation, legislation and planning,
including national forest programmes
•Management of forests and forest industries and all
related activities, including trade in forest products
•Regulatory and enforcement functions – providing
a level playing field to other institutions involved in
forest and tree resources management
Private sector
•Management of forests and other resources, including
planted forests
•Production and processing of, and trade in, wood and
non-wood products
Civil-society organizations
•Environmental and social advocacy in policy and
market development and awareness generation
Informal sector
•Production and processing of, and trade in, wood and
non-wood products
International and regional organizations and
initiatives
•Intergovernmental forest policy, environment- and
trade-related processes and conventions
•Financing, development and technical assistance,
including technology transfer
•Regional collaboration arrangements
•Science and technology development and networking
BOX 36 Types of institutions dealing with forest
issues
PART 2 Adapting for the future
81
Challengesofreducedpublicexpenditure,mounting
expectationsofdifferentstakeholdersandincreasing
conictsovertheuseofforestresourcesarestirring
publicagenciestorethinktheirmanagementobjectives,
functionsandstructures(FAO,2008h).Theevolutionin
focuscanbelooselydescribedasmovingfrompolicingthe
foreststomanagingthemtofacilitatingmanagementby
others(Table26).
The United States of America has the largest segment of
private foundations supporting development activities. In
2005, they provided grants of an estimated US$3.8 billion
(US$1.6 billion in 1998). Almost half of the support is in
the field of health (largely because of the huge support
provided by the Bill & Melinda Gates Foundation).
Environment accounted for about 10.4 percent of the
number of grants in 2004.
SOURCE: Renz and Atienza, 2006.
BOX 37 Growth of private foundations in
the United States of America
In most countries, the public forestry administration
has traditionally had a research arm, but institutional
arrangements for research are changing. Research
is increasingly carried out by government-funded
independent organizations, universities and the
private sector, often through collaborative networks.
It is increasingly demand-driven rather than supply-
driven. However, these changes raise concerns about
imbalances in investments. Support for basic and
strategic research has been declining, with more
attention focused on applied and adaptive research that
yields immediate returns. Furthermore, the results of
private-sector research are often not publicly
available.
BOX 38 Declining public forestry research
PUBLIC AGENCIES
Governmentforestryagenciesremainthedominantforce
inthesector.Morethan80percentofglobalforestsare
underpublicjurisdiction(FAO,2006a).
Governmentforestrydepartmentsareoftenamong
theoldestofthecivilservices.Manyoriginallyfocused
onenforcingregulations,withthemainobjectiveof
protectingandmanagingtheforeststosupplyforest
productsandgeneraterevenueforgovernment.They
traditionallyintegratedmultiplefunctionsfrom
woodproductiontoprocessingandtradeaswellas
forestryresearch(seeBox38),education,trainingand
extension.
TABLE 26
Progression in the development of public forestry agencies
Stage Objectives of resource management Functions and structures
Protecting To utilize what grows under natural conditions (e.g. to log
natural forests)
To safeguard future timber supplies for strategic reasons
Policing of the forest estate
Hierarchical structure
Managing To improve the state of resources by investing in
improved management
To create assets, including planted forests
Production and resource management
Emphasis on technical and managerial skills
Enabling others
to manage
To support or empower other players (private sector,
communities, farmers, etc.) to manage resources and
regulatory functions
Creation of enabling conditions
Negotiation, facilitation and conflict resolution
Emphasis on diversity of skills and quick response to needs
of various stakeholders
STATE OF THE WORLD’S FORESTS 2009
82
Insomecases,reformhasbeensupercial;for
example,limitedtochangesinministerialresponsibility
(inparticularshiftingbetweenagricultureand
environmentministries)ortostructuralbutnotfunctional
change.Manypublicagenciesareunabletodevelop
thehumanresourcesneededinordertomanageforest
resourcesinanincreasinglycomplexenvironment(Nair,
2004;Temu,2004),andmanylacksufcientcapacity
forlong-termstrategicplanningoropensharingof
information,withatendencytobereactivetoshort-term
pressuresandconcerns(oftenmirroringthelargerpublic
administration).
Strategiesusedinmoresuccessfultransitionstoan
enablingrolehaveincluded:
• separatingpolicyandregulatoryfunctionsfrom
managementfunctions;
• entrustingwoodproductionandprocessingtoan
independentcommercialgovernmententityor
privatizingallcommercialactivities,usuallyaspart
ofalargerpolicyofeconomicliberalization,often
triggeredbygovernmentbudgetarycrises(asinthe
caseofNewZealand[O’Loughlin,2008]);
• decentralizinganddevolvingmanagement
responsibilitytothelocallevel(Box39),usually
aspartofalargerprogrammeofpoliticaland
administrativedecentralization–withwidely
differentresults.
PRIVATE SECTOR
Privateenterprisesrangefromindividualandhousehold
microenterprisesandsmallfarms,oftenoperatingona
minimalbudget,tolargetransnationalcorporations,whose
annualturnoverinsomecasesexceedstheGDPofasmall
country.
Corporate sector
Thecorporatesectoraccountsforalargesegmentof
loggingconcessions,plantedforestsandwoodindustries.
Protabilityremainsitsprimaryobjective.Corporations
operateinanextremelycompetitiveenvironmentwith
constantpressurestocutcostsandimprovemarketshare.
Thefollowingaresomeofthesector’smajorchallenges
andopportunities:
• RapidgrowthofemergingeconomiesinAsiais
resultinginaregionalshiftinthedemandforwood
products(seethechapter“Globalwoodproducts
demand”inPart2).Investmentsinnewcapacity
aretakingplaceincountrieswheredemandand
protabilityareperceivedtobehighandthecostsof
production–especiallyofbre,energyandlabour–
arelow.Inparticular,thepulpandpaperindustry
hasseenaspateofmergersandacquisitionsandthe
closureofless-competitivemills.
• Pressureforindustrytoadheretotenetsofcorporate
socialresponsibilityisexpectedtomountassociety
becomesmoreconcernedaboutenvironmentaland
socialissues(Box40).“Green”valueswillinuence
procurementofgoodsandservicesalongthewhole
supplychain.Consumerpreferenceisshiftingin
favourofcertiedproducts,butthisisnotalways
reectedinhigherprices.
• Climatechangeconcernsareexpectedtoprovide
newopportunitiesforwoodproducts(whichstore
carbonandrequirerelativelylittleenergytoproduce)
andindustrialwoodenergy.Majorrelatedchallenges
includeincreasingtransportcostsowingtotherapid
expansionofglobalvaluechainsandincreasing
demandforwood.
Strategiesforadaptationtotheabovechallengesinclude:
• Focusoncorebusinessanddivestmentofnon-core
activities:Thetraditionalmodeloflargeintegrated
industrialunitsisgivingwaytohighlynetworked
globalsupplychains,linkingrmsandafliates
acrosscountries,includingsubcontractorsand
homeworkersoperatingoutsidetheformalsystem.
Componentsofproductionmayberelocatedabroad
forimprovedprotability.Woodproductionmay
beoutsourcedtofarmersthroughpartnership
arrangements.Forestproductcompaniesincreasingly
recognizethattyinguplargestocksofcapitalin
forestownershipaffectstheirshort-runcashow
External to the forest sector
• Significant transfer of power and responsibilities
to democratically elected and accountable lower
levels of government
• Fair and clear enforced property rights and an
appropriate regulatory framework
• Respect of the law by governments, the private
sector and civil society
• Effective linkages between government, the private
sector and civil-society institutions
Internal to the forest sector
• Effective and balanced distribution of
responsibilities and authority among different levels
of government
• Adequate resources and institutional effectiveness
at each level of government
• Sufficient participation of civil society and the
private sector at all levels
SOURCE: Contreras-Hermosilla, Gregersen and White, 2008.
BOX 39 Elements of successful decentralized
forest governance
PART 2 Adapting for the future
83
Changing institutions
andstockmarketvalues.Divestmenthasledtothe
emergenceofnewplayers(Boxes41and42).
• InvestmentinR&D:Thecorporatesectorleads
investmentinR&D,focusingonappliedandadaptive
researchandonthedevelopmentofnewproducts
andprocessestoestablishcompetitiveadvantageand
tomeetconsumers’environmentaldemands.The
sectoroftentakesadvantageofresultsfrompublic
research.Plantedforestsmanagedbythecorporate
sectorareamongthemostproductive.
Other private and community-based enterprises
Globalizationprovidesnewopportunitiesforsmall
andmediumenterprises,buttheywillneedtoadapt
continuouslytosurviveintensifyingcompetition.Issues
affectingthelong-termperformanceofthisvibrant
institutionalsegmentinclude:
• Ownership,legalframeworkandlevelplayingeld:
Ownershipandsecurityoftenurearenecessary
forthedevelopmentofanyenterprise.Policiesand
legislationvaryintheextenttowhichtheyprovide
landrightstolocalcommunities.Inmanycountries,
rulesandregulationsarecraftedtotheneedsoflarge
enterprises,leavingsmallandmediumenterprises
andcommunityinstitutionsatadisadvantage.
• Constraintsoneconomicviability:Localcommunities
oftenhaveaccesstoonlythemostdegradedand
leastproductiveland,whichcannotprovidebenets
commensuratewiththeinvestmentsrequired.They
oftenlackaccesstoinputs(includingcredit)and
markets.Manysmallenterprisesfocusonproductionof
low-value-addedproducts,whichseldomhelptoenhance
income.Localmarketsfaceincreasingcompetitionfrom
globalsuppliers.Theinadequacyofentrepreneurial
skillstodealwithchangingopportunitiesandchallenges
remainsthemostcriticalconstraint.
The overarching focus on profitability in the private sector
often results in high social and environmental costs. As
society’s awareness of these costs increases, pressures
mount on the private sector to abide by environmental and
social regulations. Industry may also find it advantageous
to project a green image, especially among environment-
conscious consumers. Industry organizations have
developed a number of criteria relating to corporate social
responsibility, and green auditing is becoming mandatory. In
Rome in 2006, chief executive officers from 61 companies
belonging to the International Council of Forest and Paper
Associations signed a commitment to global sustainability.
The World Business Council for Sustainable Development
has prepared guidelines on sustainable procurement of
wood and paper products that address environmental
and social aspects (WBCSD and WRI, 2007). Increasing
environmental awareness and easy access to information
will help to ensure that industry no longer neglects its
responsibilities through superficial “greenwashing”.
BOX 40 Corporate social responsibility
Most investments in planted forests have traditionally been
made by government, smallholder or industrial forest owners.
However, management arrangements such as timber
investment management organizations (TIMOs) and real
estate investment trusts (REITs) have created a significant shift
in forest ownership from industries to institutional investors,
primarily in North America but also in Australia, Finland,
New Zealand, South Africa and Sweden. Investment by
institutions in planted and managed native forests increased
worldwide from less than US$1 billion in 1985 to more than
US$30 billion in 2007. The number of TIMOs grew from
two or three in the 1980s to more than 25 in 2007. About
20 million hectares of private forest land are under TIMO
control. In the United States of America, forest landownership
by integrated forest companies (those involved in both
production and processing) declined from 19.5 million hectares
in 1994 to 4 million hectares in 2007 (Neilson, 2007).
Some observers are concerned that the increase in
forest ownership by wholly profit-seeking institutional
investors could undermine long-term investments in
forest management and research and also accelerate
commercial development of private forest lands. However,
the growth of TIMOs appears to be slackening because of
the limited area available for sale.
SOURCES: FAO, 2007f; Sample, 2007.
BOX 41 Institutional investors: TIMOs and REITs
Since 2001, foreign exchange reserves have grown rapidly,
far beyond the established benchmarks of adequacy.
The sovereign wealth fund (SWF) is a vehicle established
by some governments to channel these reserves into
investments. In the first quarter of 2008, the total assets
held by 51 SWFs were estimated at US$3.5 trillion, and
these assets are projected to grow to about US$5 trillion by
2010 and US$12 trillion by 2015. SWFs invest in many asset
classes including real estate, plantations and government
bonds. Four SWFs have already invested in timber lands.
SOURCES: FAO, 2007f; Friday Offcuts, 2008.
BOX 42 Sovereign wealth funds: an emerging
player in forestry investment
STATE OF THE WORLD’S FORESTS 2009
84
• Governanceanddistributionofbenets:Insome
localcommunityenterprises,powerimbalanceslead
toinequitabledistributionofbenets,undermining
long-termsustainability.Thisproblemisparticularly
severewheredemocratictransparentsystemsof
managementandaccountabilityarelackingandlocal
vestedinterestsdominate.
Factorsthathavehelpedsmallandmediumenterprises
copesuccessfullywiththechallengesinclude:
• improvedaccesstoinformationandopportunities
createdbytheInternet,e-tradingandothertools;
• upscalingofbusinessactivitiesthroughassociations
andfederationsandimprovementofaccessto
markets,inputsandservices;
• increasedeffortstodeveloptechnologiesappropriate
totheneedsofsmallandmediumenterprises;
• rapidlyrisingtransportcosts,makinglocalvalue
chainsmorecompetitive.
Strongerinstitutionalarrangementsarecriticaltothe
scalingupofoperationsandimprovedbargainingpower.
Moreover,theyenablecommunitiestotakeadvantageof
newtechnologies,whicharevitaltomakingcommunity-
basedresourcemanagementeconomicallyviable.
CIVIL-SOCIETY ORGANIZATIONS
Inrecentdecades,civil-societyorganizationshavebecome
majorplayersinforest-relatedissuesinmostcountries,often
challengingestablishedpositionsandincreasingtransparency.
Theyhaveemergedasoneofthemainforcesreshapingthe
futureofforestryatalllevels–local,nationalandglobal.
Indigenouspeoples’groupshaverisenfromlocallevels
tobecomeeffectiveactorsandadvocatesatthegloballevel
throughcoalitionspresentingauniedfrontanddelivering
consistentmessagesininternationalmeetingsand
processes.Theirorganizedeffortshaveledtoprogressin
recognizingandrestoringtherightsofindigenouspeoples
toforestland.Theadoptionin2007oftheUnitedNations
DeclarationontheRightsofIndigenousPeoples,although
non-binding,wasamilestone.
Communityforestryandcommunityconservation
organizationsinclude:federations(Box43);networksof
localcommunityorganizations,advocacyandnetworking
organizations,suchastheForestPeoplesProgramme;
andcoalitions,suchasFriendsoftheEarthInternational,
theWorldRainforestMovementandtheGlobalForest
Coalition.Reectingthegrowthofcommunityforestry
aroundtheworld,thesegroupsstresstheconnection
betweenforestsandlivelihoods.
InternationalenvironmentalNGOs,suchastheWorld
WideFundForNature,ConservationInternational,The
NatureConservancy,theWildlifeConservationSociety
andtheInternationalUnionforConservationofNature
(IUCN)(anumbrellagroupofwhichalltheothersare
members),arethemostwell-fundedandperhapsthemost
effectivecivil-societyactorsinforestry.Althoughdifferingin
perspectivesandapproach,thesegroupsfocusattentionon
conservingbiologicaldiversity,extendingprotectedareas,
drivingforestcerticationandimprovingforestgovernance
toreduceillegalloggingandtradeinendangeredspecies.
Arelatedgroupconsistsofcivil-societyorganizations
thatpromotemarket-basedapproachestoconservationand
sustainableforestmanagement,suchascertication,fair
trade,organicandsustainableagriculture,ecotourismand
greeninvestments.Someoftheseorganizations,including
FSCandPEFC,havebroughtaboutchangesinthe
behaviourofproducersandconsumersofforestproducts.
AnumberofinternationalenvironmentalNGOs,for
exampletheInternationalInstituteforEnvironmentand
Development(IIED)andtheWorldResourcesInstitute
(WRI),functionas“thinktanks”,enhancingknowledgein
keyareas.
Inaddition,complexwebsofnational,regionaland
globalnetworks,manystillrelativelyinformal,link
farmers,forest-dependentcommunities,smalltradersand
localactivists.Thesealliancesarenolongerstrictlythe
domainoflargeinternationalconservationorganizations
andmajordevelopmentgroups.
Overall,civil-societyorganizationsformastrong
counterforceagainstpowerfulplayerssuchasgovernments
andthecorporatesector.Theireffectivenessstemslargely
from:
• closecontactwithgrassrootsandunderstandingof
localissues;
• multidisciplinaryapproachestoresource
managementissues;
The Federation of Community Forest Users Nepal
(FECOFUN), a forest-user advocacy organization founded
in 1995, provides national representation of local people’s
rights in resource management. Comprising rural farmers –
men and women, old and young – from almost all of
Nepal’s 75 districts, FECOFUN exemplifies the evolution
and maturation of a community-based group into an
important rural institution. Indeed, it is Nepal’s largest civil-
society organization.
FECOFUN and community forestry in Nepal owe their
success to recognition of rural people’s dependence
on forests and to institutional incentives structured in
accordance with rural realities.
SOURCE: FECOFUN, 2006.
BOX 43 A federation of forest communities
in Nepal
PART 2 Adapting for the future
85
Changing institutions
• effectivecommunicationwithstakeholdersand
fundingsources;
• skilfuluseofnetworksandassociationsand
developmentofstronglinkageswithotherplayers;
• theirdetailedresearchonkeyissuesanditsusein
supportoflocalaction.
Increasingawarenessandconcernaboutsocialand
environmentalissuesimplyanincreasingroleforcivil-
societyorganizationsinforestry.
Theshifttowardsinstitutionalandeconomic
complexityshouldmirrormoreeffectivelytheecological
andculturaldiversityofforestsandpeoples.Such
complexityisneededinordertohelpforestsfulltheir
integratingroleinadispersed,diversiedanddistributive
foresteconomy.Civil-societyactorsinjectmuch-needed
disorderintointentionallyneatpowerequations
(J.Campbell,personalcommunication,2008).
INFORMAL SECTOR
Thedividinglinebetweentheformalandinformalsectors
issometimesblurred,especiallyasmanysmalland
mediumenterprisesoperateoutsidetheformalrealm.
Playersoutsidetheformalsectorrangefromtraditional
localforestmanagementarrangementsthathavebeen
pushedintotheinformalrealmbyrestrictivegovernment
regulationstoillegalloggingnetworksthatexploitweak
institutionalarrangementsinmanycountries.
Althoughitisdifculttodenetheextentofits
reach,theinformalsectorcontinuestobesignicant
worldwide.TheInternationalLabourOrganization
estimatesthatforeveryjobintheformalsectorinforestry
thereisanotherone(ortwo)intheinformalsector(ILO,
2001).Mostoftheseareinproductionorcollectionof
woodfuelandNWFPs.Unpaidsubsistencework,primarily
inwoodfuelharvesting,isestimatedtoemployabout
14millionworkers(full-timeequivalents),ofwhom
90percentareindevelopingcountries.Informalsector
employmentisoftendominatedbywomen.
Manysmallforestenterprisesoperateinformally,
largelybecauseofill-denedpropertyrightsandan
unfavourablebusinessenvironmentwithhighbarriersto
entryandconcomitanttransactioncosts.Theinformal
sectordominatesincountrieswhereregulationsare
cumbersomeandinexible(WorldBank,2006).
Increasingpressurebytheformalsectortoreducecosts
isencouragingthegrowthoftheinformalsector.Work
isoftenoutsourcedtormsoutsidetheformalsector
thatcutproductioncostsbyfailingtoabidebysocialand
environmentalnorms.
Thekeyissueiswhethergovernmentswillmake
signicanteffortstocreateafavourablebusiness
environmentbyremovingbarriersrestricting
entrepreneurship.Improvedaccesstocredit,marketsand
technologycouldpotentiallymovesomeplayersfromthe
informaltotheformalsector.
Alsokeyareconcertedeffortstoaddressillegallogging,
whichcurrentlyincludeintergovernmentalforestlaw
enforcementandgovernanceprocesses,trackingand
vericationsystemsandanti-money-launderingmeasures.
INTERNATIONAL ORGANIZATIONS
Althoughlessquicktoadaptthanprivate-sectoror
civil-societyorganizations,internationalforest-related
organizationshaveevolvedinthepasttwodecades.
Before1990,theUnitedNations(UN)andother
intergovernmentalorganizations,internationalresearch
andnancingorganizationsandbilateraldonoragencies
providedmainlytechnicalsupport,primarilyfocusedon
productionofwoodproducts.Thepriorityareaswere
silvicultureandforestmanagement,forestindustries,
research,education,trainingandextension.
SincetheUNCEDin1992,undertheoverarching
objectiveofsustainableforestmanagement,international
organizationshavebroadenedtheiragendatoaddressa
widerarrayofsocial,economicandenvironmentalissues.
Newtypesofinternationalinstitutionshaveemerged(UN
forestpolicyprocesses,environmentalconventionsand
agreementsandregionalintergovernmentalprocesses)and
initiativesandpartnershipshavemultiplied.Programmes
placemoreemphasisonsupporttopoliciesand
institutions,withincreasedfocusongovernance,poverty
alleviationandmorerecentlyonintegratingforestryin
theframeworkoftheMillenniumDevelopmentGoals.
Withgrowingconcernaboutclimatechange,thepursuit
ofmitigationandadaptationmeasuresisanemerging
priority.
Theproliferationofinstitutionsandinitiativeshas
necessitatedsubstantialeffortstominimizefragmentation
andavoidduplication.Duplicationisahazardbecause
constituentscommonlyaskorganizationstotakeupthe
latest“hot”issue–andorganizationsneedtoworkwhere
thereisfunding,whichagaintendstobeavailablefor
thesehotissues.Fragmentationattheinternationallevel
accentuatesproblemsatthecountrylevel,especiallywhere
developmenteffortsarecompartmentalizedindifferent
sectors.Thecapacitytocoordinateisinshortsupplyin
countrieswhereproblemsaremostacute.
Effortstoaddressfragmentationandduplication
includethe“OneUN”approach(UN,2006b),which
aimstocoordinatethedisparateactivitiesofthevarious
UNagenciesatthecountrylevel,andtheCollaborative
PartnershiponForests(CPF)–anexampleofcoordinated
supportfortheinternationalforestpolicyprocess
(Box44).
STATE OF THE WORLD’S FORESTS 2009
86
Theacceleratingpaceofglobalizationandthe
emergenceofahostoftransboundaryeconomic,social
andenvironmentalissuesneedtobeaddressedbyeffective
internationalinstitutionalarrangements.Someofthe
likelychangesinthenextfewyearsmaybe:
• consolidationofinstitutions,inresponsetoresource
constraintsandpressuretoseeconcreteresultson
theground;
• ashiftfromprocessestotangibleoutputsandresults,
asdemandedbyamoreinformedsociety;
• increasingemphasisonregional,subregionaland
othergroupinitiativestoenablecountrieswith
similarviewsandperceptionstoaddressshared
problems,andincreasedattentiontoforestryissues
byregionalandsubregionaleconomicblocks.
OUTLOOK
Withtheemergenceofnewplayers,theinstitutional
landscapeintheforestsectorhasbecomemorecomplex
andthebalanceamongplayersisshifting.Ingeneral
(althoughnotinallcountries),theplayingeldis
morelevel,partlyasaresultofnewinformationand
communicationtechnologies.Themuch-neededpluralism
providesnewopportunitiesforsmallandmedium
enterprisesandcommunityorganizations.Civil-society
institutions,usuallyfocusingonsocialandenvironmental
issues,andprivate-sectorinstitutions,usuallyemphasizing
economicaspects,aregaininginstrengthandnumber;
fundingandinvestmentsincreasinglyfavourthemover
thepublicsectorandinternationalinstitutions.Ifthe
governmentforestryagenciesthathistoricallydominated
thescenefailtoadapttothesechanges,theycouldfade
intoirrelevance.Withtheincreasingpaceofglobalization,
newplayerssuchasTIMOs,REITs,sovereignwealth
fundsandcarbontradinginstitutionscouldalterthe
globalinstitutionalmap.Institutionswillfacetremendous
pressuretobalancefragmentationandtoconsolidate
efforts.
The Non-Legally Binding Instrument on All Types of Forests
(NLBI) adopted by the UN General Assembly in December
2007 embodies a global consensus on sustainable forest
management and outlines future priorities in the form of
four Global Objectives on Forests:
• reverse the loss of forest cover worldwide through
sustainable forest management;
• enhance forest-based economic, social and
environmental benefits, including by improving the
livelihoods of forest-dependent people;
• increase significantly the area of protected forests
and other areas of sustainably managed forest
worldwide;
• reverse the decline in official development assistance
for sustainable forest management.
With the NLBI and its new multiyear programme of
work, UNFF is poised to deliberate on some of the most
pressing issues related to forests in the coming years.
In 2009, UNFF will discuss the contribution of forests to
addressing challenges of climate change as well as the
role of forests in protecting biodiversity and reducing
desertification. In this regard, issues such as governance
and sound participatory decision-making will be crucial
to ensuring that the benefits of forests are secured and
that long-term planning takes precedence over short-term
gains.
n
The Non-Legally Binding Instrument and future priorities for forests
From the United Nations Forum on Forests (UNFF)
Views from CPF partners
The Collaborative Partnership on Forests (CPF),
a voluntary arrangement among 14 international
organizations and secretariats with substantial
programmes on forests, aims to enhance coordination
of support to the international forest dialogue and to
country-level implementation of sustainable forest
management. Initiatives on streamlining forest-related
reporting and harmonizing definitions have aided
global, regional and national forest processes. Recent
initiatives include a joint strategic response to the global
climate change agenda and consolidation of scientific
knowledge in support of international policy processes.
BOX 44 Collaborative Partnership on Forests
STATE OF THE WORLD’S FORESTS 2009
88
T
hescienceandtechnologysysteminvolvesbasicand
strategicresearch,appliedandadaptiveresearch,and
adoptionoftheresults.Broadlyspeaking,technology
inforestrygenerallyrelatestotwoareas:
• managementofforestandtreeresourcesforthe
productionofgoodsandprovisionofenvironmental
services;
• harvesting,transportandprocessingofwoodand
non-woodproducts.
Withintheseareas,developmenttendstofocusonone
ormoreofthefollowingobjectives:
• reducingcostsandincreasingproductivity;
• developingnewproductsandservices;
• conservingresourcesandreducingadverse
environmentalimpacts;
• improvingenergyefciency.
Inmeetingtheseobjectives,newerelds,suchas
biotechnology,nanotechnologyandinformationand
communicationtechnologies(Box45),arehavinga
notableimpact.
Agrowingareaofresearchdealswithenhancingthe
scienticbasefortheprovisionofenvironmentalservices.
Thisusuallyinvolvesstudyofecosystemprocessesandthe
implicationsofdifferentdegreesofhumanintervention.For
Developments in forest
science and technology
FIGURE 58 IUFRO membership by region, 2008
SOURCE: IUFRO, 2008.
Africa, 29 countries
Asia and the Pacific, 26 countries
Europe, 38 countries
Latin America and the Caribbean, 16 countries
North America, 3 countries
Western and Central Asia, 6 countries
8%
23%
23%
2%
9%
35%
The growth of information and communication technologies
(ICTs) has had significant direct and indirect impacts on
forestry and has been central in accelerating the pace of
globalization. The Internet and mobile communications have
created unprecedented opportunities for those who were
traditionally outside the global information loop, including
small and medium-sized enterprises. ICTs have increased
labour productivity, reduced costs and increased returns.
Online stores provide marketing opportunities for wood
product and service suppliers.
ICTs have also fostered institutional change in forestry. The
increased ease of information sharing and global networking
diminishes the power of vertically structured organizations
and fosters the development of small organizations. ICTs
have helped to promote transparency and accountability on
an unprecedented scale, as very little information can be
kept away from public access and scrutiny. ICTs have also
facilitated awareness-raising about forest-related issues
such as deforestation, biodiversity loss, forest fires and the
marginalization of indigenous communities.
BOX 45 Information and communication technologies in forestry
SOURCES: Hetemäki and Nilsson, 2005; Nyrud and Devine, 2005.