Estimation of viscosity and hydrolysis kinetics of corn starch gels based on microstructural features using a simplified model
Bạn đang xem bản rút gọn của tài liệu. Xem và tải ngay bản đầy đủ của tài liệu tại đây (1.15 MB, 9 trang )
Carbohydrate Polymers 273 (2021) 118549
Contents lists available at ScienceDirect
Carbohydrate Polymers
journal homepage: www.elsevier.com/locate/carbpol
Estimation of viscosity and hydrolysis kinetics of corn starch gels based on
microstructural features using a simplified model
´n Moreira b, Cristina M. Rosell a, *
Maria Santamaria a, Raquel Garzon a, Ramo
a
b
Institute of Agrochemistry and Food Technology (IATA-CSIC), C/Agustin Escardino, 7, 46980 Paterna, Spain
Department of Chemical Engineering, Universidade de Santiago de Compostela, rúa Lope G´
omez de Marzoa, Santiago de Compostela, E-15782, Spain
A R T I C L E I N F O
A B S T R A C T
Keywords:
In vitro digestibility
Microstructure
Modelling
Starch content
Viscosity is an important rheological property, which may have impact on the glycemic response of starchy
foods. However, the relationship between starch gels viscosity on its hydrolysis has not been elucidated. The aim
of this work was to assess the effect of gels viscosity on the microstructure, and the kinetics of enzymatic hy
drolysis of starch. Corn starch gels were prepared from starch:water ratios varying from 1:4 to 1:16. A structural
model was proposed that correlated (R-square = 0.98) the porous structure (cavity sizes, thickness walls) of gels
and its viscosity. Kinetics constants of hydrolysis decreased with increasing starch content and consequently with
gel viscosity. Relationships of viscosity with the microstructural features of gels suggested that enzyme diffusion
into the gel was hindered, with the subsequent impact on the hydrolysis kinetics. Therefore, starch digestibility
could be governed by starch gels viscosity, which also affected their microstructure.
1. Introduction
The understanding of starch hydrolysis is attracting much research
owing its relationship with the metabolic processes occurring along
human digestion, particularly the postprandial blood glucose levels
(Hardacre, Lentle, Yap, & Monro, 2016). Previous to the glucose ab
sorption in small intestine, starch is hydrolyzed by salivary and
pancreatic α-amylase in the mouth and small intestine, respectively,
generating short oligomers, such as maltose or maltotriose (Dona, Pages,
Gilbert, & Kuchel, 2010). According to the rate of hydrolysis, starch is
commonly categorized into three fractions (Englyst & Hudson, 1996):
rapidly digestible starch (RDS) associated with a fast increase in blood
glucose level, slowly digestible starch (SDS) slowly hydrolyzed in the
small intestine, and resistant starch (RS), which is not digested by the
enzymes in the superior gastrointestinal tract, but microorganisms can
ferment it to short chain fatty acids (SCFA) in the large intestine (Dura,
Rose, & Rosell, 2017; Zhou et al., 2020).
Despite the interest in starch digestion, there is uncertainty about the
factors that could affect the hydrolysis of starch catalyzed by α-amylase.
The starch concentration, its botanical origin, or the starch status as
native or gelatinized form are important properties that may influence
the hydrolysis. Previous studies suggested that cereal flours are digested
more rapidly than tubers and legume flours, due to their difference in
starch microstructure and chemical composition (Gularte & Rosell,
2011; Liu, Donner, Yin, Huang, & Fan, 2006). Furthermore, Dhital,
Warren, Butterworth, Ellis, and Gidley (2017) described that mecha
nisms limiting enzymatic activity are related to binding or blocking the
access of α-amylase. Those authors differentiated when enzymatic hy
drolysis is in aqueous solution as occurs in the gelatinized starch or in
slurry as the case of granular starch. In both cases the amylase hydrolysis
might be limited by, first the barriers that prevent the binding of the
enzyme to starch and secondly, the structural features of starch that
impede amylase access to the substrate. Consequently, physical char
acterization of the starch granule as size, pores in the granular surface or
the supramolecular structure are properties that can impact the
adsorption and binding of the α-amylase. Besides starch structure, vis
cosity of the system has been incorporated as one important element in
the starch digestion (Hardacre, Lentle, Yap, & Monro, 2016). However,
studies investigating viscosity have been focused on the impact of sol
uble and insoluble dietary fiber, but not on the role of gels viscosity
produced as a result of starch gelatinization. The addition of hydrocol
loids (usually labelled as non-starch polysaccharides, NPS) modifies the
gelatinization/gelation process of the starch (Brennan, Suter, Luethi,
Matia-Merino, & Qvortrup, 2008; Tomoko & Kaoru, 2011). A study
* Corresponding author at: Institute of Agrochemistry and Food Technology (IATA-CSIC), C/Agustin Escardino, 7, 46980 Paterna, Spain.
E-mail addresses: (M. Santamaria), (R. Garzon), (R. Moreira),
(C.M. Rosell).
/>Received 15 April 2021; Received in revised form 6 August 2021; Accepted 8 August 2021
Available online 11 August 2021
0144-8617/© 2021 The Authors.
Published by Elsevier Ltd.
This is an
( />
open
access
article
under
the
CC
BY-NC-ND
license
M. Santamaria et al.
Carbohydrate Polymers 273 (2021) 118549
carried out with corn and potato starches and different hydrocolloids
(pectin, guar gum, xanthan gum and soluble cellulose derivatives CMC
and HPMC) confirmed that hydrocolloids affected the hydrolysis rate to
different extent, depending on the hydrocolloid and type of starch
(Gularte & Rosell, 2011). Authors observed an increase in initial rate of
starch amylolysis in the presence of hydrocolloids, with the exception of
guar gum that decreased the kinetic constant in potato gels (Gularte &
Rosell, 2011). Yuris, Goh, Hardacre, and Matia-Merino (2019) studied
the digestibility of wheat starch gels in the presence of several poly
saccharides (xanthan, guar, agar) and explained the reduction in the
starch digestibility by the increase in gel hardness that limits the enzyme
accessibility to starch. Similarly, guar and xanthan gums added to highamylose corn starch affected starch viscosity and retarded starch hy
drolysis leading to lower estimated glycemic response (Chung, Liu, &
Lim, 2007; Zhang, Li, You, Fang, & Li, 2020). The different studies
discussed the relationship between the extent of starch hydrolysis and
the system viscosity, but divergences on the role of viscosity accelerating
or slowing down the starch hydrolysis have been encountered, which
might be attributed to a possible viscosity threshold required for that
enzymatic inhibition. Additionally, some studies analyzed the relation
between insoluble fiber like cellulose and the α-amylase activity. Nsoratindana, Yu, Goff, Chen, and Zhong (2020) reported that amylase can
bind cellulose and act as a reversible and non-specific inhibitor, and the
inhibition becomes more apparent as the particle size of the polymer
decreases (Dhital, Gidley, & Warren, 2015; Nsor-atindana, Yu, Goff,
Chen, & Zhong, 2020).
Therefore, although it has been found out that the viscosity of
exogenous sources of hydrocolloids impacts the rate of digestive hy
drolysis of starch to our best knowledge there are no studies regarding
the viscosity effect of starch gels on their hydrolysis by digestive en
zymes. Based on this, we initially hypothesized that starch gels viscosity
could affect their digestion, and furthermore, that their structural fea
tures also might influence the enzymes accessibility to the starch. The
aim of this study was to unravel the impact of viscosity and gel micro
structure on the enzymatic hydrolysis of starch gels, using homogeneous
gels prepared only with starch, in order to avoid possible artifacts
derived from the interaction between heterologous polymers as it occurs
in the presence of different hydrocolloids. Corn starch gels were pre
pared with different starch concentrations leading to gels with different
properties and microstructure. To simulate starch digestion, the orogastrointestinal digestion (Minekus et al., 2014) and a direct in vitro
enzymatic hydrolysis (Benavent-Gil & Rosell, 2017) were applied to the
different gels.
1:12; 1:14; 1:16). Slurries were subjected to heating and cooling cycles
consisting of: 50 ◦ C for 1 min, heating from 50 to 95 ◦ C in 3 min 42 s,
holding at 95 ◦ C for 2 min 30 s, then cooling down to 50 ◦ C in 3 min 48 s
and holding at 50 ◦ C for 2 min. The pasting parameters evaluated
included the peak viscosity (maximum viscosity during heating),
breakdown (viscosity difference between peak viscosity and trough),
and the pasting rate calculated as the slope of the apparent viscosity
during heating until 95 ◦ C. The apparent viscosity of the formed gels was
measured at 37 ◦ C with a vibrational viscometer VL7-100B-d15
(Hydramotion Ltd., Malton, UK). This apparatus measures viscosity at
high shear rate where the strong shear-thinning behavior of samples is
less relevant. Moisture of gels was determined in two steps using an
infrared balance (KERN, Balingen, Germany). Three different batches
for each gel were prepared.
2.3. Total starch
The amount of total starch of the gels was quantified using a com
mercial assay kit (Megazyme International Ireland Ltd., Bray, Ireland).
Two replicates were measured for each sample.
2.4. Scanning Electron Microscopy (SEM)
Fresh gels were immersed in liquid nitrogen and then freeze-dried.
The microstructure of the different freeze-dried gels was observed
using scanning electron microscopy (S-4800, Hitachi, Ibaraki, Japan).
Samples were examined at an accelerating voltage of 10 kV and 100×
magnification. Micrographs (1.3 × 0.98 mm) were captured. The
microstructure analysis was carried out using the ImageJ analysis pro
gram (ImageJ, National Institutes of Health, Bethesda, Maryland, USA)
and NIS-Elements software (Nikon Instruments Inc., Tokyo, Japan). An
auto local thresholding was applied using ImageJ software and
measured the wall thickness, and then the measurement of gel cavities
or holes was carried out with Nis-Elements software. Parameters
assessed were number of cavities/mm2, mean cavity area (μm2),
porosity (%) calculated as ratio of total area of cavities and total image
area, and wall thickness (μm) as previously described by Garzon and
Rosell (2021). Three images were used to calculate the average of pre
vious parameters.
2.5. In vitro oro-gastrointestinal digestion
The oro-gastrointestinal digestion was carried out following the
standardized static digestion method described by Minekus et al. (2014)
and adapted by Aleixandre, Benavent-Gil, and Rosell (2019). Minor
modifications included the use of five grams of gel prepared in the Rapid
Visco Analyzer (RVA) and 27 U/mL of α-amylase solution. Aliquots were
withdrawn along digestion. Specifically, at the end of oral and gastric
digestion and during the three hours of intestinal digestion. Aliquots
were immediately heated to 100 ◦ C for 5 min to stop enzyme hydrolysis.
Hydrolysis was quantified with 3,5-dinitrosalicylic acid (DNS) spectro
photometrically using an SPECTROstar Nano microplate reader (BMG
LABTECH, Ortenberg, Germany) at 540 nm, using maltose as standard.
Resistant starch was determined at the end of the digestion.
2. Materials and methods
2.1. Materials
Corn starch EPSA (Valencia, Spain) of 95% purity (20.25% amylose
content) and 13.22% moisture content was used. The enzymes used
were type VI-B α-amylase from porcine pancreas (EC 3.2.1.1), pepsin
from porcine gastric mucosa (EC 3.4.23.1), pancreatin from porcine
pancreas (EC 232.468.9), bile salts and 3,5-dinitrosalicylic acid (DNS)
were acquired from Sigma Aldrich (Sigma Chemical, St. Louis, USA).
Amyloglucosidase (EC 3.2.1.3) was provided by Novozymes (Bagsvaerd,
Denmark). Glucose oxidase/peroxidase (GOPOD) kit (Megazyme Inter
national Ireland Ltd., Bray, Ireland) was used. Solutions and standards
were prepared by using deionized water. All reagents were of analytical
grade.
2.6. Hydrolysis kinetics and expected glycemic index
Hydrolysis kinetics of starch gels were determined following the
method described by Benavent-Gil and Rosell (2017) with minor mod
ifications. One gram of gel was suspended into 4 mL of 0.1 M sodium
maleate buffer (pH 6.9) with porcine pancreatic α-amylase (0.9 U/mL)
and incubated in a shaker incubator SKI 4 (ARGO Lab, Carpi, Italy) at
37 ◦ C under constant stirring at 200 rpm during 3 h. Aliquots (100 μL)
were taken during incubation and mixed with 100 μL ethanol (96%) to
stop the enzymatic hydrolysis. Then, it was centrifuged for 5 min
(10,000 ×g, 4 ◦ C). The pellet was suspended in 100 μL of ethanol (50%)
2.2. Preparation of gels and pasting properties
The preparation of starch gels and the pasting performance of each
samples was determined by Rapid Visco Analyzer (RVA 4500; Perten
Instruments, Hă
agersten, Sweden). Corn starch gels were prepared at
different concentrations with deionized water (w:w, 1:4; 1:6; 1:8; 1:10;
2
M. Santamaria et al.
Carbohydrate Polymers 273 (2021) 118549
and centrifuged as described before. Supernatants were pooled together
and kept at 4 ◦ C. Supernatant (100 μL) was diluted with 885 μL of 0.1 M
sodium acetate buffer (pH 4.5) and incubated with 15 μL amylogluco
sidase (214.5 U/mL) at 50 ◦ C for 30 min in a shaking incubator, before
quantifying glucose content.
The remnant starch after 24 h hydrolysis was solubilized with 2 mL
of cold 1.7 M NaOH. The mixture was homogenized with Polytron UltraTurrax T18 (IKA-Werke GmbH and Co. KG, Staufen, Germany) for 5 min
at 14,000 rpm in an ice bath. The homogenate was diluted with 8 mL 0.6
M sodium acetate pH 3.8 containing calcium chloride (5 mM) and
incubated with 100 μL AMG (143 U/mL) at 50 ◦ C for 30 min in a shaking
water bath. Afterwards, the glucose content was measured using a
glucose oxidase–peroxidase (GOPOD). The absorbance was measured at
510 nm. Starch was calculated as glucose (mg) × 0.9.
The hydrolysis results allowed to calculate the amount of starch
fractions. Rapidly digestible starch (RDS) was the starch fraction hy
drolyzed within 20 min of incubation, slowly digestible starch (SDS) was
the fraction hydrolyzed within 20 and 120 min, total digestible starch
(DS) the amount of hydrolyzed starch after 24 h of incubation and
resistant starch (RS) was the starch fraction that remained unhydrolyzed
after 24 h of incubation (Calle, Benavent-Gil, & Rosell, 2020). The in
vitro digestion kinetics were calculated fitting experimental data to a
first-order equation (Eq. 1) (Go˜
ni, Garcia-Alonso, & Saura-Calixto,
1997):
(
)
C = C∞ 1 − e− kt
(1)
test (LSD) was used to estimate significant differences among experi
mental mean values. Differences of P < 0.05 were considered significant.
Furthermore, Pearson correlation analysis was used to identify possible
relationships among experimental parameters.
3. Results and discussion
3.1. Formation process of gel
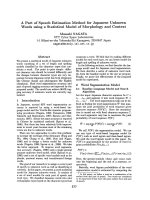
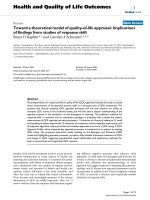
The pasting properties were recorded to identify the impact of starch
concentration on the gel performance. Rapid Visco Analyzer (RVA)
registered the apparent viscosity during heating and cooling cycle; the
logarithmic scale for the apparent viscosity was used for comparison
purposes (Fig. 1). The pasting behavior in RVA cycle was different
among samples. At high starch content the maximum peak viscosity was
reached earlier with higher slope (pasting rate) during heating, indi
cating faster increase of apparent viscosity. Peak viscosity is considered
the equilibrium point between swelling and rupture of starch granules
(Balet, Guelpa, Fox, & Manley, 2019). Therefore, at low starch content
the granules can swell more freely, without the contact of other swollen
granules. In consequence the rupture was delayed and reached at higher
temperatures. As a result, the peak temperature decreased from 95 to
84 ◦ C with increasing starch content. Eerlingen, Jacobs, Block, and
Delcour (1997) reported similar performance when different concen
trations of potato starch were subjected to different hydrothermal
treatments. At low concentrations, the starch particles are completely
swollen, but the space is rather limited at a higher starch concentration
and swollen granules can only fill up the available space referred as close
packing concentration. At the lowest concentration, a shoulder was
visible before reaching the maximum peak viscosity, likely evidencing
differences in swelling rate of starch granules associated to their particle
size distribution. It has been reported that the average size of individual
corn starch granules ranged within 1–7 μm for small and 15–20 μm for
large granules (Singh, Singh, Kaur, Singh Sodhi, & Singh Gill, 2003).
Mishra and Rai (2006) observed that corn starch exhibited polyhedral
granules with size ranging from 3.6 to 14.3 μm. Differences in the
granular size led to diverse surface area that could interact with water,
and in consequence modifying the swelling rate. Nevertheless, the vis
cosity shoulder was only visible in the more diluted system, probably at
higher concentration the predominant granules size population masked
the swelling of the less abundant one.
Regarding the maximum apparent viscosity, as expected, the most
concentrated starch gel (starch:water, 1:4) showed the highest peak of
where C was the percentage of starch hydrolyzed at t time, C∞ was the
equilibrium concentration or maximum hydrolysis of starch gels, k was
the kinetic constant and t was the time chosen. In addition, the time
required to reach 50% of C∞ (t50) was calculated. The hydrolysis index
(HI) was obtained by dividing the area under hydrolysis curve (0–180
min) of the sample by the area of the sample more concentrated (1:4)
over the same period. The expected glycemic index (eGI) was calculated
with the proposed Eq. (2) (Granfeldt, Bjă
orck, Drews, & Tovar, 1992).
eGI = 8.198 + 0.862 HI
(2)
2.7. Statistical analyses
Experimental data were statistically analyzed using an analysis of
variance (ANOVA) and values were expressed as mean ± standard de
viation, using Statgraphics Centurion XVII software (Statistical Graphics
Corporation, Rockville, MD, USA). Fisher's least significant differences
Fig. 1. RVA pasting profiles of corn starch gels prepared with different starch concentrations. Values in the legend are referred to the ratio starch:water (w:w).
Discontinuous line shows the temperature applied during the heating-cooling cycle.
3
M. Santamaria et al.
9.1 ± 1.1
7.3 ± 0.2b
5.8 ± 0.3cd
4.8 ± 0.0de
3.5 ± 0.3ef
2.7 ± 0.2fg
1.8 ± 0.2g
0.0001
59.9 ± 3.7
58.0 ± 4.7ab
61.6 ± 3.8ab
66.3 ± 2.2a
69.8 ± 8.5a
65.5 ± 7.7ab
65.8 ± 3.6ab
0.2623
134
946cd
130bc
2371ab
520b
117b
871a
1027 ±
1613 ±
3321 ±
5493 ±
5209 ±
4691 ±
7668 ±
0.0009
119
1432b
685a
2155a
246a
1750a
930a
Means within the same column followed by different letters indicate significant differences P < 0.05.
a
Weq was obtained from Eq. (4): Weq = ATP(1:16)/ATP ⋅ e/e1:16.
2591 ±
3221 ±
6259 ±
7709 ±
7650 ±
7050 ±
8806 ±
0.0012
226 ± 9
175 ± 60ab
100 ± 16bc
88 ± 22c
93 ± 14c
122 ± 4bc
93 ± 33c
0.0050
768 ± 23
422 ± 27b
112 ± 30c
111 ± 15c
74 ± 1d
62 ± 7de
48 ± 4e
0.0001
18.6 ± 0.1
11.2 ± 0.2b
8.7 ± 0.2c
7.2 ± 0.1d
5.7 ± 0.1e
5.4 ± 0.1e
4.5 ± 0.0f
0.0001
1:4
1:6
1:8
1:10
1:12
1:14
1:16
P-value
Weqa
Wall thickness (μm)
a
ab
Porosity (%)
Median cavity area (μm2)
d
b
Mean cavity area (μm2)
No. cavities/mm2
Viscosity (mPa s)
Total starch (g/100 g gel)
Sample
Table 1
Characterization of corn gels: total starch, viscosity at 37 ◦ C and microstructure parameters.
4
a
Considering the potential impact of gels characteristics on their hy
drolysis performance, a thorough analysis of the gels was carried out.
Viscosity at 37 ◦ C and the content of total starch in tested gels are pre
sented in Table 1. The total starch content decreased as the dilution
increased. The wide range of gels concentrations, from 4.5% to 18.6%,
could cover the concentration existing in very diverse starch foods, from
soups to salad dressings (4–15%). As expected, starch concentration had
a significant impact on the gels' viscosity (R-square = 0.97). Sample with
the highest content of total starch (18.6%) also showed the highest
viscosity (768 mPa s). Conversely, the viscosity of the more diluted gel
was 48 mPa s. A significant power law correlation was observed between
the starch content and the resulting gels viscosities, which was related to
the change on flow resistance when modifying the amount of solid per
volume unit (Moreira, Chenlo, Torres, & Glazer, 2012).
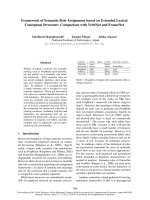
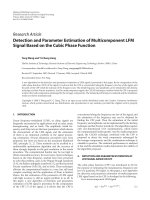
The structural impact of starch concentration on the resulting gels
was evaluated by analyzing the SEM micrographs (Fig. 2). The gels
morphology considerably varied with the starch content. Gel micro
structure resembled a network with small cavities. As the starch dilution
increased, an enhancement in the size of cavities was observed with
samples 1:4 and 1:6 having more closed structures (Fig. 2a and b). The
disintegration of granules during heating, as indicated the breakdown
observed for those gels in the RVA, might be responsible for that tight
structure. The results of the image analysis (Table 1) confirmed signif
icant differences (P < 0.05) in the microstructure of the gels, except for
porosity. The number of cavities or holes in the gels showed a steady
decrease as the starch dilution increased up to 1:8. Further dilutions did
not induce significant differences in the number of cavities/mm2.
Simultaneously, the mean area of the cavities progressively increased
with the starch dilution in the gels, again until sample 1:8, with no
additional changes at higher dilution values. There was a significant
positive relationship between number of cavities with viscosity (Rsquare = 0.87) and total starch (R-square = 0.82). Conversely, negative
significant relationships were obtained between the mean area of the
cavities with viscosity (R-square = − 0.84) and total starch (R-square =
− 0.84). When the median area of the cavities was used for comparing
gels, the same trend was observed, except for the gel with the highest
dilution (1:16) that exhibited significantly larger cavities.
Possible relationships among starch content, gels microstructure and
their viscosity were analyzed. There was a positive logarithmic rela
tionship (R-square = 0.98) between the thickness of the cavities' walls
and the starch content of the gels, and exponential with the gels' vis
cosity (R-square = 0.94). It was expected that the apparent viscosity of
the gels depends mainly on the solid content, but viscosity values
(Table 1) suggested that the 3-D network of the gel and its spatial dis
tribution also must be considered. The gel structures shown in Fig. 2
were modelled as follows: pores (with an equivalent radius, req) given by
the median cavity area (A) and walls whose thickness (e) can be
a
3.2. Characterization of the gels
a
apparent viscosity (21,727 mPa s), observing a progressive decrease of
that viscosity when increasing the starch dilution up to 1:16. Similar
trend was observed in the final viscosity. This result was expected based
on the amount of starch added in each slurry, because the apparent
viscosity was directly related to the amount of starch.
The viscosity decay observed along holding at 95 ◦ C (breakdown),
associated with the disintegration degree of starch granules, exhibited
also differences among samples. Major differences were observed within
the most concentrated gels up to 1:8, at higher dilution changes in
apparent viscosity were less visible, even during cooling. Standard
methods for recording apparent viscosity of starches are usually carried
out with starch:water slurries of 1:8, obtaining pasting profiles similar to
the present study (Calle, Benavent-Gil, & Rosell, 2021; Mishra & Rai,
2006). Nevertheless, no previous study showed the apparent viscosity of
gels with different starch concentration and how it impacts on the starch
digestibility.
24.9 ± 1.8a
14.8 ± 2.1b
6.5 ± 0.7c
3.4 ± 1.3d
2.7 ± 0.6de
2.4 ± 0.4de
1.0 ± 0.3e
0.0001
Carbohydrate Polymers 273 (2021) 118549
M. Santamaria et al.
Carbohydrate Polymers 273 (2021) 118549
Fig. 2. Scanning electron micrograph of corn starch gels. Magnification 100×. The starch:water ratio is: 1:4 (a); 1:6 (b); 1:8 (c); 1:10 (d); 1:12 (e); 1:14 (f); 1:16 (g).
considered as two semi-thicknesses by the contribution of each neigh
boring pore covering. The area occupied by starch walls (ATP) in relation
to porous area can be evaluated by:
(
/ )2
(π + √3 − π/2) req + e 2
ATP Ae + As − A Ae + As
=
=
− 1=
− 1
A
A
A
A
(3)
number of walls increased with increasing starch content from 1 (1:16)
up to 24.9 (1:4). A linear relationship (R-square = 0.98) between
number of equivalent walls (Weq) and viscosity (μ, mPa s) was found, Eq.
(5), achieving a structural model that involves the porous characteristics
of starchy gels and a physical property such as viscosity.
where Ae is the area of the circle with radius given by the sum of req and
e; As is the area between three tangent circles with area Ae.
Spatial distribution of the starch and the thickness of the wall
depended on the starch gel content. As req was in all cases longer than e,
the highest ATP (Eq. 3) was obtained with the highest cavity area (in this
case 1:16). ATP is employed to evaluate the number of cavities equiva
lent to contain the same amount of starch than in other gels. Never
theless, these cavities have thicker walls and the number of equivalent
walls, Weq, regarded to the reference wall (thinnest wall, e1:16) must be
evaluated by means of:
3.3. In vitro digestion and hydrolysis of gels
Weq =
ATP(1:16) e
ATP e1:16
μ = 30.46 Weq − 14.97
(5)
The method INFOGEST was used to simulate the digestion of corn
starch gels in the oro-gastrointestinal tract (Fig. 3). Experimental results
are displayed as g of hydrolyzed starch per 100 g of gel, since the in vitro
method is directly based on the amount of food ingested, in this case
gels. Starch hydrolysis during oral and gastric phase presented very low
hydrolysis considering the percentage of starch hydrolyzed. This was
already reported by Iqbal, Wu, Kirk, and Chen (2021) because of a short
residence time during oral phase and the inhibition of α-amylase at low
pH in the gastric phase. In the intestinal phase, there was only an initial
increase in the amount of hydrolyzed starch, but no further changes
were observed along the intestinal digestion time. The orogastrointestinal digestion did not show a trend with the different
starch gels, although the most concentrated gel (1:4) exhibited the
lowest level of starch hydrolysis (1.5 g of hydrolyzed starch/100 g gel).
(4)
Eq. (4) allows the determination of the number of the walls with the
same thickness (1.8 μm) per unit of starch gel. Introducing the corre
sponding data collected in Table 1 and by evaluation of Eq. (3), the
Fig. 3. In vitro oro-gastrointestinal digestion of gels prepared with different starch concentration. Legend is indicating the ratio starch:water used to prepare the gels.
5
M. Santamaria et al.
Carbohydrate Polymers 273 (2021) 118549
Some authors indicated that samples with high starch content under
went slow hydrolysis, which has been related with the viscosity
impeding the diffusion of enzymes, and in consequence, the enzymes
accessibility and their binding to their substrate (Sanrom´
an, Murado, &
Lema, 1996; Wu et al., 2017).
Overall, the application of the oro-gastrointestinal in vitro digestion
to starch gels did not allow us to identify the possible impact of gels
viscosity and microstructure on the enzymatic hydrolysis, since the
progressive dilution of the samples in each digestion phase masked
differences associated to intrinsic characteristics of the gels. For this
reason, the starch hydrolysis was directly carried out with porcine
pancreatic α-amylase following methodology previously reported
(Benavent-Gil & Rosell, 2017).
According to the rate and extent of in vitro digestion of starch, rapidly
digestible starch (RDS), slowly digestible starch (SDS) and resistant
starch (RS) were quantified, obtaining significant differences (P < 0.05)
among the gels (Table 2). RDS, starch digested in the first 20 min, is the
fraction that causes rapid increase in blood glucose after digestion of
carbohydrates (Dona, Pages, Gilbert, & Kuchel, 2010). In this study, RDS
did not present a linear correlation with the starch concentration.
Sample 1:8 showed the highest amount of RDS. According to Dhital,
Warren, Butterworth, Ellis, and Gidley (2017), the hydrolytic activity of
the amylase could be reduced when the enzyme access to the starch is
limited. In the present system, a decrease of the RDS might be expected
when increasing gel viscosity, and thus the starch concentration of the
gel. Nevertheless, that decrease was only observed at higher starch
concentrations until 1:8, which suggests that a viscosity threshold was
required in order to affect the enzyme accessibility. Conversely, SDS,
related to low postprandial glycemic peak, showed steady decrease with
the starch concentration, and the more diluted samples led to lower SDS.
Chung, Liu, and Lim (2007) found that the incorporation of hydrocol
loids increased the SDS, but without any clear trend on RDS content.
Namely, samples with higher content of starch (1:4; 1:6) showed greater
differences. Predictably, as the starch content in the gels was reduced,
DS and RS decreased. Differences in DS were narrowed from sample 1:8
to 1:16, probably related to their viscosity differences at 37 ◦ C (Table 1).
Concerning RS, the amount of this fraction was directly related to the
total starch amount of the gels.
For the more concentrated samples greater difference in viscosity
was observed and the same trend was seen in the in vitro digestion pa
rameters. Again, significant relationships were encountered with vis
cosity and the hydrolysis fractions SDS (R-square = 0.95) and RS (Rsquare = 0.96); and also the area of the cavities with SDS (R-square =
− 0.87) and RS (R-square = − 0.84). The fraction of RDS content in
relation to the initial starch content of the gel, RDS(%), decreased from
79.8% (1:16) up to 18.9% (1:4) with increasing starch content. It is
worthy to mention that RDS% could be satisfactorily related with the
structural parameter, Weq, Eq. (4), by means of:
(
)
(6)
RDS% = 74.45 − 16.73 log Weq
This relationship (R-square = 0.95) indicates that the presence of a
high number of equivalent walls of starch results in a decrease of the
initial amount of starch that is accessible by enzymes.
Starch hydrolysis of gels prepared with different concentration of
corn starch is presented in Fig. 4. Results have been plotted as both the
amount of hydrolyzed starch per 100 g of gels vs time and the amount of
hydrolyzed starch per 100 g of starch vs time. Those two different graphs
for expressing results were chosen to understand the role of starch
concentration in the gels. Hydrolysis plots confirmed the different
behavior of the gels depending on the starch concentration. Fig. 4A
showed the initial starch hydrolysis with minor differences in the rate of
hydrolysis but the maximum hydrolysis reached was dependent on the
gels dilution. A progressive reduction in the maximum hydrolyzed
starch was observed when increasing gels dilution. Samples with higher
dilution (1:12; 1:14; 1:16) had a rapid initial hydrolysis but reached a
plateau after hydrolyzing low amount of starch (ca. 4%) (Fig. 4A).
Regarding the starch content of the gels, when hydrolysis was followed
recording the amount of hydrolyzed starch per starch amount on the gels
(g starch/100 g of starch) (Fig. 4B) the pattern was completely different.
There was a slower hydrolysis in the more concentrated gels and faster
hydrolysis in the diluted ones, which also reached higher hydrolysis
extension (up to 86%), compared to the 53% hydrolysis observed in the
gel 1:4. Other studies (Tomoko & Kaoru, 2011), reported the impact of
viscosity, provided by the addition of different gums, on the decrease of
the starch hydrolysis. Likewise, Ma et al. (2019) reported that the
incorporation of pectin increased the viscosity in the gut lumen and
showed slower rate of starch hydrolysis. This could be attributed to the
formation of a pectin layer around starch granules that limited the ac
cess of enzymes. Conversely, in the present study, a homogenous system
comprising only starch has been used and results confirm the real impact
of viscosity on the starch hydrolysis.
The starch hydrolysis in all the gels showed a very good fitting (Rsquare = 0.96) to a first order kinetics model. The kinetics parameters
derived from hydrolysis of gels including kinetics constant (k), equilib
rium concentration of hydrolyzed starch (C∞), area under the hydrolysis
curve after 180 min (AUC 180), hydrolysis index (HI) and estimated
glycemic index (eGI) are summarized in Table 3. These parameters were
significantly (P < 0.05) different depending on the gel concentration.
The kinetics constant (k) increased with the starch dilution and the time
to reach 50% of the hydrolysis (t50) showed a progressive decrease with
the dilution. Therefore, more concentrated gels exhibited slower hy
drolysis over the digestion time. At constant enzyme concentration and
temperature of reaction, an increase of enzymatic reaction rate would be
expected when increasing the substrate concentration. However, in the
present gels, there is an increase of reaction rate when diluting the starch
and therefore, when decreasing the amount of starch in the gels, sug
gesting that the formation of enzyme-substrate complexes depended on
the own structural gel features. High starch content hinders the enzyme
diffusion into the gel and macroscopically this resistance associated to
the mass transport can be related to gel viscosity (previously related to
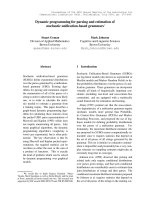
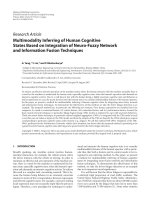
microstructural gel features with the proposed model). In fact, the hy
drolysis kinetics constant depended inversely on the gel viscosity
(Fig. 5). Two different trends could be determined, associated with high
(>100 mPa s) and low (<100 mPa s) viscosities corresponding to high
(>7 g starch/100 g gel) and low (<7 g starch/100 g gel) amount of
starch in the gels. At low viscosity range, the kinetics constant value
drops linearly (R-square = 0.98) with gel viscosity. This regression al
lows the empirical prediction of enzymatic kinetics constant value (k1 =
0.22 min− 1) at very low starch amount present in the gel (very low
substrate concentration and gel viscosity assumed equal to water vis
cosity at 37 ◦ C, 0.692 mPa s) (Lide, 2005). This kinetics constant value
could be interpreted like the kinetics constant in absence of mass
transfer resistances within gel. In fact, the kinetics constant values
collected in Table 3 must be considered like a global kinetics coefficient
where enzymatic reaction constant value (k1, min− 1) and mass transfer
coefficient (km, min− 1) are involved and the simplified relationship,
Table 2
Parameters of in vitro corn starch gels digestibility: rapidly digestible starch
(RDS), slowly digestible starch (SDS), digestible starch (DS), resistant starch
(RS).
Sample
RDS (g/100 g)
SDS (g/100 g)
DS (g/100 g)
RS (g/100 g)
1:4
1:6
1:8
1:10
1:12
1:14
1:16
P-value
3.51 ± 0.49bcd
3.77 ± 0.04ab
4.05 ± 0.22a
3.46 ± 0.18bcd
3.07 ± 0.07d
3.14 ± 0.08cd
3.59 ± 0.06abc
0.0110
5.68 ± 1.16a
3.64 ± 0.04b
1.95 ± 0.36c
1.57 ± 0.02c
1.43 ± 0.20cd
0.86 ± 0.10cd
0.27 ± 0.05d
0.0001
9.99 ± 0.55a
7.73 ± 0.17b
5.58 ± 0.69c
5.24 ± 0.67cd
4.17 ± 0.49de
4.23 ± 0.50de
3.96 ± 0.14e
0.0001
3.63 ± 0.24a
2.41 ± 0.17b
1.59 ± 0.24c
1.32 ± 0.13cd
0.98 ± 0.06de
0.85 ± 0.15e
0.70 ± 0.12e
0.0001
Values within the same column followed by different letters indicate significant
differences P < 0.05.
6
M. Santamaria et al.
Carbohydrate Polymers 273 (2021) 118549
Fig. 4. Enzymatic starch hydrolysis of different corn starch gels prepared with different starch concentration. Legend is indicating the ratio starch:water used to
prepare the gels. Hydrolysis plots are expressed as: g/100 g gel (A) and g/100 g starch (B). Solid lines correspond to first-order model with kinetics constant evaluated
by Eq. (8).
Table 3
Kinetic parameters resulting from the enzymatic hydrolysis of corn gels with different starch concentrations. Kinetic parameters include: kinetic constant (k), time
required to reach 50% of C∞ (t50); equilibrium concentration (C∞), area under the hydrolysis curve after 180 min (AUC), hydrolysis index (HI) and estimated glycemic
index (eGI) for corn gels with different concentration. Expressed per 100 g of gels (Fig. 4A).
Sample
k (min− 1)
t50 (min)
C∞a
AUC
HI
eGIb
1:4
1:6
1:8
1:10
1:12
1:14
1:16
P-value
0.02 ± 0.01e
0.03 ± 0.00de
0.06 ± 0.01cd
0.06 ± 0.00cd
0.07 ± 0.02bc
0.10 ± 0.03ab
0.13 ± 0.01a
0.0004
35 ± 7a
20 ± 0b
10 ± 0c
10 ± 0c
10 ± 0c
8 ± 4c
5 ± 0c
0.0001
10.10 ± 1.53a
7.52 ± 0.08b
6.01 ± 014c
5.03 ± 0.20cd
4.14 ± 0.44d
3.72 ± 0.33d
3.86 ± 0.11d
0.0001
1335.00 ± 49.50a
1136.00 ± 12.73b
971.75 ± 8.27c
818.05 ± 34.29d
683.65 ± 52.68e
628.00 ± 42.00e
663.45 ± 17.04e
0.0001
100.00 ± 2.99a
85.09 ± 0.77b
72.79 ± 0.50c
61.28 ± 2.07d
51.21 ± 3.18e
47.04 ± 2.54e
49.70 ± 1.03e
0.0001
94.40 ±
81.55 ±
70.94 ±
61.02 ±
52.34 ±
48.75 ±
51.04 ±
0.0001
Values followed by different letters within a column denote significant differences (P < 0.05).
a
C∞ and k were determined by the equation, C = C∞ (1 − e− kt).
b
eGI was quantified following the equation proposed by Granfeldt, Bjă
orck, Drews, and Tovar (1992).
c
Obtained from Eq. (7): 1/k = 1/k1 + 1/km..
7
kmc (min− 1)
2.58b
0.66c
0.43d
1.79e
2.74f
2.19f
0.89f
0.02 ± 0.01e
0.04 ± 0.01de
0.07 ± 0.02cd
0.08 ± 0.02cd
0.10 ± 0.02c
0.18 ± 0.03b
0.34 ± 0.04a
0.0001
M. Santamaria et al.
Carbohydrate Polymers 273 (2021) 118549
Fig. 5. Relationship of the kinetics constant of first order model with gel viscosity.
after several assumptions for a model of resistances in series, is given by
the Eq. (7) (Levenspiel, 1998):
1 1
1
= +
k k1 km
observed regarding the reduction in the hydrolysis rate, but now it is
related to the increase of viscosity by the increase of starch content in
the gels.
(7)
4. Conclusions
Eq. (7) allows the estimation of km of enzyme into the gels with
different starch content and the corresponding values are shown in
Table 3. The mass transfer coefficients value strictly depends on the
characteristics of compound diffusing, turbulence conditions on the
surface and properties of the fluid. In our case, in a simplified way, it was
found a power relationship between km and viscosity (R-square = 0.996)
and Eq. (7) can be written after substitution:
1
1
=
+ 0.196 η0.8
k 0.22
This study investigated for the first time the role of the viscosity of
starch gels on the digestion of starch. Corn starch gels of varying starch
concentration resulted in a range of different viscosities and micro
structures. A structural model is proposed that connects by a linear
relationship (R-square = 0.98) the porous structure (cavity sizes and
thickness walls) of starch gels and their viscosity. The viscosity showed a
linear relationship with the number of starch walls per area and its
thickness (equivalent walls). The kinetics constant values of the starch
hydrolysis decreased when increasing gel viscosity. Hydrolysis con
stants, considering mass transfer resistance within the gel, were suc
cessfully correlated with gel viscosity by means of a simple model,
confirming the initial formulated hypothesis. Overall, the proposed
simplified model links macrostructural properties (viscosity) and
microstructural features (median cavity area and wall thickness) to
analyze hydrolysis kinetics. It could also be extended to other physical
and chemical processes where starch gels are involved and validated
with other gels formed with starches from other sources. From the
technological point of view, these findings could be applied in the design
of food formulations aiming at postprandial glucose management.
(8)
A very high correlation (R-square > 0.94) was obtained between
experimental kinetics constant data and estimated values employing Eq.
(8). The goodness of the first order model with the kinetics constant
evaluated by Eq. (8) can be observed in the Fig. 4A and B. These results
confirmed that the viscosity of starch gels must be considered to eval
uate the hydrolysis rates. Previous hydrolysis studies dealing with
changes in viscosity have been carried out with diverse hydrocolloids,
and the slowdown of the enzymatic activity has been explained based on
the hydrocolloid coating of the starch surface that block the enzyme
accessibility to the substrate (Chung, Liu, & Lim, 2007; Gularte & Rosell,
2011). However, the present research confirmed the role of the apparent
viscosity of the gels on the enzymatic hydrolysis.
In addition, the maximum hydrolysis (C∞) reached with the different
gels (Fig. 4A, Table 3) showed a significant decrease when increasing
gels dilution. A similar trend was observed for the total area under the
hydrolysis curve (AUC), which is related to the glucose released over a
˜ i, Garcia-Alonso, & Saura-Calixto,
hydrolysis period of 180 min (Gon
1997). To estimate the glycemic index (eGI), the hydrolysis index (HI)
of each gel was calculated taking the sample 1:4 as a reference (HI =
100%). The eGI showed a steady decrease until 51% in the most diluted
sample. Glycemic index is used to describe how the food starch is hy
drolyzed in the digestive system and absorbed into the bloodstream
(Dona, Pages, Gilbert, & Kuchel, 2010). Some authors reported that the
high viscosity induced by hydrocolloids might form a physical barrier
for the α-amylase access, which would explain the decrease in glucose
released and its absorption in the intestine (Dartois, Singh, Kaur, &
Singh, 2010; Gularte & Rosell, 2011). Here, the same behavior was
Funding
Authors acknowledge the financial support of the Spanish Ministry of
Science and Innovation (Project RTI2018-095919-B-C2) and the Euro
pean Regional Development Fund (FEDER), Generalitat Valenciana
(Project Prometeo 2017/189) and Xunta de Galicia (Consolidation
Project ED431B 2019/01).
CRediT authorship contribution statement
Maria Santamaria: Conceptualization, Data curation, Formal anal
ysis, Investigation, Methodology, Writing – original draft. Raquel
´ n Moreira:
Garzon: Methodology, Supervision, Data curation. Ramo
Formal analysis, Writing – review & editing, Funding acquisition.
Cristina M. Rosell: Conceptualization, Funding acquisition, Investiga
tion, Supervision, Writing – review & editing.
8
M. Santamaria et al.
Carbohydrate Polymers 273 (2021) 118549
Declaration of competing interest
Granfeldt, Y., Bjă
orck, I., Drews, A., & Tovar, J. (1992). An in vitro prodecure based on
chewing to predict metabolic reponse to starch in cereal and legume products.
European Journal Clinical Nutrition, 46, 649–660.
Gularte, M. A., & Rosell, C. M. (2011). Physicochemical properties and enzymatic
hydrolysis of different starches in the presence of hydrocolloids. Carbohydrate
Polymers, 85(1), 237–244.
Hardacre, A. K., Lentle, R. G., Yap, S. Y., & Monro, J. A. (2016). Does viscosity or
structure govern the rate at which starch granules are digested? Carbohydrate
Polymers, 136, 667–675.
Iqbal, S., Wu, P., Kirk, T. V., & Chen, X. D. (2021). Amylose content modulates maize
starch hydrolysis, rheology, and microstructure during simulated gastrointestinal
digestion. Food Hydrocolloids, 110, Article 106171.
Levenspiel, O. (1998). Chemical reaction engineering (3rd ed.). New York: Wiley.
Lide, D. R. (2005). CRC handbook of chemistry and physics. Boca Raton, FL: CRC.
Liu, Q., Donner, E., Yin, Y., Huang, R. L., & Fan, M. Z. (2006). The physicochemical
properties and in vitro digestibility of selected cereals, tubers and legumes grown in
China. Food Chemistry, 99(3), 470–477.
Ma, Y. S., Pan, Y., Xie, Q. T., Li, X. M., Zhang, B., & Chen, H. Q. (2019). Evaluation
studies on effects of pectin with different concentrations on the pasting, rheological
and digestibility properties of corn starch. Food Chemistry, 274, 319–323.
Minekus, M., Alminger, M., Alvito, P., Ballance, S., Bohn, T., Bourlieu, C., … Brodkorb, A.
(2014). A standardised staticin vitrodigestion method suitable for food — An
international consensus. Food & Function, 5(6), 1113–1124.
Mishra, S., & Rai, T. (2006). Morphology and functional properties of corn, potato and
tapioca starches. Food Hydrocolloids, 20(5), 557–566.
Moreira, R., Chenlo, F., Torres, M. D., & Glazer, J. (2012). Rheological properties of
gelatinized chestnut starch dispersions: Effect of concentration and temperature.
Journal of Food Engineering, 112(1–2), 94–99.
Nsor-atindana, J., Yu, M. H., Goff, H. D., Chen, M. S., & Zhong, F. (2020). Analysis of
kinetic parameters and mechanisms of nanocrystalline cellulose inhibition of alphaamylase and alpha-glucosidase in simulated digestion of starch. Food & Function, 11
(5), 4719–4731.
Sanrom´
an, A., Murado, M. A., & Lema, J. M. (1996). The influence of substrate structure
on the kinetics of the hydrolysis of starch by glucoamylase. Applied Biochemistry and
Biotechnology, 59(3), 329–336.
Singh, N., Singh, J., Kaur, L., Singh Sodhi, N., & Singh Gill, B. (2003). Morphological,
thermal and rheological properties of starches from different botanical sources. Food
Chemistry, 81(2), 219–231.
Tomoko, S., & Kaoru, K. (2011). Effect of non-starch polysaccharides on the in vitro
digestibility and rheological properties of rice starch gel. Food Chemistry, 127(2),
541–546.
Wu, P., Bhattarai, R. R., Dhital, S., Deng, R., Chen, X. D., & Gidley, M. J. (2017). In vitro
digestion of pectin- and mango-enriched diets using a dynamic rat stomachduodenum model. Journal of Food Engineering, 202, 65–78.
Yuris, A., Goh, K. K. T., Hardacre, A. K., & Matia-Merino, L. (2019). The effect of gel
structure on the in vitro digestibility of wheat starch-Mesona chinensis
polysaccharide gels. Food & Function, 10(1), 250–258.
Zhang, Y., Li, M., You, X., Fang, F., & Li, B. (2020). Impacts of guar and xanthan gums on
pasting and gel properties of high-amylose corn starches. International Journal of
Biological Macromolecules, 146, 1060–1068.
Zhou, S., Hong, Y., Gu, Z., Cheng, L., Li, Z., & Li, C. (2020). Effect of heat-moisture
treatment on the in vitro digestibility and physicochemical properties of starchhydrocolloid complexes. Food Hydrocolloids, 104, 105736.
None.
References
Aleixandre, A., Benavent-Gil, Y., & Rosell, C. M. (2019). Effect of bread structure and in
vitro oral processing methods in bolus disintegration and glycemic index. Nutrients,
11(9), 2105.
Balet, S., Guelpa, A., Fox, G., & Manley, M. (2019). Rapid Visco Analyser (RVA) as a tool
for measuring starch-related physiochemical properties in cereals: A review. Food
Analytical Methods, 12(10), 2344–2360.
Benavent-Gil, Y., & Rosell, C. M. (2017). Performance of granular starch with controlled
pore size during hydrolysis with digestive enzymes. Plant Foods for Human Nutrition,
72(4), 353–359.
Brennan, C. S., Suter, M., Luethi, T., Matia-Merino, L., & Qvortrup, J. (2008). The
relationship between wheat flour and starch pasting properties and starch
hydrolysis: Effect of non-starch polysaccharides in a starch gel system. Starch Stă
arke, 60(1), 2333.
Calle, J., Benavent-Gil, Y., & Rosell, C. M. (2020). Development of gluten free breads
from Colocasia esculenta flour blended with hydrocolloids and enzymes. Food
Hydrocolloids, 98, Article 105243.
Calle, J., Benavent-Gil, Y., & Rosell, C. M. (2021). Use of flour from cormels of
Xanthosoma sagittifolium (L.) Schott and Colocasia esculenta (L.) Schott to develop
pastes foods: Physico-chemical, functional and nutritional characterization. Food
Chemistry, 344, Article 128666.
Chung, H. J., Liu, Q., & Lim, S. T. (2007). Texture and in vitro digestibility of white rice
cooked with hydrocolloids. Cereal Chemistry Journal, 84(3), 246–249.
Dartois, A., Singh, J., Kaur, L., & Singh, H. (2010). Influence of guar gum on the in vitro
starch digestibility—Rheological and microstructural characteristics. Food
Biophysics, 5(3), 149–160.
Dhital, S., Gidley, M. J., & Warren, F. J. (2015). Inhibition of α-amylase activity by
cellulose: Kinetic analysis and nutritional implications. Carbohydrate Polymers, 123,
305–312.
Dhital, S., Warren, F. J., Butterworth, P. J., Ellis, P. R., & Gidley, M. J. (2017).
Mechanisms of starch digestion by α-amylase—Structural basis for kinetic
properties. Critical Reviews in Food Science and Nutrition, 57(5), 875–892.
Dona, A. C., Pages, G., Gilbert, R. G., & Kuchel, P. W. (2010). Digestion of starch: In vivo
and in vitro kinetic models used to characterise oligosaccharide or glucose release.
Carbohydrate Polymers, 80(3), 599–617.
Dura, A., Rose, D. J., & Rosell, C. M. (2017). Enzymatic modification of corn starch
influences human fecal fermentation profiles. Journal of Agricultural and Food
Chemistry, 65(23), 4651–4657.
Eerlingen, R. C., Jacobs, H., Block, K., & Delcour, J. A. (1997). Effects of hydrothermal
treatments on the rheological properties of potato starch. Carbohydrate Research, 297
(4), 347–356.
Englyst, H. N., & Hudson, G. J. (1996). The classification and measurement of dietary
carbohydrates. Food Chemistry, 57(1), 15–21.
Garzon, R., & Rosell, C. M. (2021). Rapid assessment of starch pasting using a rapid force
analyzer. Cereal Chemistry, 98(2), 305–314.
Go˜
ni, I., Garcia-Alonso, A., & Saura-Calixto, F. (1997). A starch hydrolysis procedure to
estimate glycemic index. Nutrition Research, 17(3), 427–437.
9