Inulin from Pachyrhizus erosus root and its production intensification using evolutionary algorithm approach and response surface methodology
Bạn đang xem bản rút gọn của tài liệu. Xem và tải ngay bản đầy đủ của tài liệu tại đây (5.19 MB, 11 trang )
Carbohydrate Polymers 251 (2021) 117042
Contents lists available at ScienceDirect
Carbohydrate Polymers
journal homepage: www.elsevier.com/locate/carbpol
Inulin from Pachyrhizus erosus root and its production intensification using
evolutionary algorithm approach and response surface methodology
Rohan Sarkar a, Arpan Bhowmik b, Aditi Kundu a, Anirban Dutta a, Lata Nain c, Gautam Chawla d,
Supradip Saha a, *
a
Division of Agricultural Chemicals, ICAR-Indian Agricultural Research Institute, New Delhi, India
Division of Design of Experiments, ICAR-Indian Agricultural Statistics Research Institute, New Delhi, India
Division of Microbiology, ICAR-Indian Agricultural Research Institute, New Delhi, India
d
Division of Nematology, ICAR-Indian Agricultural Research Institute, New Delhi, India
b
c
A R T I C L E I N F O
A B S T R A C T
Keywords:
Pachyrhizus erosus
Prebiotic
Inulin
Ultrasound
Microwave
Genetic algorithm
Production of inulin from yam bean tubers by ultrasonic assisted extraction (UAE) was optimized by using
response surface methodology (RSM) and genetic algorithms (GA). Yield of inulin was obtained between
11.97%–12.15% for UAE and 11.21%–11.38% for microwave assisted extraction (MAE) using both the meth
odologies, significantly higher than conventional method (9.9 %) using optimized conditions. Under such
optimized condition, SEM image of root tissues before and extraction showed disruption and microfractures over
surface. UAE provided a shade better purity of extracted inulin than other two techniques. Degree of polymer
ization in inulin was also recorded to be better, might be due lesser degradation during extraction. Significant
prebiotic activity was recorded while evaluation using Lactobacillus fermentum and it was 36 % more than glucose
treatment. Energy density by UAE was few fold lesser than MAE. Carbon emission was far more less in both these
methods than the conventional one.
1. Introduction
With the sharp increase in health related problems, especially with
the advent of COVID-19, enhancing immunity is one of the prescribed
method to stay safe and healthy. Boosting of immunity is linked with the
structure and function of microbiome. Health of gut bacteria can be
enhanced by using probiotic directly or using prebiotic in order to get
the beneficial effect indirectly. Apart from this, there is an increasing
trend of gastrointestinal problems. In this regard, India has become one
of the pioneer countries among other south-east Asians as around 10 %
of its population is suffering under severe “Functional Gastrointestinal
Diseases” according to a report by Boronat, Ferreira-Maia, Matijasevich,
and Wang (2017). There are a plethora of synthetic drugs accessible in
the market but lots of side effects are adhered with these pharmaceuti
cals. So now-a-days scientific communities are expressing their interests
towards enriching the population of gut-friendly microbes that are
already present in human system. Prebiotic compounds play a pivotal
role in increasing the population of microbes in human gut. These are
basically non-digestive oligosaccharides (short chain dietary
carbohydrates) that show selective metabolism within system. Oligo
saccharides, resistant to gastric acidity, are fermented and utilized by
gut micro-biota. It stimulate the growth and/or activity of gut bacteria
(Olano-Martin, Mountzouris, Gibson, & Rastall, 2001).
Mexican yam bean or Jicama (Prachyrhizus erosus L.), a member of
fabaceae family, is an important crop in terms of its economic signifi
cance in Mexico along with various south-east Asian countries. Different
polysaccharides are present in the fruit that consist of cellulose, pectic
polysaccharides, xyloglucans, hetereomannans along with inulin
(Ramos-De-La-Pena, Renard, Wicker, & Contreras-Esquivel, 2013). The
crop is still under-utilized although it has huge commercial potential.
Inulin being a potent prebiotic substance, its extraction is very much
economically important in nutraceutical as well as functional food
perspective. So to explore the possibility of utilization of this underutilized crop for the purpose of valorisation, this yam bean tuber flesh
was selected for the extraction of inulin.
Generally oligosaccharides are being extracted by hot water apart
from other newer techniques like ultrasound-assisted extraction (UAE),
microwave-assisted extraction (MAE) etc. Conventional extraction
* Corresponding author.
E-mail addresses: , (S. Saha).
/>Received 11 July 2020; Received in revised form 26 August 2020; Accepted 31 August 2020
Available online 9 September 2020
0144-8617/© 2020 Elsevier Ltd. All rights reserved.
R. Sarkar et al.
Carbohydrate Polymers 251 (2021) 117042
process uses higher temperature for extended period of time but it re
sults in lesser yield (Liu, Fu, Chi, & Chi, 2014). UAE and MAE provide
immense advantage in terms of lesser extraction time, lower energy
requirement and higher efficiency. Using ultrasound mediated extrac
tion method, inulin was earlier extracted from Burdock roots (Arctium
lappa) (Milani, Koocheki, & Golimovahhed, 2011), Jerusalem artichoke
tubers (Li et al., 2018), roots of elecampane (Inula helenium L.) (Petkova
et al., 2015), tubers of Iranian artichoke (Abbasi & Farzanmehr, 2009).
Similarly different fructo-oligosaccharides were extracted from various
matrices using microwave heating. Using this technique, inulin was
isolated from tubers of Helianthus tuberosus L. (Temkov, Petkova, Denev,
& Krastanov, 2015), tubers of Cynara scolymus L. (Ruiz-Aceituno,
´, Alonso-Rodriguez, Ramos, & Sanz, 2016), Burdock roots
García-Sarrio
(Li et al., 2014) etc. But no study has been documented regarding
extraction of inulin from yam bean tubers by ultrasound or microwave
technique till date.
As per industrial purview, the optimisation of extraction conditions
is quintessential in order to get maximum yield of desirable bioactives
for any kind of extraction method. Using Response Surface Methodology
(RSM) for the optimisation purpose is not a new approach. But limited
study has been conducted regarding optimised extraction protocol for
inulin from different crops. Keeping this fact in mind, the present
research work was formulated with the aim to find the role of extraction
techniques on the purity of inulin extracted by UAE and MAE. Prebiotic
activity of the extracted inulin was also evaluated for its utilization in
food. Process optimisation was done by two methods viz. Box-Behnken
Design (response surface methodology) (Varghese, Bhowmik, Jaggi,
Varghese, & Kaur, 2017) as well as genetic algorithm approach based on
the concept of natural selection and genetics by using non-linear second
order response surface model (García, García-Pedrajas, Ruiz, &
´mez-Nieto, 2018). This piece of work will be helpful for industrial
Go
application by understanding appropriate conditions for obtaining
maximum prebiotic compound.
separation of precipitate.
2. Materials and methods
2.3.3. Conventional hot water extraction
Inulin was also extracted by heating the tuber tissues (0.5 kg) with
water (1.5 L) at 90⁰C for 30 min along with homogenization (5000 rpm).
It was repeated twice in order to complete the extraction. All the extracts
were combined, filtered and processed in the way similar to other
methods (discussed in Section 2.3.1) to obtain yield of inulin.
2.3. Extraction procedure
2.3.1. Ultrasound assisted extraction
Powdered material was subjected to probe ultrasound (VCX-750,
Sonics, Sonics and Materials Inc., Newtown, USA) of 20 KHz frequency
at 60, 80 and 100 % amplitude using three different solvent (water)solute ratio (3.5:1, 4.5:1, 5.5:1 v/w) under extraction time of 120 s, 150
s and 180 s. Total 15 combinations were reported as output from RSM
analysis based on these extraction parameters and yield of inulin was
obtained for each combination. Further, inulin was obtained from the
water extract of tuber powder according to Li’s method [14]. Firstly Ca
(OH)2 was added to the extract up to pH of 11 to precipitate the protein
portion. After completion of the step, H3(PO4)2 was added to lower the
pH to 8. The whole content was centrifuged at 10,000 rpm for 5 min to
get the supernatant. Finally inulin powder was obtained by precipitating
in excess ethanol followed by freeze drying (Labconco, USA) at -80⁰C.
Total sugar content and reducing sugar content were measured
adapting Phenol-sulfuric acid method (Dubois, Gilles, Hamilton, Rebers,
& Smith, 1956) and 3, 5-dinitrosalicylic acid method (DNS) (Miller,
1959). The difference between these two values is the inulin present in
the extract that was presented as percentage value as per dry weight of
tuber sample.
2.3.2. Microwave assisted extraction
Design of extraction method using microwave is similar to ultra
sound assisted extraction where power of microwave were taken as 300
W, 600 W and 900 W along with solvent-solute ratio of 3.5:1, 4.5:1 and
5.5:1 under extraction time of 120 s, 150 s and 180 s. Fifteen different
combinations were obtained by RSM analysis and the same were used
for extraction of inulin. Yield of inulin was obtained for each combi
nation following the process described earlier in Section 2.3.1.
2.1. Plant materials and reagents
Yam bean tubers were collected from a local market of Kolkata
(Mechhua fruit market, N 22.57◦ ; E 88.36◦ ). The tubers were cut into
pieces of convenient sizes (1− 2 cm) and blanched in boiling water (2 L
per 1 kg tubers; 100 ⁰C) for 5 min to deactivate enzymatic activities. The
blanched tuber pieces were kept overnight under oven at 50 ⁰C for
complete drying. The dried samples were then grinded using a mixer
grinder into fine powder (<1 mm size). This powdered material was
utilized for extraction of inulin.
Deionized water was used for extraction purpose, obtained from
millipore purifier system having 18.2 MΩ cm resistance. Calcium hy
droxide, phosphoric acid, 3, 5-dinitrosalicylic acid, phenol and sulphu
ric acid are analytical grade (Merck®India). Standard of inulin was
procured from Sigma-Aldrich.
2.4. Optimization using response surface methodology
Box-Behnken design was used for the optimization experiment of
inulin production from tuberous root of yam bean. The analysis based on
BBD generally consider second order response surface model (quadratic
polynomial). As model lack-of-fit was significant after using second
order response surface model which ideally should remain nonsignificant, partial third order or cubic polynomial model can be used
for fitting data based on BBD till degrees of freedom can be ensured for
estimating the experimental error. Dependent variables used in the
present study were coded and depicted in Table 1 and the layout of
2.2. Instrumentation details
Table 1
Variables (actual and coded) used for the experimental design for UAE experi
ment (A) and MAE experiment (B).
Ultrasonicator (VCX-750, Sonics, Sonics and Materials Inc., New
town, USA) with 20 KHz frequency was used for the UAE purpose. It
includes ultrasonic processor with a titanium probe of 13 mm diameter
with amplitude (100 %) of 114 μ.Domestic microwave (CE2933, Sam
sung) working at power level ranged between 300− 900 W and fre
quency of 2450 MHz.
Chromatographic analysis was done by HPLC (Waters Alliance 2695
separation module, equipped with the amino column (Waters, 250 × 4.6
mm, 5 μ), using ELSD (model 2424).
A pH meter and a UV–vis spectrophotometer (Analytik Jena AG,
Germany) were used for pH and spectrophotometric analysis respec
tively. Centrifuge (Z326 K, Hermle AG, Germany) was used for the
Coded variable levels
1
A
100
180
5.5
B
900
180
5.5
2
Independent variable
0
− 1
80
150
4.5
60
120
3.5
Amplitude (%)
Time (Sec.)
Solvent/solute ratio
600
150
4.5
300
120
3.5
Power (W)
Time (Sec.)
Solvent/solute ratio
R. Sarkar et al.
Carbohydrate Polymers 251 (2021) 117042
required experiments were done according to Table S1. Design Expert
software (version 9.0.6.2) was used for the analysis of the whole
experiment. Optimised data generated by the RSM was validated by real
time experimental data.
Genetic algorithms are another approach to optimize the experi
mental condition. It is based on natural evolution and it basically imitate
the Darwin’s principle of “survival of the fittest”. Complex optimization
problems can be solved using genetic algorithms. Recently, number of
studies used this technique to optimize experimental parameters
(Hatami, Meireles, & Zahedi, 2010; Muthusamy, Manickam, Murugesan,
Muthukumaran, & Pugazhendhi, 2019; Sodeifian, Sajadian, & Ardes
tani, 2016). Genetic algorithm, pioneered by Holland, is mainly used in
optimization for its accuracy. Unlike other optimization techniques, it
does not require initial values for the experimentation. Here, optimi
zation was done by using exponential second order response surface
polynomial based on GA approach. Optimization using non-linear model
requires initial parameter values. For the present investigation, the
initial parameter values for the exponential second order polynomial
were obtained by fitting the exponential second order polynomial model
based on the data obtained through experimentation carried out using
Box-Behnken Designs used in the present study.
GA experiments were carried out in SAS® Proprietary Software 9.4
(TS1M1) by SAS Institute Inc., Cary, NC, USA. Genetic algorithm
approach for optimization was carried out in R version 3.4.4.
broth. Growth of the microbe was monitored at regular time interval by
measuring optical density (OD) of the medium at 622 nm.
2.7.2. Prebiotic effect of inulin
Response of inulin as prebiotic was assessed by using the same cul
ture media having similar MRS broth composition but with replacement
of sugar with inulin. Growth of culture was also assessed in MRS broth
with no carbohydrate source that was considered as control. Carbohy
drate concentration was maintained at 2% level in all cases. The acti
vated inoculum was incubated with 1% (v/v) and kept at 35 ◦ C. Growth
of the bacteria was observed at 12 h interval up to 72 h when growth of
microbe was in stationary phase. OD values were measured as an indi
cation of growth of bacterial culture. For further confirmation, bacterial
count was also done by taking sample from each respective culture
media by serial dilution method using 0.9 % NaCl solution.
2.8. Energy consumption
Energy density (Ev, J mL− 1) was calculated and compared between
UAE and MAE methods. It is described as amount of energy dissipated
per volume unit of extraction solvent (Chan, See, Yusoff, Ngoh, & Kow,
2017). It is measured by the following equations.
Ev
2.5. SEM analysis
=
Pv =
In order to see the effectivity of extraction procedure and disruption
caused during the extraction process, surface structure of root powder of
Pachyrhizus erosus was observed under SEM (CarlZeiss Evo-MA-10,
operating at 10.0 KV/EHT) before and after the individual experi
ment. Three samples (UAE, MAE and conventional method) along with
the initial material was used for recording of SEM image. Sample was
prepared for the analysis by mounting approximately the material (0.5
mg) in powdered form on an aluminium stub having sputter-coating
with palladium layer.
(1)
Pv t
m.Cp.
V
∂T
∂t
(2)
Where Pv is the power density (WmL− 1); t is the extraction time (sec); m
is the mass (g) of the sample; Cp is the specific heat of water (4.186 J g− 1
◦ − 1 ∂T
C ); ∂t is the heating rate (◦ C s− 1) during the execution of the exper
iment and V is the total volume (mL) of the sample.
Analysis for energy consumption is prerequisite for any technology,
which has the potential to be scaled upto industry level. Total energy
consumption was calculated based on the consumption of electricity by
each experiment. Carbon emission was calculated by considering the
fact that 1KWh produces 0.8 kg of CO2.
2.6. Purity profiling of inulin
3. Results and discussion
For the purity estimation of inulin, free fructose present in the
extracted inulin was estimated by spectrophotometrically using the
method described by Saengkanuk, Nuchadomrong, Jogloy, Patanothai,
and Srijaranai (2011) as well as by HPLC. For the estimation of total
fructose and glucose, inulin extract as hydrolysed by 0.2 mL L− 1 HCl at
100 ◦ C for 45 min. The hydrolysate was estimated for fructose and
glucose concentration after neutralizing with NaOH solution. Inulin
content in the extracted materials was calculated by following the
method by Saengkanuk et al. (2011).
Chromatographic separations of hydrolysed inulin was performed by
isocratic elution with 90 % A/10 % B solvent system where A and B was
80/20 acetonitrile/water with 0.2 % triethylamine and 30/70 acetoni
trile/water with 0.2 % triethylamine respectively with flow rate of 1.0
mL min− 1. Gain set for ELS detector was 100 with nitrogen gas pressure
of 35 psi. Inulin was hydrolysed and the fructose content was measured
by HPLC.
Effect of temperature and influence of ultrasound/microwave on the
degree of polymerization in inulin was also evaluated at two extreme
condition of UAE and MAE, used in the RSM experiment.
3.1. Comparison of extraction methods
Selection of Pachyrhizus erosus tubers for extraction of inulin was
done with the purpose of valorization of the crop. The crop is underutilised although it is grown in different parts of the globe.
Extraction yield of inulin from Pachyrhizus erosus tuberous root was
done by conventional hot extraction, MAE and UAE was varied across
9.9, 10.2–11.2, 10.3–11.9 % respectively. Conventional extraction was
done by hot water refluxing for 30 min. Extraction efficiency did not
improve upon increase in duration. Further, initial soaking for a fixed
time followed by extraction or homogenization prior to extraction did
not enhance extraction efficiency significantly. Better extraction of
phenolic components from Tagetes erecta was reported by Kazibwe, Kim,
Chun, & Gopal (2017), where hot water extraction, waterbath sonicat
ion and ultrafast ultrasonication were compared. Ultrasonic cleaning
bath and probe system can be efficient source of extraction for better
yield. Alzorqi, Sudheer, Lu, and Manickam (2017) compared hot water,
Soxhlet and UAE of polysaccharides from G. lucidum mushroom and the
result revealed that extraction yield of the polysaccharide was 63.4,
107.1 and 80.9 mg, respectively.
UAE was done by varying frequencies, time and solute to solvent
ratio keeping temperature constant at 40 ◦ C.Variations in inulin yield
was recorded across all the variables (Fig. S1). Maximum extraction
(12.2 %) efficiency was observed in the experiment where 100 %
amplitude was used for three minutes with solute to solvent ratio of
1:4.5 and it was 19.2 % more than the conventional extraction.
2.7. Assessment of prebiotic effect
2.7.1. Growth curve of microbe taken for prebiotic assessment
For this prebiotic effect evaluation of inulin, pure culture of Lacto
bacillus fermentum was used, which was maintained by Division of
Microbiology, ICAR-IARI, New Delhi. The microbial strain was grown at
35 ◦ C under anaerobic condition using de man Rogosa Sharp (MRS)
3
R. Sarkar et al.
Carbohydrate Polymers 251 (2021) 117042
Better extraction in UAE was provided by the energy delivered by the
ultrasonic waves, which helped to penetrate the solvent inside the ma
trix, whereas, temperature governed the extraction in case of MAE.
Extraction efficiency was maximum (11.2 %) in that experiment where
microwave power of 900 W was exposed for 150 s with solvent to solute
ratio of 5.5. it was observed that 13.5 % more extraction efficiency in
MAE than conventional method. Highest pectin yield from grapefruit
was recorded in MAE (27.8 %) as compared to UAE (17.9 %), done in
ultrasonic bath. In MAE, 900 W for 6 min interval was used for extrac
tion, whereas, 25 min sonication in ultrasonic bath at 70 ◦ C (Bagherian,
Ashtiani, Fouladitajar, & Mohtashamy, 2011). Better rupture of the cells
followed by better penetration of solvent inside the matrix are the rea
sons for better extraction and it was confirmed by the SEM data pre
sented in future sub section. Simultaneous ultrasonic-microwave
assisted extraction of inulin required much shorter time than conven
tional method, when it was done in burdock root (Lou, Wang, Wang, &
Zhang, 2009). Extraction time for conventional extraction and
ultrasonic-microwave assisted extraction method was 60 and 300 s
respectively, but the yield was a shade better in conventional method
(99.8 mg g− 1) than the other method (99.0 mg g− 1). Upon increase in
extraction time, the later method showed degradation of inulin. UAE
provided better yield from roots of globe artichoke (Castellino et al.,
2020). The study reported in general 33 % increase in extraction yield by
UAE than conventional hot water extraction. It was also concluded that
genetic and pedo-climatic variations do contribute to the extraction
yield apart from extraction method. Milani et al. (2011) reported opti
mum extraction condition for isolation of inulin from Arctium lappa
keeping amplitude, temperature, time and solute to solvent ratio as
variable and it was concluded that amplitude played an important role
during extraction. Inulin yield from the source was 12.3 and 24.3 %
when extracted by hot water and ultrasonic assisted extraction
techniques.
Both UAE and MAE generates significant amount of heat during
extraction in short time leads to better solubility of extractants and
better extraction (Plazzotta, Ibarz, Manzocco, & Martín-Belloso, 2020;
Saikia, Mahnot, & Mahanta, 2016). Yansheng et al. (2011) reported
neither particle size nor solid to solvent ratio influence the extraction
efficiency but variation in microwave power influenced the extraction of
lactones from Ligusticum chuanxiong.
the significant portions of variations explained by the model is 98.45 %.
It is to be noted here that, the adjusted R2 will increase if only significant
variables included in the model. However, for the above model, the
overall lack-of-fit also remains highly significant (p-value: 0.0041) at 1
% level of significance which is not desirable as from statistical point of
view, the lack-of-fit which tests the goodness of fit of the model which
should remain non significant for model to be fitted well. The non sig
nificance of lack-of-fit may be due the fact that the second order model is
not exactly capturing all the variations in the data and if it is so then
there is still better scope for model improvement.
The above model was improved and validated in the lab for the
optimization. It is to be noted that, the data under consideration were
obtained based on a 15 run Box-Behken Design (BBD) with three factors
which is although enough for estimating all the 10 parameters
(including intercept) of a quadratic model, but the same resources are
not enough to estimate all the 20 parameters (including intercept) of a
cubic model. However, the existing resources can be used to estimate
some more additional parameters apart from all the 10 parameters of
quadratic model. Keeping this mind the analytical situation in ultra
sonication data, the final model fitting was done with the above
quadratic model with additional parameters as AC2 and BC2. Therefore,
in order to improve the performance of the model and keeping the
resource constraint, the following non-hierarchical cubic model with
AC2 and BC2 has been fitted again and the results are summarized as
follows:
y = β0 + β1 ∗ A + β2 ∗ B + β3 ∗ C + β11 ∗ A2 + β22 ∗ B2 + β33 ∗ C2 + β12
∗ AB + β13 ∗ AC + β23 ∗ BC + β133 ∗ AC2 + β233 ∗ BC2
From above Table 2, based on non hierarchical cubic model, it can be
observed that the overall model is highly significant at 1 % level of
significance with a p-value of <0.0001. All effects are also significant at
1 % level of significance except the interaction effect of B and C which
remains significant at 5 % level of significance. For the fitted model, the
lack of fit test remain totally non significant at 5 % level of significance
which indicates that the model is the perfect fit. As a results the model is
able to explain complete variation with data with both The R2 and
adjusted R2 = 1.00. The final fitted model is:
(
)
Inulin yield(%) = 21.31 − 0.06A − 0.07 B − 4.19C + 4.17 × 10− 5 AB − 0.01AC + 0.03 BC
(
) 2 (
) 2
)
)
(
(
− 4
− 5
+ 6.79 × 10 A + 1.85 × 10 B + 0.47 C2 + 1.13 × 10− 3 AC2 − 3.60 × 10− 3 BC2
3.2. Optimization of the extraction condition using RSM and GA
3.2.1. Extraction parameters for UAE
The analysis based on BBD (Box-Behken Design), which generally
consider second order response surface model (quadratic polynomial).
For three factors (amplitude (A), time (B) and solvent to solute ratio (C)
in this experiment, the second order polynomial will look like
2
2
Table 2
Analysis of variance (ANOVA) for the BBD fitted model for optimization of inulin
by UAE optimization experiment.
2
y = β0 + β1 ∗ A + β2 ∗ B + β3 ∗ C + β11 ∗ A + β22 ∗ B + β33 ∗ C + β12
∗ AB + β13 ∗ AC + β23 ∗ BC
Here, the response y = inulin content (%).
Based on second order model fitting, it has been observed that for the
present experiment dataset, the overall model, A and B are highly sig
nificant at 1 % level of significance. The quadratic effect of A i.e. A2 also
remains significant at 1% level of significance. All other effects remain
non-significant at 5 % level of significance. The R2 = 0.9945 for the
model indicates the model is able to explain 99.45 % variability which is
quite good. The adjusted R2 = 0.9845 which is also quite good, indicates
Source
Sum of square
df
Mean square
F
Model
Frequency (A)
Time (B)
Solvent (C)
AB
AC
BC
A2
B2
C2
AC2
BC2
Residual
Cor Total
4.37
0.30
5.559E-003
1.106E-003
2.500E-003
1.225E-003
2.250E-004
0.27
1.026E-003
1.097E-003
1.012E-003
0.023
6.667E-005
4.37
11
1
1
1
1
1
1
1
1
1
1
1
3
14
0.40
0.30
5.559E-003
1.106E-003
2.500E-003
1.225E-003
2.250E-004
0.27
1.026E-003
1.097E-003
1.012E-003
0.023
2.222E-005
17876.73**
13412.46**
250.17**
49.77**
112.50**
55.12**
10.12*
12262.62**
46.15**
49.37**
45.56**
1040.06**
*, ** significance at 5 % and 1 % respectively.
4
R. Sarkar et al.
Carbohydrate Polymers 251 (2021) 117042
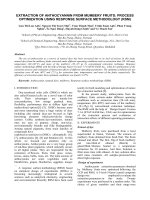
(Fig. 1A–C). 3D plots depicts the interaction between two variables
keeping the third factor constant. Here, only graph with second order
interaction effects are plotted. Fig. 1A and D indicates that keeping
solvent to solute at ratio 4.5, maxima with highest desirability lies to
wards the higher percentage of ultrasonication amplitude and Time
(sec). Whereas, Fig. 2B and E indicates that keeping time at 180 s,
maxima with highest desirability lies towards the higher values of
amplitude and intermediate values of solute to solvent ratio. Fig. 3C and
F indicates that keeping ultrasonication amplitude of 100 %, maxima
with high desirability lies towards the higher values of time and inter
mediate values of solvent to solute ratio.
Table 3
Comparison between optimum conditions predicted by BBD and GA models for
UAE and MAE.
Approach
UAEBBD
UAEGA
MAEBBD
MAEGA
*
Inulin (%)
Predicted
Experimental*
12.23
12.24
11.57
11.53
11.97
12.15
11.21
11.38
average of three analysis.
3.2.2. Extraction parameters for MAE
Similar experiment was conducted for MAE of inulin from the same
matrix. Three factors for the BBD experiments are (microwave power
Optimum point is fixed as 100 % amplitude, 180 s time and solvent to
solute ratio of 4.5. It can be seen that, the optimum point maximize the
inulin (%) and the predicted maximum value is 12.23 % with the
)
)
)
(
(
(
Inulin yield(%) = 19.11 + 7.49 × 10− 4 A1 − 0.07B1 − 4.25C1 + 1.17 × 10− 5 A1 B1 − 8.33 × 10− 4 A1 C1 + 0.03 B1 C1
)
)
)
)
(
(
(
(
+ 5.93 × 10− 7 A21 − 1.30 × 10− 5 B21 + 0.47 C12 + 9.17 × 10− 5 A1 C12 − 3.60 × 10− 3 B1 C12
maximum desirability value (Fig. S2). The optimum value may lie be
tween 12.22–12.25%. Predicted values of the experiment was validated
in laboratory and presented in Table 3.
Out of three variables, interaction between two factors is presented
in the form of 3D response surface curve and their contour plots
(A1), time (B1) and solvent to solute ratio (C1) is a response surface
design. The analysis revealed that for the given dataset, the overall
model, A1 and B1 are significant at 1% level of significance with p-values
as 0.004, <0.0001 and 0.003 respectively. All other effects remain nonsignificant at 5 % level of significance except the interaction A1B1 (p-
Fig. 1. Contour (A, B, C) and response surface plots (D, E, F) for the interaction between amplitude and time, amplitude and solvent, solvent and time in UAE
optimization experiment.
5
R. Sarkar et al.
Carbohydrate Polymers 251 (2021) 117042
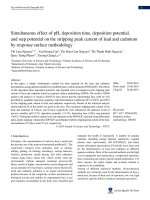
Fig. 2. Contour (A, B, C) and response surface plots (D, E, F) for the interaction between power and time, power and solvent, solvent and time in MAE optimi
zation experiment.
value: 0.0310). The R2 = 0.9862 for the model indicates the model is
able to explain 98.62 % variability which is quite good and the adjusted
R2 = 0.9614. It is to be noted here that, the adjusted R2 will increase if
only significant variables included in the model. However, the overall
lack-of-fit also remains significant (p-value: 0.0160) at 5 % level. The
non-significance of lack-of-fit might be due to the fact that second order
model is not exactly capturing all the variations in the data. Thus the
model was further analysed to make lack of fit non-significant.
Like the analysis done in case of UAE experiment, by hit and trial
method, different parametric combinations were considered and finally
the model fitting was done with the above quadratic model with addi
tional parameters as A1C21 and B1C21. So, the non-hierarchical cubic
model with A1C21 and B1C21 has been fitted again and the results are
summarized in Table 4. The model is highly significant at 1 % level of
significance with a p-value of <0.0001. The linear effect of microwave
power (p value <0.0001) and that of time (p value <0.0001) are highly
significant at 1% level of significance whereas the linear effect of solvent
to solute ratio remains significant at 5% level of significance. The
quadratic effect of microwave power i.e. A21 remains highly significant
and the interaction effect A1B1 and B1C21 remains significant at 1 % level
of significance whereas the effect of A1C21 (p value 0.0323) remains
significant at 5 % level of significance. For the fitted model, the lack of fit
test remain non-significant at 5 % level of significance which indicates
that the model fitted really well. R2 of 0.9998 and adjusted R2 of 0.9992
indicates the model is now able to explain almost all the variability. The
final fitted model is as follows.
power, 179.9 s time and solvent to solute ratio of 4.55. It can be seen
that, the optimum point maximize the inulin % and the predicted
maximum value is 11.57 % with the maximum desirability value
(Fig. S3). The optimum value may lie between 11.54 to 11.60. The op
timum point was validated in lab and presented in Table 3.
The two factor interaction wise contour plots and 3D plots are as
follows [only graph with second order interaction effects are plotted].
Fig. 2A and D indicates that keeping time at 179.9 s, maxima with
highest desirability lies towards the higher values of power and inter
mediate values of solvent (mL). Figs. 2B and 5 E indicates that keeping
solvent at 4.5 mL, maxima with highest desirability lies towards the
higher values of amplitude and time (Sec). Fig. 3C & F indicates that
keeping strength at 899.9 W, maxima with high desirability lies towards
the higher values of time and intermediate values of solvent to solute
ratio.
3.3. Optimization of the extraction condition using GA
3.3.1. Extraction parameters for UAE
Recently, genetic algorithm has been successfully explored for the
optimization of parameters. Muthusamy et al., 2019 studied optimum
extraction condition for the separation of pectin from sunflower heads
by a genetic algorithm approach. Maximum experimental yield of pectin
from the heads was 29.5 % as compared to 29.1 %, predicted by ANN
coupled GA. Comparable prediction was recorded by RSM and ANN-GA
approaches and both are found suitable for the optimization purpose.
Sodeifian et al., 2016 also used both of these approaches to optimize
extraction of essential oil from Ferulago angulate using supercritical fluid
and it was concluded that ANN-GA models were found to be more
Based on that, optimum point is fixed as 899.9 W of microwave
6
R. Sarkar et al.
Carbohydrate Polymers 251 (2021) 117042
accurate than RSM, although both the approaches showed good agree
ment with the experimental data. Optimised extraction yield was 0.85
and 0.86 % by the RSM and ANN-GA models respectively and it was
comparable to the experimental yield (0.87 %). Hatami et al., 2010
explored genetic algorithm for the optimization of pressure and tem
perature for the supercritical fluid extraction of oil from clove bud using
CO2 as extraction solvent. Pressure and temperature was optimized for
the maximum extraction of clove oil by GA approach.
For the second order response surface model fitted to the data, lack of
fit remains significant at 5% level of significance. As a result a nonhierarchical third order polynomial have been fitted. Alternatively, an
exponential form of second order response surface model as follows was
also fitted to the data which lead to non-linear model fitting.
2
2
2
y = e(β0 +β1 ∗A+β2 ∗B+β3 ∗C+β11 ∗A +β22 ∗B +β33 ∗C +β12 ∗AB+β13 ∗AC+β23 ∗BC)
Here, A: Amplitude, B: Time and C: Solvent to solute ratio
The non-linear model fitting was done through iterative procedure
using Gauss-Newton method of non-linear least square. The convergence
criteria satisfied after 5 iteration. The model remains highly significant
at 1% level of significance. The estimated parameters are presented in
Table 5 and Table S2.
The fitted equation is as follows:
− 3
− 2
− 6
2
Inulin yield(%) = e [2 . 47− (4 . 10 × 10 )A− (2 . 98 × 10 )B+0 . 06C +(3 . 33 × 10 )A
) 2
(
− 5
+ 9 . 76 × 10 B
)
(
)
(
− 0 . 006 C 2 + 1 . 75 × 10− 5 AB − 5 . 70 × 10− 5 AC
(
)
]
+ 2 . 00 × 10− 4 BC
Since the model is highly significant, as a result the fitted model was
used for genetic algorithm optimization for finding optimal solution.
Genetic algorithms, a mathematical model inspired by the famous
Charles Darwin’s idea of natural selection is being used for the optimi
zation. Principle of natural selection illustrates the preservation of only
the fittest individuals, over different generations. An evolutionary al
gorithm which improves the selection over time. Basic concept of GA is
to combine the different solutions, generation after generation to extract
the best information for each one. Advantage of this approach over other
optimization methods is that it allows the best solution to emerge from
the best of prior solutions. That way it creates new and more fitted in
dividuals. The GA approach has been effectively used in optimization
problem.
GA produces random solution in the first generations if there is no
seed values (starting solutions) are provided. - Best solutions, with least
or most return value based on the nature of optimization, are picked on
which genetic operators is applied to produce a new solution as part of
the second generation. GA produces more unique random solutions in
the second generation. This process continues until the most optimal
solutions is reached or the generation hard limit is reached.
GA has two basic genetic operators which are Cross Over and Mu
tation. Cross Over: Two parent solutions are selected and their attributes
are swapped to produce modified child solutions. Mutation: A parent
solution is picked and altered to produce a better solution.
The fitted non-linear second order response surface model as given
above was considered as objective function. After 1000 iteration, opti
mization results are summarized as follows:
Fig. 3. Best fitness value vs. no. of generations in the GA experiment of UAE (a)
and MAE (b) experiment.
Table 4
Analysis of variance (ANOVA) for the BBD fitted model for optimization of inulin
by MAE optimization experiment.
Source
Sum of square
df
Mean square
F
Model
Frequency (A)
Time (B)
Solvent (C)
AB
AC
BC
A2
B2
C2
AC2
BC2
Residual
Cor Total
1.81
0.62
0.30
1.800E-003
0.044
2.500E-005
2.500E-005
0.011
5.026E-004
3.103E-004
1.513E-003
0.023
3.167E-004
1.81
11
1
1
1
1
1
1
1
1
1
1
1
3
14
0.16
0.62
0.30
1.800E-003
0.044
2.500E-005
2.500E-005
0.011
5.026E-004
3.103E-004
1.513E-003
0.023
1.056E-004
1559.52***
5912.53***
2865.79***
17.05**
417.79***
0.24
0.24
99.50***
4.76
2.94
14.33**
218.96***
*significance at 10 %, ** significance at 5 %, *** significance at 1 %.
Table 5
ANOVA of the non-linear model of GA for optimization of inulin by UAE and
MAE.
Source
UAE
Model
Error
Uncorrected Total
MAE
Model
Error
Uncorrected Total
DF
Sum of Squares
Mean Square
F Value
p value
10
5
15
1874.0
0.2153
1874.2
187.4
0.0431
4351.16
<.0001
10
5
15
1741.9
0.0231
1741.9
174.2
0.00461
37754.6
<.0001
GA settings
Type
Population size
Number of generations
Elitism
Crossover probability
Mutation probability
Search domain
Lower
Real valued
50
1000
2
0.8
0.1
A
60
B
120
C
3.5
(continued on next page)
7
R. Sarkar et al.
Carbohydrate Polymers 251 (2021) 117042
(continued )
Upper
GA Results
Iterations
Fitness function value
100
180
are presented in Table 5 and Table S3. The fitted equation in this case is
as follows:
5.5
− 4
− 3
− 7
2
Inulin yield(%) = e [2 . 25− (8.00 ×10 )A1 + (4.99 ×10 )B1 +0 . 008C1 +(4.79 ×10 )A1
) 2 (
) 2 (
(
− 5
− 3
C1 + 1 . 01
− 1.52 × 10 B1 − 8.80 × 10
)
)
(
(
− 5
− 6
× 10 A1 B1 − 9.70 × 10 A1 C1 + 6.80
)
]
× 10− 5 B1 C1
1000
12.24945
The optimum solution was obtained with 0.8 crossover probability
which is quite high. The mutation probability is 0.1 which is in lower
side as desirable. The final fitness value for the optimum solution is
12.25. The optimum combination comprised of ultrasonic amplitude of
100 %, time of 180 s and solvent to solute ratio of 5.59 for the inulin
yield of 12.79 %.
It is to be noted here that, the fitness function value itself is the
optimal value at the optimal solution point as obtained through the
genetic algorithm approach. Iteration results are presented in Fig. 3a.
The predicted value was validated in the laboratory and the result is
presented in Table 3.
Here, A: Power, B: Time and C: Solvent to solute ratio. Since the
model is highly significant, as a result the fitted model was used for
genetic algorithm optimization for finding optimal solution.
GA settings
Type
Population size
Number of generations
Elitism
Crossover probability
Mutation probability
Search domain
3.3.2. Extraction parameters for MAE
For optimization of MAE also, similar experiment was planned and
analysed the data using genetic algorithms. The estimated parameters
Lower
Upper
Real valued
50
1000
2
0.8
0.1
A1
300
900
B1
120
180
C1
3.5
5.5
(continued on next page)
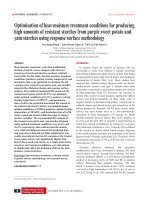
Fig. 4. SEM images of raw (A), UAE (B), MAE (C) and conventionally (D) extracted residual material of Pachyrhizus erosus tuberous root.
8
R. Sarkar et al.
Carbohydrate Polymers 251 (2021) 117042
Table 6
Purity (%) and effect of UAE/MAE on the degree of polymerization of inulin.
Sample
Total
fructose
(%)
Free
fructose
(%)
Total
glucose
(%)
Inulin
(%
purity)
Degree of
Polymerisation
M300T120
M900T180
U60T120
U100T120
Conventional
method
68.54
66.75
76.34
73.31
58.3
1.26
1.24
1.27
1.25
1.32
4.61
4.52
4.82
4.78
3.98
66.94
65.18
74.69
71.70
56.70
15.87
15.77
16.84
16.34
15.65
M300T120 and M900T180 represents inulin extracted by microwave with power of
300 MHz for 120 s and 900 MHz for 180 s. U60T120 and U100T120 represents
ultrasound amplitude of 60 % for 120 s and 100 % for 180 s.
disintegration facilitated better penetration of solvent inside the matrix,
followed by acoustic cavitation yielded better extraction efficiency (Xia
et al., 2011).
Whereas, the pattern was different in MAE residual material, where
more disintegration at surface level was observed. Texture was crum
bled in a significant manner (Dahmoune, Nayak, Moussi, Remini, &
Madani, 2015). Microwave irradiation along with rise in temperature
helped the disintegration and thus release of inulin in the adjacent sol
vent facilitated. Scanning electron micrograph of P. radiata bark upon
Soxhlet, UAE and MAE of phenolics showed significant cell destruction
(Asp´
e & Fern´
andez, 2011).
Better yield in UAE and MAE method than conventional one was
attributed to disruption of cellular structure followed by better pene
tration of solvent inside the matrix with acoustic cavitation/enhanced
temperature. On the contrary, diffusion of solvent inside the matrix by
following Fick’s law of diffusion, which led to solubilization of inulin
and mass transfer to the bulk solution is the major mechanism in con
ventional extraction method. 3.5. Purity and degree of polymerization of
inulin
HPLC chromatogram of two monomers i.e. fructose and glucose
present in inulin was obtained (Fig S4.) upon acidic hydrolysis with 0.1
% of HCl. Retention time of both the sugars were confirmed by running
respective standards under similar condition. Being fructooligosaccharide, fructose is the major fraction with glucosyl moiety at
terminal end (Barclay, Ginic-Markovic, Cooper, & Petrovsky, 2016). The
obtained chromatogram supports the fact and confirmed. Kristo, Foo,
Hill, & Corredig, 2011 estimated inulin in dairy matrix by using LC with
evaporative light scattering detector with good repeatability and
reproducibility. The investigation used inulinase for the hydrolysis of
inulin.
Purity per cent of inulin was measured for UAE and MAE extracted
inulin. In both the methods, minimum and maximum exposure condi
tion was selected viz. for UAE, 60 % amplitude for 120 s and 100 %
amplitude for 180 s; for MAE 300 MHz for 120 s and 900 MHz for 180 s
for the comparison study. Data of the experiment is presented in Table 6.
In general, there is no difference between maximum and minimum
exposure condition of UAE and MAE. Whereas, a shade difference was
observed between UAE and MAE in terms of purity of inulin. Purity was
least (56.7 %) in the conventionally extracted inulin, which might be
attributed to more extraction of unwanted materials due to long expo
sure time at boiling condition of water.
There are a few reports on effect of processing specifically heating on
the degradation of inulin. Hydrolysis kinetics of fructo-oligosaccharide
was studied across pH range and temperature (80–120 ◦ C) (L’homme,
Arbelot, Puigserver, & Biagini, 2003). At 90− 100 ◦ C, complete degra
dation of fructo-oligosaccharide oligomers was reported in 11.5 h.
ă
(Matusek, Meresz, Le, & Orsi,
2009). In the present study, degree of
polymerization was maximum in UAE extracted inulin and it was su
perior than the inulin extracted by MAE and conventional methods. It
might be attributed to more heating in MAE and conventional methods.
Fig. 5. O.D values (A) and bacterial count (B) in samples of culture media with
no carbon source (without glucose), with glucose and with inulin.
(continued )
GA Results
Iterations
Fitness function value
1000
11.53069
The optimum solution was obtained with 0.8 crossover probability
which is quite high. The mutation probability is 0.1 which is in lower
side as desirable. The final fitness value for the optimum solution is
11.53069. The optimum combination is as follows:
The optimum combination comprised of microwave power of 900 W,
time of 180 s and solvent to solute ratio of 5.22 for the inulin yield of
11.53 %. Iteration results have been presented in Fig. 3b. The data came
out of the analysis was required to be validated and thus the same was
done in the laboratory and the result is presented in Table 3.
3.4. Scanning electron microscopy
Images of untreated root powder of P. erosus along with UAE, MAE
and conventionally extracted residual materials are presented in
Fig. 4A–D. Slight rupture of the outermost cells were observed in
conventionally extracted residual material, when we compare with the
untreated material. But significant changes in the outermost cell struc
ture were observed in the UAE and MAE extracted residual materials.
MAE and UAE technique produced severe rupture in the leaf cells while
extraction of polyphenols from Myrtus communis leaves, which was
evidenced from the SEM picture.
Interestingly, disintegration pattern in UAE and MAE are different.
Dong et al., 2016 also reported similar observation while extraction of
polysaccharides from Chuanminshen violaceum. Ultrasonic soundwaves
seems to rupture more intensely than all other extraction protocols.
Acoustic cavitation led to the severe damage of the outermost cells and
helped in formation of bigger cracks at surface, which enhanced the
maximum release of inulin from the matrix to the bulk solvent. Better
9
R. Sarkar et al.
Carbohydrate Polymers 251 (2021) 117042
3.5. Prebiotic activity
Table 7
Comparison of energy consumption.
In this study first the growth of the microbe i.e. Lactobacillus fer
mentum was observed to decide incubation period to perform prebiotic
activity. It has been seen that the lag phase lasted for 18 h. Then the
strain grew exponentially which suggested it was in logarithmic phase.
After that stationary phase began at 60 h and they started to decline after
72 h. That’s why prebiotic activity was studied up to 72 h after culture
fermentation to understand the effect of inulin over microbial
population.
Fig. 5 displays increase in OD value of culture medium fermented 72
h with pectin extracted from different citrus peels as sources of carbon.
Higher OD value denotes better growth of microbe and efficient utili
zation of inulin. During logarithmic phase (up to 48 h) as microbes grew
rapidly, there was minute variation between OD value of medium added
with glucose and inulin as carbon source. But in the stationary phase (up
to 72 h) OD value was distinctly higher in case of medium enriched with
inulin compared to glucose as carbon source. This type of trend indicates
effective fermentation of inulin by microbe over longer period of time.
Rubel, P´
erez, Genovese, & Manrique, 2014 studied in-vitro prebiotic
analysis of inulin from Helianthus tuberous L. using Lactobacillus para
casei and found significant prebiotic activity. As these
fructo-oligosaccharides substances get fermented, different organic
acids are formed that help to increase the microbiome, make these
substances an effective prebiotic ingredient. Similar reports were re
ported by Caleffi et al., 2015, where Pfaffia inulin was found to be highly
active as prebiotic when evaluated using bifidobacterial and lactoba
cillary populations.
The present result was further confirmed by counting bacterial col
ony from each respective culture media having glucose and inulin as
carbon source along with control that showed similar kind of trend as of
before (Fig. 5B). Higher bacterial population was observed in case of
inulin than others up to 72 h, showed nearly 36.4 % increase compared
to glucose as carbon source.
Approach
Total energy
consumption (KJ)
Energy
density
(J mL− 1)
Energy/
biomass
(MJ Kg
− 1
Biomass)
Carbon
emission
(kg CO2 kg
extract− 1)
UAEBBD
UAEGA
MAEBBD
MAEGA
Conventional
90
90
162
162
180
18.61
18.61
55.83
44.29
–
90
90
162
162
180
20.00
20.00
36.00
20.00
40.00
4. Conclusion
Process intensification for the production of inulin was successfully
optimized by UAE and MAE techniques by optimising the all the vari
ables. Amplitude of ultrasonicator/power of microwave oven, time and
solute to solvent ratio were optimized by GA and RSM techniques. Better
extraction was achieved by UAE as compared to MAE and both these
techniques were better than conventional hot extraction. Both these
techniques provided comparable inulin yield. Genetic algorithm
approach commensurate the optimized data, produced by RSM. Thus
both or either one can be used for the optimization of inulin from the
matrices. Reason behind the better extraction by UAE was confirmed by
the SEM analysis of the matrices. SEM picture of the matrices after
extraction revealed clear picture about the style of disruption on the
cellular structure. Microfractures were observed in root tissues extracted
by UAE, whereas surface modification was observed in MAE materials.
When the extracted materials were compared with the initial root tis
sues, difference in their rupture pattern was clearly observed.
Interestingly, UAE provided a shade better purity of extracted inulin
than other two techniques. Degree of polymerization in inulin was also
recorded to be better. Higher temperature in MAE and conventional
method might be attributed to slight degradation of inulin. Significant
prebiotic activity was recorded while evaluation using Lactobacillus
fermentum and it was 36 % more than glucose treatment. Enhancement
in microbial count significantly confirmed the activity.
When both these technologies were compared for the energy effi
ciency, UAE provided far lesser energy density than MAE. Carbon
emission was also comparatively a shade lesser in UAE experiments than
other techniques. Thus UAE can be considered to be more feasible for
mass production at industrial level and it should be sustainable in long
run.
3.6. Energy density and energy consumption
Energy density was measured for optimal condition of UAE and MAE
experiment in order to compare between two extraction principles. To
compare the efficacy of these two extraction techniques, energy density
was evaluated. Ev is the energy dissipated to the system provided by the
extracting system. From the energy density value, efficient extraction
system can be selected. Ev delivered by optimized condition of MAE is
far greater than UAE conditions. Thus, UAE proved to be energy effi
cient. Present result is in agreement with the results reported by Chen
et al. (2018) and Plazzotta et al. (2020). These investigations used
Orthosiphon stamineus fruit, citrus peel and peach waste as matrix for the
UAE.
Analysis for energy consumption is prerequisite for any technology,
which has the potential to be scaled upto industry level. Energy con
sumption pattern in each experiment is presented in Table 7. Total en
ergy consumption was maximum in conventional method (180 KJ) and
UAE experiments showed to be energy efficient as compared to MAE
experiments. The same trend was reflected in the carbon footprint
pattern also. Ultrasonication process generates ultrasound, mechanical
acoustic waves and it produces acoustic cavitation during extraction.
Significant amount of energy is being required to generate it and after
cell disruption the energy is converted into thermal energy. Whereas, for
the microwave radiation more energy is required to produce it. Similar
observation was reported by Jacotet-Navarro et al. (2015). For indus
trial viability, requirement of energy and the emission of carbon are to
important parameters needs to be evaluated. Vinatoru, Mason, & Cal
inescu (2017) reported in a review that 50–90 % reduction in foot print
in MAE over conventional method.
CRediT authorship contribution statement
Rohan Sarkar: Investigation, Data curation, Formal analysis,
Writing - original draft.
Arpan Bhowmik: Conceptualization, Investigation, Methodology,
Software, Resources, Validation.
Aditi Kundu: Supervision, methodology, Visualization, WritingEditing, Writing - review & editing.
Anirban Dutta: Supervision, Methodology, validation, Visualiza
tion, Writing - review & editing.
Lata Nain: Methodology, Formal analysis, Visualization, Resources.
Goutam Chawla: Data curation, Software, Writing - review & edit
ing, Resources.
Supradip Saha: Conceptualization, Formal analysis, Funding
acquisition, Writing - original draft, Writing - review & editing, Project
administration, Resources.
Declaration of Competing Interest
All the authors declare that there is no known competing financial
interests or personal relationships that could have influence the inves
tigation reported in this paper.
10
R. Sarkar et al.
Carbohydrate Polymers 251 (2021) 117042
Acknowledgments
L’homme, C., Arbelot, M., Puigserver, A., & Biagini, A. (2003). Kinetics of hydrolysis of
fructooligosaccharides in mineral-buffered aqueous solutions: Influence of pH and
temperature. Journal of Agricultural and Food Chemistry, 51(1), 224–228.
Li, J., Hu, D., Zong, W., Lv, G., Zhao, J., & Li, S. (2014). Determination of inulin-type
fructooligosaccharides in edible plants by high-performance liquid chromatography
with charged aerosol detector. Journal of Agricultural and Food Chemistry, 62(31),
7707–7713.
Li, S., Wu, Q., Yin, F., Zhu, Z., He, J., & Barba, F. J. (2018). Development of a combined
trifluoroacetic acid hydrolysis and HPLC-ELSD method to identify and quantify
inulin recovered from Jerusalem artichoke assisted by ultrasound extraction. Applied
Sciences, 8(5), 710.
Liu, G. L., Fu, G. Y., Chi, Z., & Chi, Z. M. (2014). Enhanced expression of the codonoptimized exo-inulinase gene from the yeast Meyerozyma guilliermondii in
Saccharomyces sp. W0 and bioethanol production from inulin. Applied Microbiology
and Biotechnology, 98(21), 9129–9138.
Lou, Z., Wang, H., Wang, D., & Zhang, Y. (2009). Preparation of inulin and phenols-rich
dietary fibre powder from burdock root. Carbohydrate Polymers, 78(4), 666671.
ă
Matusek, A., Mer
esz, P., Le, T. K. D., & Orsi,
F. (2009). Effect of temperature and pH on
the degradation of fructo-oligosaccharides. European Food Research and Technology,
228(3), 355–365.
Milani, E., Koocheki, A., & Golimovahhed, Q. A. (2011). Extraction of inulin from
Burdock root (Arctium lappa) using high intensity ultrasound. International Journal
of Food Science & Technology, 46(8), 1699–1704.
Miller, G. L. (1959). Use of dinitrosalicylic acid reagent for determination of reducing
sugar. Analytical Chemistry. />Muthusamy, S., Manickam, L. P., Murugesan, V., Muthukumaran, C., & Pugazhendhi, A.
(2019). Pectin extraction from Helianthus annuus (sunflower) heads using RSM and
ANN modelling by a genetic algorithm approach. International Journal of Biological
Macromolecules, 124, 750–758.
Olano-Martin, E., Mountzouris, K. C., Gibson, G. R., & Rastall, R. A. (2001). Continuous
production of pectic oligosaccharides in an enzyme membrane reactor. Journal of
Food Science, 66(7), 966–971.
Petkova, N., Vrancheva, R., Mihaylova, D., Ivanov, I., Pavlov, A., & Denev, P. (2015).
Antioxidant activity and fructan content in root extracts from elecampane (Inula
helenium L.). Journal of Biosciences and Biotechnology, 4(1), 101–107.
Plazzotta, S., Ibarz, R., Manzocco, L., & Martín-Belloso, O. (2020). Optimizing the
antioxidant biocompound recovery from peach waste extraction assisted by
ultrasounds or microwaves. Ultrasonics Sonochemistry, 63, Article 104954.
Ramos-De-La-Pena, A. M., Renard, C. M., Wicker, L., & Contreras-Esquivel, J. C. (2013).
Advances and perspectives of Pachyrhizus spp. in food science and biotechnology.
Trends in Food Science & Technology, 29(1), 44–54.
Rubel, I. A., P´
erez, E. E., Genovese, D. B., & Manrique, G. D. (2014). In vitro prebiotic
activity of inulin-rich carbohydrates extracted from Jerusalem artichoke (Helianthus
tuberosus L.) tubers at different storage times by Lactobacillus paracasei. Food
Research International, 62, 59–65.
Ruiz-Aceituno, L., García-Sarri´
o, M. J., Alonso-Rodriguez, B., Ramos, L., & Sanz, M. L.
(2016). Extraction of bioactive carbohydrates from artichoke (Cynara scolymus L.)
external bracts using microwave assisted extraction and pressurized liquid
extraction. Food Chemistry, 196, 1156–1162.
Saengkanuk, A., Nuchadomrong, S., Jogloy, S., Patanothai, A., & Srijaranai, S. (2011).
A simplified spectrophotometric method for the determination of inulin in Jerusalem
artichoke (Helianthus tuberosus L.) tubers. European Food Research and Technology,
233(4), 609–616.
Saikia, S., Mahnot, N. K., & Mahanta, C. L. (2016). A comparative study on the effect of
conventional thermal pasteurisation, microwave and ultrasound treatments on the
antioxidant activity of five fruit juices. Food Science and Technology International, 22
(4), 288–301.
Sodeifian, G., Sajadian, S. A., & Ardestani, N. S. (2016). Evaluation of the response
surface and hybrid artificial neural network-genetic algorithm methodologies to
determine extraction yield of Ferulago angulata through supercritical fluid. Journal
of the Taiwan Institute of Chemical Engineers, 60, 165–173.
Temkov, M., Petkova, N., Denev, P., & Krastanov, A. (2015). Characterization of inulin
from Helianthus tuberosus L. obtained by different extraction methods–Comparative
study. Scientific Works of University of Food Technologies, 62, 461–464.
Varghese, E., Bhowmik, A., Jaggi, S., Varghese, C., & Kaur, C. (2017). On the generation
of cost effective response surface designs. Computers and Electronics in Agriculture,
133, 37–45.
Vinatoru, M., Mason, T. J., & Calinescu, I. (2017). Ultrasonically assisted extraction
(UAE) and microwave assisted extraction (MAE) of functional compounds from plant
materials. TrAC Trends in Analytical Chemistry, 97, 159–178.
Xia, E. Q., Ai, X. X., Zang, S. Y., Guan, T. T., Xu, X. R., & Li, H. B. (2011). Ultrasoundassisted extraction of phillyrin from Forsythia suspensa. Ultrasonics Sonochemistry, 18
(2), 549–552.
Yansheng, C., Zhida, Z., Changping, L., Qingshan, L., Peifang, Y., & Welz-Biermann, U.
(2011). Microwave-assisted extraction of lactones from Ligusticum chuanxiong Hort.
using protic ionic liquids. Green Chemistry, 13(3), 666–670.
Authors are thankful to Head, Division of Agricultural Chemicals for
providing all the required facility for the execution of the experiment.
Authors are also grateful to Indian Council of Agricultural Research
(ICAR), New Delhi, India, for proving fellowship to the first author.
Appendix A. Supplementary data
Supplementary material related to this article can be found, in the
online version, at doi: />References
Abbasi, S., & Farzanmehr, H. (2009). Optimization of extracting conditions of inulin from
Iranian artichoke with/without ultrasound using response surface methodology.
Journal of Science and Technology of Agriculture and Natural Resources, 13(47 (B)),
423–436.
Alzorqi, I., Sudheer, S., Lu, T. J., & Manickam, S. (2017). Ultrasonically extracted β-Dglucan from artificially cultivated mushroom, characteristic properties and
antioxidant activity. Ultrasonics Sonochemistry, 35, 531–540.
Asp´e, E., & Fern´
andez, K. (2011). The effect of different extraction techniques on
extraction yield, total phenolic, and anti-radical capacity of extracts from Pinus
radiata Bark. Industrial Crops and Products, 34(1), 838–844.
Bagherian, H., Ashtiani, F. Z., Fouladitajar, A., & Mohtashamy, M. (2011). Comparisons
between conventional, microwave-and ultrasound-assisted methods for extraction of
pectin from grapefruit. Chemical Engineering and Processing Process Intensification, 50
(11-12), 1237–1243.
Barclay, T., Ginic-Markovic, M., Cooper, P., & Petrovsky, N. (2016). Inulin-a versatile
polysaccharide with multiple pharmaceutical and food chemical uses. Journal of
Excipients and Food Chemicals, 1(3), 1132.
Boronat, A. C., Ferreira-Maia, A. P., Matijasevich, A., & Wang, Y. P. (2017).
Epidemiology of functional gastrointestinal disorders in children and adolescents: A
systematic review. World Journal of Gastroenterology, 23(21), 3915.
Caleffi, E. R., Krausov´
a, G., Hyrˇslov´
a, I., Paredes, L. L. R., dos Santos, M. M.,
Sassaki, G. L., … de Oliveira, A. J. B. (2015). Isolation and prebiotic activity of
inulin-type fructan extracted from Pfaffia glomerata (Spreng) Pedersen roots.
International Journal of Biological Macromolecules, 80, 392–399.
Castellino, M., Renna, M., Leoni, B., Calasso, M., Difonzo, G., Santamaria, P., …
Paradiso, V. M. (2020). Conventional and unconventional recovery of inulin rich
extracts for food use from the roots of globe artichoke. Food Hydrocolloids, Article
105975.
Chan, C. H., See, T. Y., Yusoff, R., Ngoh, G. C., & Kow, K. W. (2017). Extraction of
bioactives from Orthosiphon stamineus using microwave and ultrasound-assisted
techniques: Process optimization and scale up. Food Chemistry, 221, 1382–1387.
Chen, S., Zeng, Z., Hu, N., Bai, B., Wang, H., & Suo, Y. (2018). Simultaneous optimization
of the ultrasound-assisted extraction for phenolic compounds content and
antioxidant activity of Lycium ruthenicum Murr. fruit using response surface
methodology. Food Chemistry, 242, 1–8.
Dahmoune, F., Nayak, B., Moussi, K., Remini, H., & Madani, K. (2015). Optimization of
microwave-assisted extraction of polyphenols from Myrtus communis L. leaves. Food
Chemistry, 166, 585–595.
Dong, H., Lin, S., Zhang, Q., Chen, H., Lan, W., Li, H., … Qin, W. (2016). Effect of
extraction methods on the properties and antioxidant activities of Chuanminshen
violaceum polysaccharides. International Journal of Biological Macromolecules, 93,
179–185.
Dubois, M., Gilles, K. A., Hamilton, J. K., Rebers, P. A., & Smith, F. J. A. C. (1956). Phenol
sulphuric acid method for total carbohydrate. Analytical Chemistry, 26, 350.
´ M. (2018). An ensemble
García, G. C., García-Pedrajas, N., Ruiz, I. L., & G´
omez-Nieto A,
approach for in silico prediction of Ames mutagenicity. Journal of Mathematical
Chemistry, 56(7), 2085–2098.
Hatami, T., Meireles, M. A. A., & Zahedi, G. (2010). Mathematical modeling and genetic
algorithm optimization of clove oil extraction with supercritical carbon dioxide. The
Journal of Supercritical Fluids, 51(3), 331–338.
Jacotet-Navarro, M., Rombaut, N., Fabiano-Tixier, A. S., Danguien, M., Bily, A., &
Chemat, F. (2015). Ultrasound versus microwave as green processes for extraction of
rosmarinic, carnosic and ursolic acids from rosemary. Ultrasonics Sonochemistry, 27,
102–109.
Kazibwe, Z., Kim, D. H., Chun, S., & Gopal, J. (2017). Ultrasonication assisted ultrafast
extraction of Tagetes erecta in water: Cannonading antimicrobial, antioxidant
components. Journal of Molecular Liquids, 229, 453–458.
Kristo, E., Foo, A., Hill, A. R., & Corredig, M. (2011). Determination of inulin in milk
using high-performance liquid chromatography with evaporative light scattering
detection. Journal of Dairy Science, 94(7), 3316–3321.
11