Structural properties of diluted alkali-soluble pectin from Pyrus communis L. in water and salt solutions
Bạn đang xem bản rút gọn của tài liệu. Xem và tải ngay bản đầy đủ của tài liệu tại đây (7.52 MB, 11 trang )
Carbohydrate Polymers 273 (2021) 118598
Contents lists available at ScienceDirect
Carbohydrate Polymers
journal homepage: www.elsevier.com/locate/carbpol
Structural properties of diluted alkali-soluble pectin from Pyrus communis L.
in water and salt solutions
´ ska , Piotr Pieczywek , Monika Szyman
´ska-Chargot ,
Jolanta Cie´sla *, Magdalena Koczan
Justyna Cybulska , Artur Zdunek
Institute of Agrophysics, Polish Academy of Sciences, Do´swiadczalna 4, 20-290 Lublin, Poland
A R T I C L E I N F O
A B S T R A C T
Keywords:
Cation effect
Diluted alkali-soluble pectin
Dynamic light scattering
Gel point
Pear fruit pectin
Self-assembly
The self-assembly and gelation of low-methoxyl diluted alkali-soluble pectin (LM DASP) from pear fruit (Pyrus
communis L. cv. Conference) was studied in water and salt solutions (NaCl and CaCl2, constant ionic strength)
without pH adjustment at 20 ◦ C. The samples at different LM DASP concentrations were characterized using
rheological tests, Fourier-transform infrared spectroscopy, dual-angle dynamic light scattering and atomic force
microscopy. LM DASP from pear fruit (Pyrus communis L.) showed gelling ability. The indices (aggregation index
and shape factor) based on light scattering may be useful for the characterization of structural changes in
polysaccharide suspension, particularly for the determination of a gel point. The results obtained may be
important for the food, cosmetic and pharmaceutical industries where pectin is used as a texturizer, an encap
sulating agent, a carrier of bioactive substances or a gelling agent.
1. Introduction
Pectin is an important component of the plant cell wall which affects
the texture of fruits (Paniagua et al., 2014). Three associated poly
saccharides are the main components of this biopolymer: the linear
homogalacturonan (HG) which consists of (1–4)-α-D-galacturonosyl
units with different degrees of methyl-esterification; type I rhamnoga
lacturonan where the (1–2)-α-L-rhamnopyranosyl units in the backbone
of the molecule have side branches which contain the (1–5)-α-L-arabi
nofuranosyl or/and (1–4)-β-D-galactopyranosyl residues; and type II
rhamnogalacturonan, the backbone of which is composed of at least
eight (1–4)-α-D-galacturonosyl units and twelve different types of sugars
with dozens of different linkages being present in branched chains
(Schols & Voragen, 1994; Schols, Voragen, & Colquhoun, 1994).
Pectin is a safe, readily-available and relatively inexpensive
biopolymer. It is a very functional material that is used as a prebiotic
carrier, an encapsulating agent, a texturizer and a component of com
posites for 3D printed food in the food industry, a carrier of active
substances in the drug delivery systems, a binder of radioactive com
pounds, a sorbent of metals (medicine and water purification) as well as
a tissue scaffold for tissue engineering (Moslemi, 2021). The main source
of commercial pectin are citrus fruits and apples, and which is wellknown to form a gel (Moslemi, 2021). However, the pear (Pyrus
communis L.) fruit which contains over 14% wt. of carbohydrates (Itai,
2007) may be an alternative to those which are commonly used. Pyrus
communis L. is one of the main commercial species in Europe, North and
South America, Africa and Australia (Food and Agriculture Organization
of the United Nations, 2019). Pectin extracted from the Pyrus communis
L. fruit has not been thoroughly investigated till date, and this includes
its behaviour in aqueous dispersion in the presence of various cations.
The sequential extraction of polysaccharides from the plant cell wall
provides an opportunity to obtain the pectin fractions soluble in various
liquids, e.g. water-soluble, chelator (cyclohexanetrans-1,2-diamine-N,N,
N′ ,N′ -tetraaceate; CDTA)-soluble, or sodium carbonate-soluble pectin
(also known as diluted alkali-soluble pectin, i.e. DASP) (Gawkowska,
Cybulska, & Zdunek, 2018). These fractions differ in the chemical
structure of their constituent macromolecules (Pos´e, Kirby, Mercado,
´ ska-Chargot & Zdunek, 2013; Zdunek,
Morris, & Quesada, 2012; Szyman
Kozioł, Pieczywek, & Cybulska, 2014) and also in their physicochemical
properties (Zhu et al., 2018, 2017). Moreover, the composition of the
cell wall depends on the stage of the growth and development of the
plant and the plant organs. The amount of water- and chelator-soluble
pectin is reported to increase and that of DASP to decrease during
ripening of Pyrus communis L., cv. Blanquille. This is accompanied by
simultaneous decrease in the degree of methyl esterification (MartínCabrejas, Waldron, & Selvendran, 1994). DASP refers to the pectin
* Corresponding author.
E-mail address: (J. Cie´sla).
/>Received 4 March 2021; Received in revised form 18 August 2021; Accepted 19 August 2021
Available online 24 August 2021
0144-8617/© 2021 The Author(s).
Published by Elsevier Ltd.
This is an
( />
open
access
article
under
the
CC
BY-NC-ND
license
J. Cie´sla et al.
Carbohydrate Polymers 273 (2021) 118598
which is rich in rhamnogalacturonan I and is bound to the plant cell wall
by ester linkages (Brummell, 2006; Pos´e, Kirby, Mercado, Morris, &
Quesada, 2012). The macromolecules of DASP revealed the ability to
form a network on mica. It was shown previously that this fraction is
important for maintaining the mechanical properties of the plant cell
wall during the postharvest storage of pear fruit (Zdunek, Kozioł,
Cybulska, Lekka, & Pieczywek, 2016; Zdunek, Kozioł, Pieczywek, &
Cybulska, 2014). The DASP fraction from pear fruit is rich in arabinose.
For Pyrus communis, cv. Barlett, the content of this sugar ranges from 59
to 84 mol% of neutral sugars, depending on the sunlight conditions
during ripening as well as the conditions for postharvest storage (Raffo,
Ponce, Sozzi., Vincente, & Stortz, 2011), whereas for cv. S. Bartolomeu it
is about 50 mol% of cell wall sugars (Ferreira, Barros, Coimbra, &
Delgadillo, 2001). The changes in the dimensions of the DASP macro
molecules are dependent on the ripening stage, postharvest storage
duration and condition of the fruit (Paniagua et al., 2014). The length of
the molecules and their ability to form a network are reduced during
postharvest storage due to the enzymatic degradation of polysaccharides
(Cybulska, Zdunek, & Kozioł, 2015; Paniagua et al., 2014; Pieczywek,
Cybulska, & Zdunek, 2020; Zdunek, Kozioł, Pieczywek, & Cybulska,
2014).
The gelation of pectin in liquid media is one of the most important
utilitarian attributes of this polysaccharide, which affects the use of
pectin in the food, cosmetic and pharmaceutical industries. According to
IUPAC (International Union of Pure and Applied Chemistry) terminol
ogy, gelation is a process of passing through the initial network forma
tion (gel point) to form a chemical or physical polymer network (gel)
which expands throughout the whole volume of the liquid. Usually, the
viscosity tending to infinity is an indicator that the gel point has been
reached. A network can be obtained due to crosslinking as well as
through the physical aggregation of polymer chains. Crosslinking is the
chemical interaction of active sites or functional groups of macromole
cules that leads to the formation of branching point for at least four
chains in a macromolecule. The aggregation of chains occurs due to
formation of hydrogen bonds, ionic interactions, and hydrophobic in
teractions (McNaught and Wilkinson, 1997). The spontaneous rear
rangement of macromolecules into ordered superstructures dispersing in
liquid, which occurs due to physical interactions, is defined as selfassembly. In nature this process results in the development of
biopolymer fibres and cell membranes (Dahman, Caruso, Eleosida, &
Hasnain, 2017).
The process of pectin gelation is affected by many factors such as the
chemical structure of the biopolymer (the molecular size, number and
arrangement of the side chains and the degree of methyl-esterification),
density of electrical charge on the macromolecule, pH and composition
of the dispersing medium, temperature, etc. (Moslemi, 2021). In the case
of low-methoxyl (LM) pectin, to which DASP belongs, this process may
occur:
et al., 2015; Fang et al., 2008; Fraeye et al., 2010; Ventura, Jammal,
& Bianco-Peled, 2013).
The structural reorganization of macromolecules in a liquid is usuư
ăm, Schuster, & Goh,
ally characterized using rheological tests (Stro
2014), scanning electron microscopy (Basak & Bandyopadhyay, 2014)
or atomic force microscopy (Pos´
e, Kirby, Mercado, Morris, & Quesada,
2012; Zdunek, Kozioł, Pieczywek, & Cybulska, 2014). The aggregation
index (AI), which is based on the dynamic light scattering data, can be
useful for description of the self-assembly of DASP in the water (Gaw
kowska, Cie´sla, Zdunek, & Cybulska, 2019b). The AI is calculated by the
subtraction of the mean hydrodynamic diameter which is determined
using the back scattering (Zave,backward) from the mean hydrodynamic
diameter which is determined using the forward scattering data (Zave,
forward), and next, dividing the obtained difference by the mean hydro
dynamic diameter determined from the back scattering (Zave,backward):
(
)/
AI = Zave,forward − Zave,backward Zave,backward
(1)
AI was initially proposed for the determination of protein aggrega
tion (Zetasizer Nano Application Note, 2010). In the case of the systems
which are transparent to light and contain the self-assemblies, the value
of AI is higher than zero. For the ideal homogeneous systems, the light
scattering is the same in all directions, and AI is 0. Considering the
polysaccharides dispersed in the liquid, AI equal to 0 may reflect the
regular three-dimensional distribution of macromolecules in the bulk of
the liquid. An increase in the concentration of the apple DASP in water
makes AI values negative. A value of − 1 reflects the lack of light
transmittance through the sample which corresponds a well networked
structure (Gawkowska, Cie´sla, Zdunek, & Cybulska, 2019b). Assuming
that for the spherical particles or the regular three-dimensional distri
bution of particles in the bulk of the liquid, the ratio of diameters ob
tained on the basis of both the back and forward light scattering is equal
to 1, a shape factor (SF) is proposed in the present work to determine the
deviation from this ideal state. SF is the ratio of a shorter mean hydro
dynamic diameter to a longer one among those determined using the
back and forward light scattering. The closer the SF value is to 1, the
rounder is the shape of the dispersed particles, or more homogeneous is
three-dimensional structure formed by DASP. In the case of diluted
systems, low values of SF indicate the presence of elongated particles.
For the concentrated suspensions, the SF value tending to 0 (the ‘loss’ of
one dimension) corresponds to a decline in the sample transparency.
Therefore, AI = 0 and SF = 1 corresponds to the homogeneous threedimensional distribution of macromolecules/particles in the liquid,
and the DASP concentration at AI = − 1 and SF ~ 0 reflects the gel point.
It was hypothesized that DASP originating from pear fruit is able to
form a network in the liquid (spontaneously in water and with the
participation of cations in salt solution) and the gel point can be deter
mined using the indices based on the light scattering (i.e. AI and SF).
This work could establish DASP from Pyrus communis L. fruit as a
functional material for use in food, pharmaceuticals, and in environ
mental engineering.
The investigations were performed over a wide range of DASP con
centrations to observe and identify the changes in samples properties.
Rheological tests, Fourier transform infrared (FT-IR) spectroscopy, dy
namic light scattering (DLS), and the analysis of images obtained from
atomic force microscopy (AFM) were carried out. A scheme of the in
vestigations is shown in Fig. S1.
a) at a low pH when the acidic functional groups of the macromolecules
are un-dissociated, the electrostatic repulsion between them is
reduced, and the macromolecules can self-organize due to the for
mation of hydrogen bonds (Capel, Nicolai, Duranda, Boulenguer, &
Langendorff, 2006; Gawkowska, Cie´sla, Zdunek, & Cybulska, 2019a;
Yuliarti & Mardyiah Binte Othman, 2018),
b) in the presence of monovalent cations when the neutralization of
negative electrical charge of macromolecules reduces the intermo
lecular repulsion (Fishman, Chau, Kolpak, & Brady, 2001; Wang
et al., 2019; Wehr, Menzies, & Blamey, 2004; Yoo, Fishman, Savary,
& Hotchkiss Jr., 2003),
c) in the solution of divalent cations when crosslinking occurs due to
the formation of both rod-like junction zones and point-like links
between the pectin chains and the monocomplexes; the mechanism
of gelation covers the monocomplexation of divalent cations by
macromolecules and the ‘egg-box’ dimers formation by mono
complexes without a clearly visible lateral association (Assifaoui
2. Materials and methods
2.1. The DASP dispersions
Lyophilized DASP was obtained (sequential extraction; fraction sol
uble in 50 mM Na2CO3 and 20 mM NaBH4) from pear fruit (Pyrus
´jec, Poland) and characterized
communis L., cultivar ‘Conference’, Gro
2
J. Cie´sla et al.
Carbohydrate Polymers 273 (2021) 118598
´ ska, Pieczywek, Cybulska, & Zdunek, 2021).
previously (Cie´sla, Koczan
The water content in the lyophilized samples was ~8 wt.%. The mo
lecular weight of the DASP, which was determined using the static light
scattering method, was 532 ± 11 kDa. The degree of methylesterification (DM) was ~3%. The lyophilized DASP contained about
70.77 ± 0.09 mg of Na and 3.62 ± 0.07 mg of Ca per 1 g of dry sample
´ ska, Pieczywek, Cybulska, & Zdunek, 2021). The
(Cie´sla, Koczan
monosaccharide (mannose: 2.0 ± 0.5 mol%; rhamnose: 5.3 ± 0.0 mol%;
glucose: 0.7 ± 0.2 mol%; galactose: 17.6 ± 0.1 mol%; xylose: 4.4 ± 0.1
mol%; arabinose: 34.1 ± 1.4 mol%; fucose: 0.5 ± 0.0 mol%) and uronic
acid (galacturonic acid (GalA): 33.3 ± 1.6 mol%; glucuronic acid: 2.3 ±
0.3 mol%) content was determined using high-performance liquid
chromatography (HPLC). The GalA (mol%) to rhamnose (mol%) ratio,
pointing out to the contribution of homogalacturonans versus rhamno
galacturonans, was 7. In the case of DASP from Pyrus communis L. cv. De
Cloche, this value was ~40 (Brahem, Renard, Gouble, Bureau, & Le
Bourvellec, 2017). For the studied DASP, the ratio of the sum of arabi
nose (mol%) and galactose (mol%) to the rhamnose content (mol%),
corresponding to the hairy regions (degree of rhamnogalacturonan
branching), was 10. The literature data show values ranging from 0 (cv.
S. Bartolomeu; Ferreira, Barros, Coimbra, & Delgadillo, 2001) to 8–32
(De Cloche and Barlett cultivars; Brahem, Renard, Gouble, Bureau, & Le
Bourvellec, 2017; Raffo, Ponce, Sozzi., Vincente, & Stortz, 2011). A
detailed description of the isolation and characterization of DASP from
Pyrus communis L., cv. Conference is placed in the Supplementary
material.
The DASP dispersions (1.8 ⋅ 10− 4–1.8 ⋅ 100% w/v) in the ultrapure
(MilliQ) water and the NaCl and CaCl2 solutions (ionic strength of 30
´
mM, corresponding to the previously studied systems; Cie´sla, Koczan
ska, Pieczywek, Cybulska, & Zdunek, 2021) were prepared, mixed for
24 h (20 ◦ C) and then analysed.
concerning which FT-IR wavenumbers contribute the most to the sep
aration of samples/observations.
2.4. Determination of the particle size in dispersions
Zetasizer Nano ZS (633 nm He–Ne laser light; Malvern Ltd., Mal
vern, UK) was used to characterize the particle size of DASP in the liquid
media at 20 ◦ C. The results of dynamic back light scattering (173◦ ) were
analysed by the apparatus software to determine the relaxation time (τ)
(International Standard ISO 22412, 2017).
The hydrodynamic diameter of particles was measured in six repli
cations at the detection angle of 173◦ (back scattering) and 13.7◦ (for
ward scattering) to calculate AI (Eq. 1, Gawkowska, Cie´sla, Zdunek, &
Cybulska, 2019b) and SF, i.e. indices based on the results of dynamic
light scattering. A non-linear estimation with the least squares method
was applied to describe the dependencies of AI and SF on the DASP
concentration (Statistica 12, StatSoft, Cracow, Poland). The models
which were best fitted to the experimental data were chosen.
2.5. AFM analysis of the DASP samples
The DASP dispersions (60 μl) were drop-deposited onto a freshly
cleaved mica base of 10 × 10 mm (EMS, Hatfield, PA, USA) and
distributed using a spin coater (SPS-Europe B.V., Midden Engweg 41,
NL-3882 TS PUTTEN, The Netherlands).
The air-dried samples were analysed at ambient temperature
(20–22 ◦ C) and at the relative humidity of 26–30%. A Multimode 8 with
a Nanoscope V controller (Bruker, Billerica, MA, USA) and automatic
PeakForce Tapping mode (ScanAsyst) was applied. A silicon pyramidal
tip on a nitride cantilever (nominal radius: 2 nm; nominal spring con
stant: 0.4 N/m; Bruker) was used. The scanning parameters were: the
area of 4 μm2 (aspect ratio 1:1, 2 μm × 2 μm), the resolution of 512 ×
512 points and the linear velocity of 0.9 Hz. For each sample, 9 images
were obtained and the heights of the AFM topographic images were
analysed. The AFM image processing steps are precisely described in the
Supplementary material section and shown graphically in Fig. S2. The
height of the molecules was defined as the maximum value within a 3 by
3 pixel window around each sampling point. The individual line sections
were also characterized by their lengths. The images of individual nonbranched and not intersecting objects were applied to calculate the
persistence length (P) of the molecules using a measurement of the mean
square of the end-to-end distance (R) as a function of distance along the
chain contour (l) (Rivetti, Guthold, & Bustamante, 1996):
⎛
⎞⎞
⎛
〈 2〉
2P
l
−
⎝1 − e 2P ⎠ ⎠
R = 4Pl⎝1 −
(2)
l
2.2. Rheological measurements
The viscous behaviour of the DASP dispersions was investigated with
a Discovery Hybrid Rheometer (TA Instruments, New Castle, DE, USA)
using a plate-and-plate geometry (20 mm diameter, 0.8 mm gap) at 20
o
C. The measurements were carried out in triplicate at a shear rate
ranging from 10− 1 to 102 s− 1. The Ostwald-de Waele (σ = b˙γ n ) and the
Herschel-Bulkley (σ = b˙γ n + C) models (where b is the consistency
index, n – is the flow index and C – is the yield stress) were used to
describe the dependence of shear stress (σ) on shear rate (˙γ ) (Bourne,
2002).
2.3. Determination of the FT-IR spectra
The FT-IR spectra of DASP dispersions (the same amount of each
sample) were recorded by Nicolet 6700 FT-IR spectrometer with Smart
Multi-Bounce HATR with a 10 reflection ZnSe crystal (Thermo Scienti
fic, Waltham, MA, USA). The ultrapure (MilliQ) water spectrum served
as a background. The spectral range was 4000–650 cm− 1 (resolution of
4 cm− 1) and 200 scans were accumulated twice (20 ± 1 ◦ C). Due to the
high level of noise, which was visible on the spectra of lowconcentration dispersions, the next calculations and analyses were
performed for selected samples (1.8 ⋅ 10− 3, 1.8 ⋅ 10− 2, 4.6 ⋅ 10− 2, 1.8 ⋅
10− 1, 4.6 ⋅ 10− 1, 9.2 ⋅ 10− 1 and 1.8 ⋅ 100% w/v) at a spectral range of
1800–900 cm− 1. This wavenumber range containing the most valuable
´ ska, Szyman
´ ska-Chargot, & Zdunek, 2016;
spectral information (Chylin
´ ska-Chargot, Chylin
´ ska, Kruk, & Zdunek, 2015) was used for
Szyman
PCA analysis. Multivariate statistical analyses of the spectra data were
performed using Unscrambler 10.1 (Camo Software AS., Norway). The
NIPALS algorithm was used and the maximum number of components
which explained the spectral variability of the samples was 3. The result
of the PCA analysis is the score plot which is a summary of the rela
tionship between the observations (samples) and each data point rep
resents a single spectrum and the loadings plot, which gives information
For the DASP concentrations at which the surface of the mica was no
longer visible nor the individual molecules, samples were described by
their surface properties, namely surface roughness Ra (the arithmetical
mean deviation of the assessed profile, Eq. 3) and Rq (the root mean
squared deviations of the profile, Eq. 4), defined as (International
Standard BS EN ISO 4287, 2000):
Ra =
∑1
∑ 1 y=N−
1 x=M−
|z(x, y) − z |
MN x=0 y=0
√̅̅̅̅̅̅̅̅̅̅̅̅̅̅̅̅̅̅̅̅̅̅̅̅̅̅̅̅̅̅̅̅̅̅̅̅̅̅̅̅̅̅̅̅̅̅̅̅̅̅̅̅̅̅̅
√
∑1
∑ 1 y=N−
√ 1 x=M−
̿
Rq = √
[z(x, y) − z ]2
MN x=0 y=0
(3)
̿
(4)
where: z(x,y) – the height of the image at the x, y point; z – the average
height of the image, and M, N – the total number of sampling points in
the x and y directions.
The P, Ra, Rq and lengths of the objects were not applicable for the
3
J. Cie´sla et al.
Carbohydrate Polymers 273 (2021) 118598
characterization of the visual appearance of DASP with CaCl2. In these
cases only the heights of the visible objects were calculated. Above 1.8 ⋅
10− 1% of DASP in CaCl2 solution the samples were too stiff to be dropdeposited on mica.
consistency index and to a simultaneous decrease in the flow index
value. For DASP in the CaCl2 solution an increase in the DASP content
over 4.6 ⋅ 10− 2% (i.e. a decrease in the Ca2+/COO− mole ratio below
8.2) resulted in a huge increase in the consistency index value with the
decreasing value of flow index. This was probably connected with a
reduction in the distance between nanoparticles, changes in the nano
particle structure, the possible formation of hydrogen bonds and Cabridges between macromolecules of adjacent nanoparticles and finally,
the network formation. At the highest concentration of DASP (1.8 ⋅
100%) in the water, NaCl solution and CaCl2 solution there were ob
tained the following values of consistency index: 21.28 ± 0.01, 54.33 ±
0.03 and 103,490 ± 10,620 mPa⋅sn, respectively. Simultaneously, the
flow index values were: 0.95 ± 0.01, 0.88 ± 0.00 and 0.19 ± 0.02. The
increase in the consistency index and decrease in the flow index with the
DASP concentration corresponded to the process of gelation. Similar
relationships were found for the aqueous dispersion of DASP from onion
at a concentration which increased from 0.5 to 2.0% (Zhu et al., 2017).
Other authors (Gawkowska, Cie´sla, Zdunek, & Cybulska, 2019b; Karaki,
Aljawish, Muniglia, Humeau, & Jasniewski, 2016; Stră
om, Schuster, &
Goh, 2014) pointed out that an increase in the content of LM pectin in
the aqueous dispersion can lead to a significant increase in viscosity
connected with weak gel formation. The process started at a pectin
concentration above 0.1% (Gawkowska, Ciesla, Zdunek, & Cybulska,
ăm, Schuster, & Goh, 2014) or even 1.0% (Karaki,
2019b), 0.5% (Stro
Aljawish, Muniglia, Humeau, & Jasniewski, 2016), depending on the
pectin source and the pH conditions. A high content of GalA in pectin
resulted in the process of gel formation occurring in the acidic envi
ronment without the presence of divalent cations (Gilsenan, Richardson,
& Morris, 2000).
2.6. Statistical analyses
The influence of DASP concentration and the dispersing medium
composition on the selected properties of the studied samples was
analysed using the two-factors ANOVA and post-hoc Tukey HSD test at
the 0.05 significance level (Statistica 13.1, StatSoft, Cracow, Poland).
3. Results and discussion
3.1. Rheological properties of DASP dispersions
The relationship between the shear stress and the shear rate
(10− 1–102 s− 1) obtained for the DASP dispersions in different media is
shown in Fig. S3. The Ostwald-de Waele and the Herschel-Bulkley
models (Bourne, 2002) were fitted to the measurement data. The re
sults are summarized in Tables S1 and S2. All of the dispersions tested
revealed the character of non-Newtonian liquids. For most of the DASP
dispersions at a low flow rate, the samples containing colloidal particles
of polysaccharide behave as sticky liquids. An increase in the flow rate
reduces the interactions between macromolecules leading to thinning.
In the case of DASP concentrations ranging from 9.2 ⋅ 10− 1 to 1.8 ⋅ 100%
in the CaCl2 solution, shear thinning was observed over the full range of
the applied shear rate, thereby revealing pseudo-plastic behaviour.
Probably with the increasing shear rate the network structure was
rearranged into the DASP nanoparticles from which it was formed. This
reduced the frictional resistance that was noticed as the shear thinning.
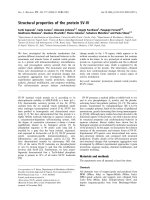
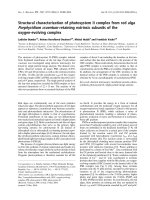
The influence of DASP concentration on the values of both the con
sistency and flow indices is graphically shown in Fig. 1. The effect of
both the DASP content and the dispersing medium composition was
visible. Generally, for the low-concentration systems (≤1.8 ⋅ 10− 2%) the
values of consistency index increased in the following order of
dispersing media: CaCl2 < H2O < NaCl, whereas for the flow index it
was: H2O = NaCl < CaCl2. This revealed that in the CaCl2 solution the
salting-out process took place and the nanoparticles of DASP were pre
sent in the liquid (Li, Liao, Thakur, Zhang, & Wei, 2018). Up to the DASP
concentration of 1.8 ⋅ 10− 1%, the consistency and flow indices were
constant for the dispersions in water and in NaCl solution. Next, an in
crease in the amount of DASP led to a significant increase in the
3.2. FT-IR spectra of the DASP dispersions
FT-IR spectra were collected for DASP dispersed in water, NaCl so
lution and CaCl2 solution (Fig. S4) in order to obtain information about
the functional groups of macromolecules and thence – about the inter
molecular interactions. A detailed description of the spectra is included
in the Supplementary material. In brief, in the case of pectin, the most
striking feature is the region between 1800 and 1500 cm− 1 which pro
vides insight into the esterified (–COOCH3) and undissociated carboxyl
groups (–COOH) (band at 1760–1730 cm− 1), non-esterified carboxyl
groups and stretching vibration of the carboxylate ion (–COO− )
(1650–1550 cm− 1) (Filippov, 1972; Zhao et al., 2018). However, in the
case of DASP, all these groups undergo de-esterification during the
Fig. 1. The relationship between a) the consistency index, b) the flow index and concentration of diluted alkali-soluble pectin (DASP) of pear fruit (Pyrus communis
L., cv. Conference) which was obtained by fitting the Herschel-Bulkley model to the measurement data; different letters indicate significantly different results (twoway ANOVA and post-hoc HSD Tukey test, p < 0.05).
4
J. Cie´sla et al.
Carbohydrate Polymers 273 (2021) 118598
fraction separation in alkaline solution leading to a diminished band
with the maximum at around 1740 cm− 1 (Paniagua et al., 2017).
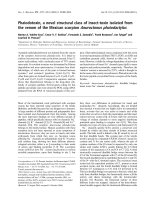
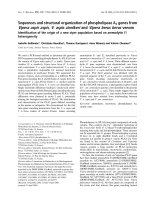
The principal component analysis (PCA) is one of the most
commonly used chemometric methods for data reduction and the
exploratory analysis of high-dimensional data sets (Fig. 2.). The score
and loading plots are obtained as a result of the analysis. The score plot
presents sample grouping due to their spectral similarity, while the
loading plot provides information concerning which wavenumbers have
the greatest influence on samples scattering along the principal
component (PC) axes. The PCA analysis of the measured spectra was
performed in the range of 900–1800 cm− 1 since this region had the
greatest influence on variability between the samples.
The PCA score plots obtained for dispersions in water and also the
NaCl and CaCl2 solutions are presented in Fig. 2a–c. In the case of DASP
in water, PC1 explained nearly 100% of the variability encountered
(Fig. 2a). Loadings related to the PC1 scores as a function of wave
number presents the variance of FT-IR spectra (Fig. 2e). Therefore, the
scatter of points related to the samples alongside the PC1 axis reflects the
changes in the DASP concentration. In the case of DASP dispersions in
the salt solutions, PC1 explained the majority of the variability observed
(above 90%). The PC2 component explained only 1% (Fig. 2b) and 8%
(Fig. 2c) of the variability for the NaCl and CaCl2 solutions, respectively.
As is the case with aqueous dispersion, the PC1 loadings reflected the
spectral variance of the sample and the scatter of points alongside the
PC1 axis reflected the changing content of DASP. For DASP in the NaCl
solution the samples were divided into two groups as regards the PC2
scores. The positive influence had the PC2 loadings with the maximum
at 1633 cm− 1 which was probably connected to the solvated Na+ ions.
The wavenumbers at 1727, 1266, 1120 and 1077 cm− 1 exhibited the
negative influence. Previously, the band at 1727 cm− 1 was related to the
acetylated carbonyl groups vibration and that at 1266 cm− 1 was
assigned to the stretching of (C–O–C) in acetyl ester (Fig. 2f) (Syn
ˇ kova
´, Matˇ
ytsya, Copı́
ejka, & Machoviˇc, 2003). However, in this case, it is
more likely to be due to the vibration of carbonyl groups with the
attached metal ions. The bands at 1120 and 1077 cm− 1 can be assigned
to the ring and side group vibrations (C–C), (C–OH), (C–H) (Synytsya,
ˇ kova
´, Matˇ
Copı́
ejka, & Machoviˇc, 2003). In the case of the PC2 scores
obtained for DASP in the CaCl2 solution, the scatter is more visible – the
points denoting samples with the DASP concentration ranging from 1.8 ⋅
10− 2 to 9.2 ⋅ 10− 1% formed a large group while those denoting the
samples with 1.8 ⋅ 10− 3% and 1.8 ⋅ 100% of DASP were placed sepa
rately. The bands at 1102 and 1008 cm− 1 were probably connected with
the solvated Ca2+ ions, the uronic acid content and the backbone
stretching (Fig. 2g).
Positive influence on the PC2 scores was exhibited by the wave
numbers around 1734, 1465 and 1274 cm− 1 which can be assigned to
the esters of carboxyl groups. While the esterification of carboxyl groups
was impossible in this case, the most probable was that these wave
numbers denoted the vibration of Ca2+ ions attached to them.
The PC1 (which explained 98% of variability) vs. PC2 (1% of vari
ability) of the PCA score plot of DASP dispersions in different media are
shown in Fig. 2d. Three clusters can be separated. The first one contains
the highly-concentrated DASP samples (9.2 ⋅ 10− 1 and 1.8 ⋅ 100% in
H2O, 9.2 ⋅ 10− 1 and in the NaCl solution, and 1.8 ⋅ 100% in the CaCl2
solution). The next two areas are placed close to each other but the
samples can be divided into the separate groups containing the samples
with a tendency towards intermolecular interactions (4.6 ⋅ 10− 1% in
H2O, 1.8 ⋅ 10− 1 and 4.6 ⋅ 10− 1% in NaCl, 4.6 ⋅ 10− 2, 4.6 ⋅ 10− 1 and 9.2 ⋅
10− 1% in CaCl2) and those in the form of a low-concentration dispersion
(1.8 ⋅ 10− 3–1.8 ⋅ 10− 1% in H2O, 1.8 ⋅ 10− 3–4.6 ⋅ 10− 2% in NaCl, 1.8 ⋅
10− 2 and 1.8 ⋅ 10− 1% in CaCl2). The sample of 1.8 ⋅ 10− 3% DASP in the
CaCl2 solution was an outlier with the most negative values of PC1 and
PC2. The loadings related to both PC types are presented in Fig. 2h. Once
again the PC1 loadings had only positive values and reflected the vari
ance of spectra, which in turn is related to the concentration of DASP.
The PC2 loadings had both positive and negative values. The greatest
negative influence on the scattering of sample points along the PC2 had
the wavenumbers: 1724–1726, 1465, 1379 cm− 1, which probably
denoted the vibration of the carboxyl bands modified by ions (Ca2+ and
Na+ (Schiewer & Balaria, 2009), and 1274 cm− 1 related to the CH2
groups vibrations. While the negative influence on the scores had the
wavenumbers at 1623 cm− 1 (very broad band, probably resulting from
Ca2+ and Na+ ions binding to the carboxylic groups (Schiewer & Balaria,
2009), 1102 and 1017 cm− 1 (vibration of (C–O), (C2–C3), (C2–O2),
(C1–O1) in uronic acids in the galacturonic acid backbone). What is
interesting, the points denoting DASP in water alone were scattered
along the PC1 axis, but very close to 0 of PC2 which means that this
component did not have any influence over the variability of those
samples. The analysis of the FT-IR spectra showed that the DASP con
centration modified the sample properties and that both the Na+ and
Ca2+ interacted with the carboxylic groups of the GalA units.
The FTIR spectra for the three DASP concentrations (4.6 ⋅ 10− 2%, 4.6
⋅ 10− 1% and 1.8 ⋅ 100%) representing the low-concentration dispersions
and the systems where self-assembly and gelation occurred, respectively
(Fig. S5a–c), were analysed in order to highlight the differences between
the samples. At a given concentration the most striking differences were
visible for the 1800–1500 cm− 1 region. In the case of low-concentration
samples, the bands: 1729, 1625 and 1465 cm− 1 were probably the result
of Ca2+ and Na+ ions binding to the carbomethoxy groups (Fig. S4a)
(Guo, Duan, Wang, & Huang, 2014). While at 4.6 ⋅ 10− 1% (Fig. S4b), the
spectra of DASP in water and in the NaCl solution revealed a lower in
tensity band at 1741 cm− 1 than that at 1593 cm− 1 in contrast to the
spectrum of DASP in the CaCl2 solution where the band at 1593 cm− 1
was barely visible. In the case of 1.84 ⋅ 100% DASP (Fig. S4c), the most
noticeable detail was the lack of a 1741 cm− 1 band for the dispersion in
the CaCl2 solution (the weak band was present for the dispersions in H2O
and the NaCl solution).
It can be generalized that the carboxyl groups are strongly involved
in the interactions between the macromolecules at the increasing DASP
concentration. In water, this is connected with their dissociation degree,
whereas in the salt solutions — it is influenced by the interactions with
the cations. However, while Na+ can bind with one carboxylate group,
Ca2+ can form intermolecular or intramolecular bonds. This corresponds
´ ska, Pieczywek,
well to the previously published data (Cie´sla, Koczan
Cybulska, & Zdunek, 2021).
3.3. Structural properties of DASP dispersed in liquids
3.3.1. Characterization of the DASP suspension using indices based on light
scattering
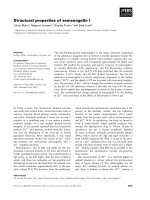
The mean relaxation time obtained from the DLS method was
affected (p < 0.05) by the DASP content in all of the systems studied
(Fig. 3a). Across the full range of DASP concentrations examined, its
values were the highest in the CaCl2 solution, pointing out to the pres
ence of particles larger than those in the water and Na+ solution. For
DASP in the salt solutions, the particle size did not change as the con
centration ranged from 1.8 ⋅ 10− 4 to 4.6 ⋅ 10− 2%. A further increase in
the concentration resulted in a significant extension in the relaxation
time. For the DASP in water, the most significant increase in the relax
ation time started from the concentration of 1.8 ⋅ 10− 2%. At the DASP
concentration range of 4.6 ⋅ 10− 2–4.6 ⋅ 10− 1%, the relaxation time in the
NaCl solution was shorter than that in water but this difference dis
appeared with the further increase in concentration. The smaller value
of the hydrodynamic diameter (i.e. a shorter relaxation time) in the NaCl
solution as compared to water was also determined for the citrus pectin
by Lima, Soldi, and Borsali (2009) (100 mM NaCl) and Schmidt, Schütz,
and Schuchmann (2017) (85 mM NaCl), suggesting the dense packing of
macromolecules in the presence of this salt. An extension of the relax
ation time accompanies gelation because the particle motion is hindered
by intermolecular interactions and the network formation (Horne,
Hemar, & Davidson, 2003).
The aggregation index (AI) (Gawkowska, Cie´sla, Zdunek, &
5
J. Cie´sla et al.
Carbohydrate Polymers 273 (2021) 118598
Fig. 2. Results of the PCA analysis of the FT-IR spectra obtained for dispersions of diluted alkali-soluble pectin (DASP) of pear fruit (Pyrus communis L., cv. Con
ference). Score plots of dispersions in a) H2O, b) NaCl solution, c) CaCl2 solution, and d) all samples, presented together with the loadings plots (e–h), respectively.
6
J. Cie´sla et al.
Carbohydrate Polymers 273 (2021) 118598
content ranging from 1.8 ⋅ 10− 4 to 4.6 ⋅ 10− 2% the AI value was constant.
A further increase in the DASP concentration decreased the AI until a
value close to − 1 was obtained at the highest concentrations.
In the case of DASP in water, at the concentration ≤ 4.6 ⋅ 10− 2% the
mean values of AI were in the range of 0.3–0.7 (excluding the value of
1.3 at 1.8 ⋅ 10− 2%). These values were lower than those previously
determined for the apple pectin (AI of 1.9–3.3, concentration ≤ 1.0 ⋅
10− 2% (Gawkowska, Cie´sla, Zdunek, & Cybulska, 2019b). This indicates
that the structure formed in the solution by the pear DASP was looser
than that of the apple DASP. AI equal to 0, indicating the existence of the
homogeneous three-dimensional system, was obtained at the concen
tration of 3.0 ⋅ 10− 1%, which was slightly lower than the value of 3.3 ⋅
10− 1% as determined by Gawkowska, Cie´sla, Zdunek, and Cybulska
(2019b) for the apple.
For the pear DASP dispersed in the salts solutions (the ionic strength
of 30 mM), the ranges of AI values in the presence of Ca2+ and Na+ were
different. In the case of the NaCl solution, at the DASP concentration ≤
4.6 ⋅ 10− 2% the mean values of AI ranged from 1.3 to 1.8, suggesting that
the particles were more compact and more distant from each other than
those dispersed in the water. AI equal to 0 was obtained at the con
centration of 6.6 ⋅ 10− 1%. In contrast to the DASP dispersions in water
and the NaCl solution, the values of AI in the CaCl2 solution were
negative over the full range of the concentrations used. This was prob
ably the result of the presence of nanoparticles or flocks (Basak &
Bandyopadhyay, 2014) causing samples turbidity even at the lowest
DASP content. It was shown by Jonassen, Treves, Kjøniksen, Smistad,
and Hiorth (2013) that the addition of NaCl (50 mM) to the pure
aqueous pectin solution did not modify the transmittance whereas the
divalent cation caused its reduction. At the DASP concentration ≤ 4.6 ⋅
10− 2% the AI values oscillated around − 0.5, next they decreased and a
value of close to − 1 was obtained at about 2.5 ⋅ 10− 1%, corresponding to
1.8 Ca2+/COO− mole ratio (Fig. 3b). The total lack of the sample
transparency to light (i.e. AI = − 1) corresponds to the presence of the
pectin network (Gawkowska, Cie´sla, Zdunek, & Cybulska, 2019b). The
calculated DASP concentration referring to such a structure in water and
in NaCl solution was about 5.0 ⋅ 100% and 3.5 ⋅ 100%, respectively. In
the case of the apple pectin dispersed in water, it was approximately 3.3
⋅ 100% but the other equation was used to perform the calculation
(Gawkowska, Cie´sla, Zdunek, & Cybulska, 2019b).
The shape factor (SF) was also applied to evaluate the effect of DASP
concentration on the structure formed in the dispersions (Fig. 3c). The
parameters of the equations describing the dependence of SF on the
DASP content are summarized in Table S4. For the diluted systems
(DASP concentration ≤ 4.6 ⋅ 10− 2% for H2O and the NaCl solution and
the concentration ≤ 1.8 ⋅ 10− 2% for the CaCl2 solution) no significant
effect of the DASP concentration on SF was observed. The particles
present in the NaCl solution (SF ~ 0.40) were slightly more elongated
compared to those in the H2O and CaCl2 solution (SF ~ 0.55). A further
increase in the DASP concentration led to an increase in the SF value.
The value of 1 reflecting a regular shape/structure was determined at
the DASP concentration of 2.0 ⋅ 10− 1, 6.0 ⋅ 10− 1 and 4.9 ⋅ 10− 2% in H2O,
NaCl and CaCl2 solutions, respectively. An increase in the DASP content
resulted in a decrease in the SF value which tended to 0 with decreasing
both the distance between the particles and the transparency of the
samples. The dispersed particles become indistinguishable in a network
(SF ~ 0). It was assumed that the values of SF < 0.01 pointed out to the
network structure obtaining (i.e. the gel point). They were determined
for the DASP concentration ≥ 5.0 ⋅ 100%, 4.0 ⋅ 100% and 5.5 ⋅ 10− 1%
(Ca2+/COO− mole ratio of 0.98) in H2O, NaCl and CaCl2 solutions,
respectively.
The application of both AI and SF indices allowed for the determi
nation of the ranges of concentration of DASP from the pear fruit cor
responding to negligible interactions between the dispersed particles
(≤4.6 ⋅ 10− 2%), obtaining the homogeneous a three-dimensional
structure in the liquid (2.0 ⋅ 10− 1–3.0 ⋅ 10− 1%, 6.0 ⋅ 10− 1–6.6 ⋅ 10− 1%
and 4.9 ⋅ 10− 1% for dispersion in water, NaCl and CaCl2 solutions,
Fig. 3. Relationship between a) the relaxation time (expressed as log(τr)), b)
the aggregation index (AI), c) the shape factor (SF) and the concentration of
diluted alkali-soluble pectin (DASP) from pear fruit (Pyrus communis L., cv.
Conference) in different media; bars indicate the standard deviation; different
letters mean significantly different results (two-way ANOVA and post-hoc HSD
Tukey test, p < 0.05).
Cybulska, 2019b) was applied to monitor the structural changes in the
DASP dispersions. The relationship between AI and the DASP concen
tration had a similar shape for all of the systems studied (Fig. 3b) and
was described using non-linear regression (Table S3). At the DASP
7
J. Cie´sla et al.
Carbohydrate Polymers 273 (2021) 118598
respectively) and a gel point (5.0 ⋅ 100%, 3.5 ⋅ 100–4.0 ⋅ 100% and 2.5 ⋅
10− 1–5.5 ⋅ 10− 1% for dispersion in water, NaCl and CaCl2 solutions,
respectively) (Fig. S7). This was possible due to a wide range of the
DASP concentrations studied. The use of these indices in combination
´
with the previously determined physicochemical ones (Cie´sla, Koczan
ska, Pieczywek, Cybulska, & Zdunek, 2021) gives a possibility of multidirectional characterization of the behaviour of polysaccharides
dispersed in the liquids and the optimization of the gelation conditions.
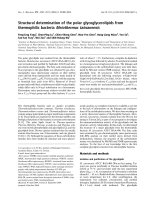
persistence length of DASP in water (129 ± 92 nm) was over twice as
low as in the NaCl solution (363 ± 185 nm). Starting from the DASP
concentration of 1.8 ⋅ 10− 2%, branched structures were formed in the
NaCl solution and the network was visible in the water. In the NaCl
solution, a regular network was observed at the concentration of 1.8 ⋅
10− 1%. In general, the DASP macromolecules in the water were slightly
lower and shorter than those in the NaCl solution (Fig. 4b and c).
Up to the DASP concentration of 4.6 ⋅ 10− 2% in water the height of
the molecules on mica (0.63 ± 0.32 nm–1.14 ± 0.30 nm) was not
significantly affected by the DASP concentration. The values obtained
corresponded to the results (0.3–1.0 nm) previously reported by Zdunek,
Kozioł, Pieczywek, and Cybulska (2014). A further increase in the con
centration caused an increase in the height value (4.63 ± 1.63 nm at 4.6
⋅ 10− 1%). Considering that the distance between the O1 and O4 oxygen
atoms in GalA is 0.500–0.597 nm (Cybulska, Brzyska, Zdunek, &
´ ski, 2014), the single molecules and bimolecular forms of DASP
Wolin
were present in the diluted aqueous dispersion. For the DASP concen
tration of 4.6 ⋅ 10− 1%, the height of DASP on mica corresponded to the
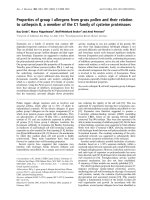
3.3.2. The AFM images of DASP
Analyses of the AFM images of air-dried DASP samples were per
formed (Figs. 4, 5 and S6, Table S5) to verify the results of the light
scattering measurements. The range of DASP content presented in Fig. 4
was limited to 1.8 ⋅ 10− 1% due to non-feasibility for the more concen
trated dispersions in the CaCl2 solution (a gel). The images of 4.6 ⋅
10− 1% DASP in the water and NaCl solution are shown in Fig. S6.
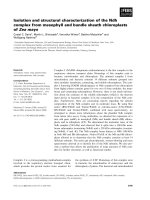
For the DASP concentrations of up to 4.6 ⋅ 10− 3% in H2O and NaCl
solution the unbranched separated chains were visible. The mean
Fig. 4. a) The AFM images of diluted alkali-soluble pectin (DASP) from pear fruit (Pyrus communis L., cv. Conference), b) height and c) length of macromolecules on
mica; bars indicate the standard deviation; different letters indicate significantly different results (two-way ANOVA and post-hoc HSD Tukey test, p < 0.05).
8
J. Cie´sla et al.
Carbohydrate Polymers 273 (2021) 118598
separation between the molecules, when compared to the aqueous
dispersion.
In the case of the increasing content of DASP in water, a regular
network was formed on mica due to the decreasing distance between
single molecules and bimolecular forms as well as the overlapping of
chains. A similar effect of concentration was observed for the DASP from
apple (Gawkowska, Cie´sla, Zdunek, & Cybulska, 2019b), LM pectin
(Zareie, Gokmen, & Javadipour, 2003) and alginate (Wang, Wan, Wang,
Li, & Zhu, 2018). In the case of DASP in the NaCl solution, the presence
of electrolyte facilitated the interactions between the macromolecules
leading to the formation of elongated tri- or tetra-molecular structures
even in the low-concentration systems. An increase in the DASP content
resulted in the formation of branched structures, the further overlapping
of which led to a network formation.
The greater persistence length and larger dimensions of molecules in
the NaCl solution than in water corresponded well to the AI values
(Fig. 3b) which were also higher in the presence of this salt. Up to the
DASP concentration of 4.6 ⋅ 10− 2%, the SF value (Fig. 3c) in the NaCl
solution was lower than in the water, thereby indicating that the par
ticles in the salt solution were elongated. Only the values of the relax
ation time, indicating that at the concentration ≥ 4.6 ⋅ 10− 3% the
particles in the water were larger than those in the NaCl solution, may be
inconsistent. However, the slightly longer relaxation time was probably
due to less freedom of movement for the high number of di-molecular
forms in the water as compared to the lower number of tri- or tetramolecular structures located far from each other in the NaCl solution
(Horne, Hemar, & Davidson, 2003; Lima, Soldi, & Borsali, 2009;
Schmidt, Schütz, & Schuchmann, 2017).
The AFM images of DASP in the CaCl2 solution revealed the presence
of small particles, the height of which on mica increased from 1.18 ±
0.29 nm (i.e. representing the diameter of 2 macromolecules) to 4.91 ±
3.49 nm (i.e. 9–14 macromolecules) at the DASP concentration which
ranged from 1.8 ⋅ 10− 4% to 1.8 ⋅ 10− 3%. At the concentration of 4.6 ⋅
10− 3% the value reached 0.95 ± 0.26 nm (i.e. 2 macromolecules) and
further to 2.00 nm (i.e. about 4 macromolecules) at still higher con
centrations (1.8 ⋅ 10− 2%–1.8 ⋅ 10− 1%). In the presence of Ca2+ both
intramolecular and intermolecular bridges formation led to the attain
ment of different-sized flocks (visible as particles after drying). The in
teractions between flocks at the DASP concentration higher than 1.8 ⋅
10− 1% resulted in gel formation (Basak & Bandyopadhyay, 2014).
While, at a low content of pectin and a high concentration of divalent
cations, precipitation (Han et al., 2017) and the nanoparticles formation
due to the cation chelation inside the coils of macromolecules (Jonassen,
Treves, Kjøniksen, Smistad, & Hiorth, 2013; Wei et al., 2009) may occur.
Shrinking of the coiled macromolecules of polysaccharide after the
addition of Ca2+ was determined by Sagou, Rotureau, Thomas, and
Duval (2013). Moreover, the stirring applied during the samples prep
aration could result in the formation of soft gel particles dispersed in the
liquid phase (Einhorn-Stoll, 2018).
For the DASP concentrations ≥9.2 ⋅ 10− 1% the networks formed in
the NaCl solution and water were indistinguishable (Fig. 5a). Therefore,
the roughness of the samples surface was analysed (Fig. 5b; Table S5).
At the DASP concentration of 9.2 ⋅ 10− 1% the roughness of DASP
dispersed in the water and NaCl solution was similar but for the higher
content of DASP the values obtained in the water were lower than those
obtained in the salt solution. Moreover, in the presence of Na+ an in
crease in the DASP concentration led to the roughness increase. A sig
nificant increase in roughness was observed by Gawkowska, Cie´sla,
Zdunek, and Cybulska (2019b), Zareie, Gokmen, and Javadipour (2003)
and Wang, Wan, Wang, Li, and Zhu (2018) when a gel structure was
formed.
The obtained results show the potential of DASP extracted from the
fruit of Pyrus communis L. cv. Conference to gelation in the water and salt
solutions. This provides the opportunity for further studies concerning
the possible application of DASP in food, cosmetics or in the pharma
ceutical branches of industry.
Fig. 5. a) The AFM images of diluted alkali-soluble pectin (DASP) from pear
fruit (Pyrus communis L., cv. Conference) at the concentration range of 9.2 ⋅
10− 1%–1.8 ⋅ 10− 1%; b) The surface roughness (Ra) defined as the arithmetical
mean deviation of the assessed profile of DASP films deposited on mica; bars
indicate the standard deviation; different letters indicate significantly different
results (two-way ANOVA and post-hoc HSD Tukey test, p < 0.05).
diameter of 8–10 macromolecules. In the case of DASP in the NaCl so
lution, the mean height of the molecules increased slightly from 1.69 ±
0.75 nm (i.e. 3–4 macromolecules) to 4.02 ± 1.94 nm (i.e. 7–10 mac
romolecules) with the DASP concentration increasing from 1.8 ⋅ 10− 4%
to 1.8 ⋅ 10− 1%, with the next increase in the concentration to 4.6 ⋅ 10− 1%
resulting in an increase in the height to 11.32 ± 4.14 nm (i.e. 20–26
macromolecules). The molecule length in water (~20 nm) was not
significantly affected by the DASP concentration. For dispersions in the
NaCl solution an increase in the mean value from 21 to 63 nm with the
DASP concentration increasing from 1.8 ⋅ 10− 4% to 4.6 ⋅ 10− 3% was
observed but a further increase in the DASP content to 4.6 ⋅ 10− 1% led to
a decrease in the length to 19 nm (Fig. 4c).
When comparing the structural changes of DASP dispersed in the
water and the NaCl solution, it can be generalized that at the concen
trations lower than 1.8 ⋅ 10− 2% the presence of NaCl led to an increase in
the length and height (thickness) of the DASP molecules. A further in
crease in the DASP concentration formed a lower density network in
NaCl solution as indicated by the greater lengths of the molecules
measured between the branching points and the higher spatial
9
Carbohydrate Polymers 273 (2021) 118598
J. Cie´sla et al.
4. Conclusions
Cybulska, J., Zdunek, A., & Kozioł, A. (2015). The self-assembled network and
physiological degradation of pectins in carrot cell walls. Food Hydrocolloids, 43,
41–50.
Dahman, Y., Caruso, G., Eleosida, A., & Hasnain, S. T. (2017). Self-assembling
nanostructures. In Y. Dahman (Ed.), Nanotechnology and functional materials for
engineers (pp. 207–227). Elsevier.
Einhorn-Stoll, U. (2018). Pectin-water interactions in foods: From powder to gel. Food
Hydrocolloids, 78, 109–119.
Fang, Y., Al-Assaf, S., Phillips, G. O., Nishinari, K., Funami, T., & Williams, P. A. (2008).
Binding behavior of calcium to polyuronates: Comparison of pectin with alginate.
Carbohydrate Polymers, 72, 334–341.
Ferreira, D., Barros, A., Coimbra, M. A., & Delgadillo, I. (2001). Use of FT-IR
spectroscopy to follow the effect of processing in cell wall polysaccharide extracts of
a sun-dried pear. Carbohydrate Polymers, 45, 175–182.
Filippov, M. P. (1972). IR spectra of pectin films. Journal of Applied Spectroscopy, 2,
1052–1054.
Fishman, M. L., Chau, H. K., Kolpak, F., & Brady, J. (2001). Solvent effects on the
molecular properties of pectins. Journal of Agricultural and Food Chemistry, 49,
4494–4501.
Food and Agriculture Organization of the United Nations. (2019). .
org/faostat/en/#data/QC.
Fraeye, I., Colle, I., Vandevenne, E., Duvetter, T., Van Buggenhout, S., Moldenaers, P.,
Van Loey, A., & Hendrickx, M. (2010). Influence of pectin structure on texture of
pectin-calcium gels. Innovative Food Science and Emerging Technologies, 11, 401–409.
Gawkowska, D., Cie´sla, J., Zdunek, A., & Cybulska, J. (2019a). Cross-linking of diluted
alkali-soluble pectin from apple (Malus domestica fruit) in different acid-base
conditions. Food Hydrocolloids, 92, 285–292.
Gawkowska, D., Cie´sla, J., Zdunek, A., & Cybulska, J. (2019b). The effect of
concentration on the cross-linking and gelling of sodium carbonate-soluble apple
pectins. Molecules, 24(8), 1635.
Gawkowska, D., Cybulska, J., & Zdunek, A. (2018). Cross-linking of sodium carbonatesoluble pectins from apple by zinc ions. Carbohydrate Polymers, 196, 1–7.
Gilsenan, P. M., Richardson, R. K., & Morris, E. R. (2000). Thermally reversible acid
induced gelation of low-methoxy pectin. Carbohydrate Polymers, 41, 339–349.
Guo, X., Duan, H., Wang, C., & Huang, X. (2014). Characteristics of two calcium
pectinates prepared from citrus pectin using either calcium chloride or calcium
hydroxide. Journal of Agricultural and Food Chemistry, 62, 6354–6361.
Han, W., Meng, Y., Hu, C., Dong, G., Qu, Y., Deng, H., & Guo, Y. (2017). Mathematical
model of Ca2+ concentration, pH, pectin concentration and soluble solids (sucrose)
on the gelation of low methoxyl pectin. Food Hydrocolloids, 66, 37–48.
Horne, D. S., Hemar, Y., & Davidson, C. M. (2003). Diffusing wave spectroscopy studies
of gel formation. In E. Dickinson, & T. van Vliet (Eds.), Food colloids, biopolymers and
materials (pp. 17–25). Cambridge: The Royal Society of Chemistry.
International Standard BS EN ISO 4287. (2000). Geometrical product specification (GPS).
Surface texture. Profile method. Terms, definitions and surface texture parameters.
International Standard ISO 22412. (2017). Particle size analysis-dynamic light scattering.
DLS.
Itai, A. (2007). Pear. In C. Kole (Ed.), Fruits and nuts (pp. 157–170). Berlin, Heidelberg,
New York: Springer.
Jonassen, H., Treves, A., Kjøniksen, A.-L., Smistad, G., & Hiorth, M. (2013). Preparation
of ionically cross-linked pectin nanoparticles in the presence of chlorides of divalent
and monovalent cations. Biomacromolecules, 14, 3523–3531.
Karaki, N., Aljawish, A., Muniglia, L., Humeau, C., & Jasniewski, J. (2016).
Physicochemical characterization of pectin grafted with exogenous phenols. Food
Hydrocolloids, 60, 486–493.
Li, L., Liao, B.-Y., Thakur, K., Zhang, J.-G., & Wei, Z.-J. (2018). The rheological behaviour
of polysaccharide sequential extracted from Polygonatum cyrtonema Hua.
International Journal of Biological Macromolecules, 109, 761–771.
Lima, A. M. F., Soldi, V., & Borsali, R. (2009). Dynamic light scattering and viscosimetry
of aqueous solutions of pectin, sodium alginate and their mixtures: Effects of added
salt, concentration, counterions, temperature and chelating agent. Journal of the
Brazilian Chemical Society, 20, 1705–1714.
Martín-Cabrejas, M., Waldron, K. W., & Selvendran, R. R. (1994). Cell wall changes in
Spanish pear during ripening. Journal of Plant Physiology, 144, 541–548.
McNaught, A. D., & Wilkinson, A. (Eds.). (1997). IUPAC. Compendium of Chemical
Terminology. (The "Gold Book".) (2nd ed.). Oxford: Blackwell Scientific Publications,
ISBN 0-9678550-9-8. Online version (2019-)
created by S. J. Chalk.
Moslemi, M. (2021). Reviewing the recent advances in application of pectin for technical
and health promotion purposes: From laboratory to market. Carbohydrate Polymers,
254, Article 117324.
Paniagua, C., Pos´e, S., Morris, V. J. M., Kirby, A. R., Quesada, M. A., & Mercado, J. A.
(2014). Fruit softening and pectin disassembly: An overview of nanostructural pectin
modifications assessed by atomic force microscopy. Annals of Botany, 114,
1375–1383.
Paniagua, C., Santiago-Dom´enech, N., Kirby, A. R., Gunning, A. P., Morris, V. J.,
Quesada, M. A., & Mercado, J. A. (2017). Structural changes in cell wall pectins
during strawberry fruit development. Plant Physiology and Biochemistry, 118, 55–63.
Pieczywek, P. M., Cybulska, J., & Zdunek, A. (2020). An atomic force microscopy study
on the effect of β-galactosidase, α-L-rhamnosidase and α-L-arabinofuranosidase on the
structure of pectin extracted from apple fruit using sodium carbonate. International
Journal of Molecular Sciences, 21, 4064.
Pos´
e, S., Kirby, A. R., Mercado, J. A., Morris, V. J., & Quesada, M. A. (2012). Structural
characterization of cell wall pectin fractions in ripe strawberry fruits using AFM.
Carbohydrate Polymers, 88, 882–890.
LM DASP from the pear fruit (Pyrus communis L., cv. Conference)
showed gelling ability in aqueous medium and in solutions of mono- and
divalent cations without pH adjustment at room temperature indicating
its utility in the food, cosmetic or pharmaceutical industries. Both AI and
SF indices based on the light scattering can be useful for characterizing
the structural changes of the DASP dispersions. This was confirmed by
the results of the relaxation time and rheological tests as well as by the
analyses of the FT-IR spectra and AFM images. The indices can be
applied for the determination of the gel point. This may be useful for the
optimization of gelation conditions.
CRediT authorship contribution statement
Jolanta Cie´sla: Conceptualization, Methodology, Investigation,
Formal analysis, Data curation, Visualization, Writing – original draft,
´ ska: Investigation,
Writing – review & editing. Magdalena Koczan
Validation, Writing – original draft, Writing – review & editing. Piotr
Pieczywek: Investigation, Validation, Data curation, Visualization,
Writing – original draft, Writing – review & editing. Monika Szy
´ ska-Chargot: Investigation, Validation, Data curation, Visualiza
man
tion, Writing – original draft, Writing – review & editing. Justyna
Cybulska: Investigation, Resources, Writing – review & editing. Artur
Zdunek: Supervision, Funding acquisition, Writing – review & editing.
Declaration of competing interest
The authors declare that they have no known competing financial
interests or personal relationships that could have appeared to influence
the work reported in this paper.
Acknowledgements
This study was supported by the National Science Centre, Poland
(Project No. DEC-2015/17/B/NZ9/03589).
Appendix A. Supplementary data
Supplementary data to this article can be found online at https://doi.
org/10.1016/j.carbpol.2021.118598.
References
Assifaoui, A., Lerbret, A., Uyen, H. T. D., Neiers, F., Chambin, O., Loupiac, C., &
Cousin, F. (2015). Structural behaviour differences in low methoxy pectin solutions
in the presence of divalent cations (Ca2+ and Zn2+): A process driven by the binding
mechanism of the cation with the galacturonate unit. Soft Matter, 11, 551–560.
Basak, R., & Bandyopadhyay, R. (2014). Formation and rupture of Ca2+ induced pectin
biopolymer gels. Soft Matter, 10, 7225–7233.
Bourne, M. C. (2002). Food texture and viscosity: Concept and measurement (2nd ed.). New
York: Academic Press.
Brahem, M., Renard, C. M. G. C., Gouble, B., Bureau, S., & Le Bourvellec, C. (2017).
Characterization of tissue specific differences in cell wall polysaccharides of ripe and
overripe pear fruit. Carbohydrate Polymers, 156, 152–164.
Brummell, D. A. (2006). Cell wall disassembly in ripening fruit. Functional Plant Biology,
33, 103–119.
Capel, F., Nicolai, T., Duranda, D., Boulenguer, P., & Langendorff, V. (2006). Calcium
and acid induced gelation of (amidated) low methoxyl pectin. Food Hydrocolloids, 20,
901–907.
Chyli´
nska, M., Szyma´
nska-Chargot, M., & Zdunek, A. (2016). FT-IR and FT-Raman
characterization of non-cellulosic polysaccharides fractions isolated from plant cell
wall. Carbohydrate Polymers, 154, 48–54.
Cie´sla, J., Kocza´
nska, M., Pieczywek, P., Cybulska, J., & Zdunek, A. (2021). The
concentration-modified physicochemical surface properties of sodium carbonatesoluble pectin from pears (Pyrus communis L.). Food Hydrocolloids, 113, Article
106524.
Cybulska, J., Brzyska, A., Zdunek, A., & Woli´
nski, K. (2014). Simulation of force
spectroscopy experiments on galacturonic acid oligomers. PLoS One, 9, Article
e107896.
10
J. Cie´sla et al.
Carbohydrate Polymers 273 (2021) 118598
Raffo, M. D., Ponce, N. M. A., Sozzi., G. O., Vincente, A. R., & Stortz, C. A. (2011).
Compositional changes in ‘Bartlett’ pear (Pyrus communis L.) cell wall
polysaccharides as affected by sunlight conditions. Journal of Agricultural and Food
Chemistry, 59, 12155–12162.
Rivetti, C., Guthold, M., & Bustamante, C. (1996). Scanning force microscopy of DNA
deposited onto mica: Equilibration versus kinetic trapping studied by statistical
polymer chain analysis. Journal of Molecular Biology, 264, 919–932.
Sagou, J.-P. S., Rotureau, E., Thomas, F., & Duval, J. F. L. (2013). Impact of metallic ions
on electrohydrodynamics of soft colloidal polysaccharides. Colloids and Surfaces A:
Physicochemical and Engineering Aspects, 435, 16–21.
Schiewer, S., & Balaria, A. (2009). Biosorption of Pb2+ by original and protonated citrus
peels: Equilibrium, kinetics, and mechanism. Chemical Engineering Journal, 146,
211–219.
Schmidt, U. S., Schütz, L., & Schuchmann, H. P. (2017). Interfacial and emulsifying
properties of citrus pectin: Interaction of pH, ionic strength and degree of
esterification. Food Hydrocolloids, 62, 288–298.
Schols, H. A., & Voragen, A. G. J. (1994). Occurrence of pectic hairy regions in various
plant cell wall materials and their degradability by rhamnogalacturonase.
Carbohydrate Research, 256, 83–95.
Schols, H. A., Voragen, A. G. J., & Colquhoun, I. J. (1994). Isolation and characterization
of rhamnogalacturonan oligomers, liberated during degradation of pectic hairy
regions by rhamnogalacturonase. Carbohydrate Research, 256, 97111.
Stră
om, A., Schuster, E., & Goh, S. M. (2014). Rheological characterization of acid pectin
samples in the absence and presence of monovalent ions. Carbohydrate Polymers,
113, 336–343.
ˇ kov´
Synytsya, A., Copı́
a, J., Matˇejka, P., & Machoviˇc, V. (2003). Fourier transform Raman
and infrared spectroscopy of pectins. Carbohydrate Polymers, 54, 97–106.
Szyma´
nska-Chargot, M., Chyli´
nska, M., Kruk, B., & Zdunek, A. (2015). Combining FT-IR
spectroscopy and multivariate analysis for qualitative and quantitative analysis of
the cell wall composition changes during apples development. Carbohydrate
Polymers, 115, 93–103.
Szyma´
nska-Chargot, M., & Zdunek, A. (2013). Use of FT-IR spectra and PCA to the bulk
characterization of cell wall residues of fruits and vegetables along a fraction
process. Food Biophysics, 8, 29–42.
Ventura, I., Jammal, J., & Bianco-Peled, H. (2013). Insights into the nanostructure of
low-methoxyl pectin-calcium gels. Carbohydrate Polymers, 97, 650–658.
Wang, H., Wan, L., Chen, D., Guo, X., Liu, F., & Pan, S. (2019). Unexpected gelation
behavior of citrus pectin induced by monovalent cations under alkaline conditions.
Carbohydrate Polymers, 212, 51–58.
Wang, H., Wan, Y., Wang, W., Li, W., & Zhu, J. (2018). Effect of calcium ions on the III
steps of self-assembly of SA investigated with atomic force microscopy. International
Journal of Food Properties, 21, 1995–2006.
Wehr, J. B., Menzies, N. W., & Blamey, F. P. C. (2004). Alkali hydroxide-induced gelation
of pectin. Food Hydrocolloids, 18, 375–378.
Wei, X., Chen, Z., Lu, Y., Xu, H., Chen, G., & Wu, W. (2009). Physicochemical
characterization of a pectin/calcium matrix containing a large fraction of calcium
chloride: Implications for sigmoidal release characteristics. Journal of Applied
Polymer Science, 113, 2418–2428.
Yoo, S.-H., Fishman, M. L., Savary, B. J., & Hotchkiss, A. T., Jr. (2003). Monovalent saltinduced gelation of enzymatically deesterified pectin. Journal of Agricultural and
Food Chemistry, 51, 7410–7417.
Yuliarti, O., & Mardyiah Binte Othman, R. (2018). Temperature dependence of acid and
calcium-induced low-methoxyl pectin gel extracted from Cyclea barbata Miers. Food
Hydrocolloids, 81, 300–311.
Zareie, M. H., Gokmen, V., & Javadipour, I. (2003). Investigating network, branching,
gelation and enzymatic degradation in pectin by atomic force microscopy. Journal of
Food Science and Technology, 40, 169–172.
Zdunek, A., Kozioł, A., Cybulska, J., Lekka, M., & Pieczywek, P. M. (2016). The stiffening
of the cell walls observed during physiological softening of pears. Planta, 243,
519–529.
Zdunek, A., Kozioł, A., Pieczywek, P. M., & Cybulska, J. (2014). Evaluation of the
nanostructure of pectin, hemicellulose and cellulose in the cell walls of pears of
different texture and firmness. Food and Bioprocess Technology, 7, 3525–3535.
Zetasizer Nano Application Note. (2010). Enhanced protein aggregation detection using dual
angle dynamic light scattering, MRK1441-01. Malvern, UK: Malvern Instruments Ltd.
Zhao, S., Yang, F., Liu, Y., Sun, D. S., Xiu, Z. L., Ma, X. J., Zhang, Y., & Sun, G. (2018).
Study of chemical characteristics, gelation properties and biological application of
calcium pectate prepared using apple or citrus pectin. International Journal of
Biological Macromolecules, 109, 180–187.
Zhu, D.-Y., Ma, Y.-L., Thakur, K., Wang, C.-H., Wang, H., Ren, Y.-F., Zhang, J.-G., &
Wei, Z.-J. (2018). Effects of extraction methods on the rheological properties of
polysaccharides from onion (Allium cepa L.). International Journal of Biological
Macromolecules, 112, 22–32.
Zhu, D.-Y., Ma, Y.-L., Wang, C.-H., Wang, H., Ren, Y.-F., Zhang, J.-G., Thakur, K., &
Wei, Z.-J. (2017). Insights into physicochemical and functional properties of
polysaccharides sequentially extracted from onion (Allium cepa L.). International
Journal of Biological Macromolecules, 105, 1192–1201.
11