0817 THẨM ĐỊNH PHƯƠNG PHÁP PHÂN TÍCH và ĐÁNH GIÁ ẢNH HƯỞNG của NHIỆT độ PHA TRÀ đến hàm LƯỢNG POLYPHENOL TỔNG TRONG nước TRÀ của một số sản PHẨM TRÀ VIỆT n
Bạn đang xem bản rút gọn của tài liệu. Xem và tải ngay bản đầy đủ của tài liệu tại đây (314.89 KB, 16 trang )
TẠP CHÍ KHOA HỌCHO CHI MINH CITY UNIVERSITY OF EDUCATION TRƯỜNG ĐẠI HỌC SƯ PHẠM TP HỒ CHÍ MINHJOURNAL OF SCIENCE
Tập 18, Số 6 (2021): 993-1005Vol. 18, No. 6 (2021): 993-1005
ISSN: 2734-9918
Website:
Research Article
VALIDATION OF ANALYTICAL METHOD AND INVESTIGATION INTO
THE EFFECTS OF BREWING TEMPERATURE
ON TOTAL POLYPHENOL CONTENTS IN TEA INFUSIONS PREPARED
FROM VIETNAMESE TEA PRODUCTS
Nguyen Cong Hau, Le Thi Anh Dao, Nguyen Pham Nhu Quynh, Nguyen Thanh Nho*
Faculty of Environmental and Food Engineering, Nguyen Tat Thanh University, Vietnam
*
Corresponding author: Nguyen Thanh Nho – Email:
Received: February 20, 2021; Revised: March 24, 2021; Accepted: June 07, 2021
ABSTRACT
Produced from leaves of Camellia sinensis L. (Kuntz), tea is among the most common beverages
worldwide. Tea plants have been grown in nearly 30 countries. In this study, the Folin- Ciocalteu method was
applied to determine the total polyphenol contents (referred to milligrams gallic acid mass equivalence or
GAE) in tea products (one oolong and three ancient teas, including red, green, and white) based on ISO
14502-1:2005 with some modifications, typically ultrasonic- assisted single extraction using methanol:water
(7:3 v/v) as an extraction solvent at 70 oC with the extraction ratio of 0.200:10.00 (g:mL). The analytical
method was validated using Shimadzu 1800 UV-Vis instrument with favorable linearity of R 2 > 0.995, linear
range of 10-70 mg GAE L –1, acceptable repeatability, reproducibility (% RSDs were 0.79 and 1.2 for intraday and inter-day, respectively), and high recoveries (higher than 98% for spiked samples). The total
polyphenol contents (mean values, mg GAE g–1 dried weight, in brackets) performed a descending order of
white (206.62) ~ green (201.33) > red (167.42) > oolong (139.18) teas due to the variation in the oxidation
levels during the fermentation, particularly for red and oolong teas. Higher polyphenol contents released in
tea infusions were observed regarding the increasing brewing temperature, except for oolong tea with its
specific fluctuation, maybe due to its "wrap-curled" structure, leading to longer brewing durations for
polyphenol to be extracted stably and completely. This study contributes to enriching data for Vietnamese tea
products in the context of high production and export.
Keywords: Camellia sinensis L., Folin-Ciocalteu, total polyphenol
1.
Introduction
Tea trees have a long history of cultivation worldwide, and tea is considered as one of the most
popular beverages after water, coffee, and cocoa. According to Chinese mythology, tea plants were
discovered thousands of years ago in South-East Asia. Human beings have been drinking tea for
more than 5,000 years because of its healthy and medical benefits to
Cite this article as: Nguyen Cong Hau, Le Thi Anh Dao, Nguyen Pham Nhu Quynh, & Nguyen Thanh Nho (2021).
Validation of analytical method and investigation into the effects of brewing temperature on total polyphenol contents in
tea infusions prepared from Vietnamese tea products. Ho Chi Minh City University of Education Journal of Science,
18(6), 993-1005.
1
HCMUE Journal of Science
Vol. 18, No. 6 (2021): 9931005
prevent and treat many diseases, in particular cancer (respiratory, digestive, and urinary)
and cardiovascular disorder (Yan, Zhong, Duan, Chen, & Li, 2020). Tea polyphenols also
help to prevent mutations in genetic materials, regulate detoxification enzyme activities,
and inhibit tumorigenesis. Tea leaves have been used to produce tea infusions, and there
are many types of tea products depending on the degree of oxidation processes, such as
white tea (young tea leaves or new growth buds, withered, uncured, baked dry), green tea
(no oxidized), oolong tea (partially oxidized), black tea or red tea (fully oxidized) (Han,
Mihara, Hashimoto, & Fujino, 2014; Schwalfenberg, Genuis, & Rodushkin, 2013). Thanks
to the development of analytical chemistry, we now know better various metabolites, in
particular catechins, contributing to the antioxidant capacities. The determination of total
polyphenol contents or TPCs by UV-Vis spectrophotometry is considered to be a cheap,
easy, and effective way to assess the antioxidants among various tea products before
proceeding to more modern analytical methods.
Many studies on evaluating the polyphenol contents in various kinds of tea have been
published worldwide during the last ten years. Karori, Wachira, Wanyoko, and Ngure
(2007) determined the total polyphenol contents in tea products (black, green, oolong, and
white teas) and reported those values to range from 11% to over 27% (w/w dried weightDW), with the lowest and highest recorded in green teas collected in Yinghong (China) and
Kenya, respectively. Another study about the determination of the total polyphenol and the
antioxidant capacities of tea products performed by Anesini, Ferraro, and Filip (2008) in
Argentina showing that the total polyphenol contents in green and black teas were 143.2210.2 and 84.2-176.2 mg GAE g–1 DW, respectively. Yao et al. (2006) in Australia reported
the total polyphenol contents of black tea (140-200 mg GAE g–1 DW) and green tea (an
average value of approximately 250 mg GAE g–1 DW), which were higher than several tea
types reported by Anesini et al. (2008). The research of Jayasekera, Molan, Garg, and
Moughan (2011) also used the Folin-Ciocalteu method to determine the total polyphenol
contents in tea products in Sri Lanka, which showed the higher total polyphenol contents in
green teas than black ones (148.5-154.7 vs. 86.5-115.2 mg GAE g –1 DW). The study
conducted by Kerio, Wachira, Wanyoko, and Rotich (2013) reported similar trends in
polyphenol contents for green tea (22.0-22.1% w/w DW) and black tea (18.0-18.9% w/w
DW).
Although Vietnam is considered as a country with large tea production, limited
studies have been published for the identification and evaluation of the polyphenol
contents in tea products. One study by Pham, Tong, Nguyen, and Bach (2007) analyzed the
total polyphenol contents, total catechins, and DPPH in 30 commercial teas (green, black,
and oolong teas) in Ho Chi Minh City. This study showed that the highest polyphenol
contents were found in most green tea products (15.06 ± 0.53 mg GAE kg–1 DW), followed
by oolong and black teas. In general, the polyphenol contents in this study were lower than
in several international publications. Another study conducted by Vuong, Nguyen,
Golding, and Roach (2011) in Thai Nguyen and Lam Dong Provinces showed that green
tea has a remarkably higher total
2
HCMUE Journal of Science
Nguyen Cong Hau et
al.
catechin contents than those in oolong and black teas with the values of 70, 34, and 12 mg
g–1 DW, respectively.
This study employed the Folin-Ciocalteu method as shown in ISO 14502-1:2005
(2005) with some modifications to (i) evaluate the influences of several parameters related
to the polyphenol extraction procedure on the extraction efficiency, (ii) validate the
analytical method for the determination of total polyphenol contents in tea products, and
(iii) apply the validated method to determine the total polyphenol contents in tea products,
then
(iv) assess the effects of brewing temperature on the polyphenol contents in tea infusions.
2.
Materials and methods
2.1. Chemicals and reagents
Gallic acid monohydrate (≥ 99%) was purchased from Sigma-Aldrich and used to
prepare the stock solution of 1000 mg L–1 in methanol. The working standard solutions
from 10 to 70 mg GAE L–1 were prepared daily prior to use. Methanol (CH 3OH, HPLC
grade), sodium carbonate (Na2CO3), and Folin-Ciocalteu reagent of 2 N were obtained
from Merck, Germany. Deionized water (DI, Milli-Q, Merck, Germany) was used
throughout this study.
2.2. Sample collection, pre-treatment, and storage
In this study, we collected four tea samples produced in Vietnam, including three
ancient tea samples (white, green, and red) in Suoi Giang, Yen Bai Province (the North)
and one oolong tea product in Di Linh, Lam Dong Province (the South). The sampling
procedure was based on TCVN 5609:2007 (2007) and QCVN 01-28:2010/BNNPTNT
(2010).
Before being analyzed, tea samples undergone a pre-treatment procedure followed by
ISO 1572:1980 (1980) and TCVN 9738:2013 (2013) for homogenization purposes. Storage
conditions were the temperature of 25 °C, the humidity of 70%, and avoiding direct
sunlight.
2.3. Extraction and coloring procedure of total polyphenol contents
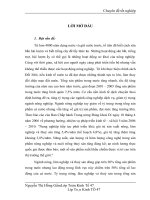
The polyphenol extraction was performed according to ISO 14502-1:2005 (2005)
with some modifications (Figure 1).
(1) Weigh 0.2 (±0.001) g of dry tea
(2) Add 10.00 mL of 70% (v/v) methanol at 70 oC
(3) Vortex for 30 sec and transfer into the ultrasonic bath
(4) Proceed the ultrasonic-assisted extraction at 70 °C within 10 min
(5) Cool down to ambient temperature and centrifuge at 3500 rpm for 10 min
(6) Filter the extract through a 0.45-µm PTFE membrane
(7) Dilute the extract 100 times
3
HCMUE Journal of Science
Nguyen Cong Hau et
al. ISO 14502-1:2005
Figure 1. The polyphenol extraction procedure applying modified
The diluted tea extract was proceeded to the coloring procedure by reacting with the
Folin-Ciocalteu reagent described in ISO 14502-1:2005 (2005) (Figure 2).
4
HCMUE Journal of Science
Vol. 18, No. 6 (2021): 9931005
(1) Pipette 1.00 mL of the diluted extract into a 15-mL PP centrifuge tube
(2) Add 5.00 mL of 10% (v/v) Folin-Ciocalteu reagent
(3) Wait for 3-8 min
(4) Add 4.00 mL 7.5% (w/v) Na2CO3
(5) Wait for another 60 min
(6) Spectrophotometric measurement at 765 nm
Figure 2. The coloring procedure with Folin-Ciocalteu reagent
Several parameters related to the polyphenol extraction efficiency were investigated
and considered to figure out the favorable procedure with available laboratory facilities,
including (i) extraction temperatures (50-90 °C) without ultrasonic power, (ii) extraction
techniques with and without ultrasonic power, and (iii) extraction ratios (material mass per
solvent volume, g:mL) and single or multiple extractions (Table 1).
Table 1. The experiment for evaluating the effects of extraction ratios and multiple extractions
Experiment
1
Extraction ratio (g:mL)
0.200:5.00
Multiple extractions
double extraction (2 times)
2
0.200:10.00
double extraction (2 times)
3
0.200:10.00
single extraction (1 time)
The analytical method for determining total polyphenol contents in tea products was
validated, followed by the requirements as described in Appendix F of AOAC (2016). The
evaluated performance characteristics included the calibration curve, limit of detection and
quantification (LOD and LOQ) estimation, repeatability/intra-day, reproducibility/inter-day
(% RSDr and % RSDR), and recovery. The calibration curves were established by plotting
the milligrams gallic acid mass equivalence (mg GAE) at various concentrations vs. their
UV-Vis absorbance values measured at 765 nm in the format of the linear calibration curve
(y = ax + b). The method accuracy and precision were evaluated from the recovery study
conducted by samples spiked at levels of 75, 150, and 225 mg GAE g–1. The total
polyphenol contents (TPCs) were calculated according to the following equation:
CX × DF
TPCs 100 × m
=
Whereas, Cx: the concentration of total polyphenol calculated from the regression equation
(mg GAE L–1); m: weight of used tea sample (g); and DF: dilution factor.
2.4. Effects of brewing temperature on total polyphenol contents in tea infusions
5
HCMUE Journal of Science
Vol. 18, No. 6 (2021): 993The validated method was then applied to determine 1005
the total polyphenol contents in
the collected tea samples, then assess the influences of brewing temperature at various
values
6
HCMUE Journal of Science
Nguyen Cong Hau et
al.
of 10, 20, 30, 40, 50, 60, 70, 80, 90, and 100oC on total polyphenol contents in tea
infusions when the infusion duration was fixed at 10 minutes for all experimental
conditions. The effects of brewing temperatures on total polyphenols were evaluated by
comparing the percentages of polyphenols releasing into the tea infusions at each brewing
temperature. These percentage values were calculated through the ratios of total
polyphenol contents determined in infusions and tea products.
2.5. Statistical analysis
All the analyses were run in triplicate (n = 3) to assure the repeatability among runs.
The values of average, standard deviation (SD), relative standard deviation (RSD), and
charts were processed by Microsoft Office Excel 2016.
3.
Results and discussion
3.1. The polyphenol extraction procedure of tea products
The extraction procedure for the determination of total polyphenol contents in tea
products was based on ISO 14502-1:2005 (2005) with some modifications. Various
parameters related to the extraction steps were investigated to discover the tea products'
optimized extraction procedure under the available laboratory facilities.
3.1.1. Effect of extraction temperature on total polyphenol contents determined in teas
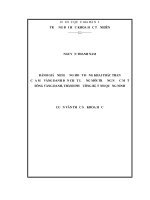
The total polyphenol contents in tea infusions under several extraction temperatures
of 50, 60, 70, 80, and 90°C without ultrasonic power were determined (Figure 3) to figure
out the influences of temperature on the extraction efficiency.
Figure 3. Effects of temperature during the extraction on the total polyphenol contents
As shown in Figure 3, the total polyphenol contents increased regarding the rising
temperature in the extraction period (the lowest and highest of 90.93 mg GAE g –1 at 50oC
and 117.50 mg GAE g–1 at 90oC, respectively). For the temperatures above 70°C, the total
polyphenol contents did not exhibit any remarkable changes (117.06-117.50 mg GAE g –1).
Moreover, % RSDs were higher at lower temperatures than higher ones, particularly 50 and
60°C. This is possible because with the same extraction duration (10 minutes), the
7
HCMUE Journal of Science
Vol. 18, No. 6 (2021): 9931005
polyphenols in the sample matrix were not quantitatively extracted at low temperatures,
leading to smaller total polyphenol contents determined and poorer repeatability.
Therefore, to save energy and as suggested from ISO 14502-1:2005 (2005), we could use
the temperature of 70°C as the extraction temperature for further investigations.
3.1.2. Effects of extraction techniques with and without ultrasonic power on total
polyphenol contents determined in teas
Among various parameters influencing the extraction efficiency, the energy
supporting the extraction is considered an essential and important factor. This study used
ultrasonic- assisted extraction within 10 minutes to compare with the conventional method
(only water bath at 70°C for 30 minutes without ultrasonic power) as described in ISO
14502-1:2005 (2005). This modification was carried out to reach the optimized extraction
efficiency and time saving. The comparison results between the two extraction conditions
are shown in Table 2.
Table 2. The comparison between the water bath and ultrasonic-assisted extractions
No
Extraction conditions
1
Water
bath only
at 70oC
2
Ultrasonic power
at 70oC
Replicate
12
13
2
3
TPCs (mg MAE g–1)
116.20
118.17
117.50
118.12
125.98
127.79
126.66
126.21
RSD (%)
1.0
0.81
TPCs: Total Polyphenol Contents
The analytical results showed that both extraction conditions presented proper
repeatability required by Appendix F. AOAC (2016) (%RSD from 0.81 to 1.0%). In the
ultrasonic-assisted extraction situation, the TPCs determined were higher than those
recorded in the water bath (126.66 vs.117.50 mg GAE g –1) despite the shorter extraction
durations. Therefore, ultrasonic-assisted extraction might be an effective way for
polyphenol extraction from the tea matrix. This procedure could save the analysis time,
particularly in routine analysis. In this study, we applied ultrasonic-assisted extraction for
further investigations and method validation.
3.1.3. Effect of extraction ratios and repeated extractions (extraction times) on total
polyphenol contents in teas
The variation in the extraction ratios has certain influences on the extraction
efficiency in general. In solid-liquid extraction, the ratios between the material and
extraction solvent should be selected appropriately to achieve the maximum analyte
content in the obtained extracts due to the analyte distribution between the two phases.
Additionally, we also reduced the number of extraction cycles from twice (double
extraction as in ISO 14502- 1:2005 (2005)) to once (single extraction) to save the
analytical time and minimize the errors due to many practical steps. The results of
comparing the effects of extraction ratios and single or double extraction on the extracts'
polyphenol contents are presented in Figure 4.
8
HCMUE Journal of Science
Nguyen Cong Hau et
al.
Figure 4. Effect of extraction ratios and repeated extractions on the total polyphenol contents
Figure 4 showed that at the extraction ratio of 0.2:5 (g:mL), the total polyphenol
contents reached the lowest (125.63 mg GAE g–1) even though the extraction was
performed twice. The reason might be that the small extraction solvent volume gave a low
distribution coefficient, leading to the analyte's high contents remaining in the material
phase. Low coefficients of distribution required more extraction cycles (repeated or
multiple extractions) to completely extract the analytes from the sample matrix, resulting
in additional time, effort, and chemical consumption. An extraction ratio of 0.2:10 (g:mL)
presented the highest total polyphenol contents in the situation of single extraction. At the
same extraction ratios, but with double extraction (2 extraction times), the polyphenol
contents were lower (142.11 vs.
–1
151.4 mg GAE g ). Besides, double extraction was not reproducible (%RSD about 1.7%,
compared with single extraction with %RSD of only 1.2%). Thus, for further surveys and
method validation, we chose the extraction solvent volume of 10.00 mL for 0.200 g of raw
material and single extraction to save time and chemicals but still ensure the reliability of
the analytical results.
3.2. Validation of method for the determination of total polyphenol contents in tea
products
The analytical method for the determination of total polyphenol contents in tea
products was validated on Shimadzu 1800 UV-Vis instrument, summarizing in Table 3,
including regression equation (y = ax + b), squared correlation coefficient (R 2), the limit of
detection and quantification (LOD-LOQ), relative standard deviations for intra- and interday, and recoveries for trueness evaluation.
Table 3. Validation parameters for the determination of total polyphenol contents in teas
Regression
equation
R2
y=0.0117x+0.0221
0.9995
LOD LOQ
(mg GAE L–1)
0.81
2.7
2
Intra-day
(%RSDr)
Inter-day
(%RSDR)
Recovery
(%)
0.79
1.2
98.8-99.4
R : squared regression equation correlation coefficient calculated for the linear range of 10-70 mg GAE L–1
9
HCMUE Journal of Science
Vol. 18, No. 6 (2021): 9931005
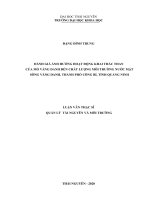
The calibration curve of gallic acid was performed in Figure 5. The LOD and LOQ
were calculated based on the standard deviation of the response (Sy/x) of the curve and the
slope (a) according to the formula of LOD = 3.3 ×
and LOQ = 10 ×
Sy/x
Sy/x
a
.
a
Figure 5. Calibration curve of gallic acid (10-70 mg GAE L–1)
As can be seen from Table 3 and Figure 5, high squared correlation coefficient values
of calibration curve were recorded, 0.995 ≤ R2 ≤ 1, revealing evidence of the goodness of
linearity (Appendix F. AOAC 2016).
Relative standard deviation values for both intra-day (%RSDr) and inter-day
(%RSDR) were acceptable according to Appendix F. AOAC (2016), lower than 5.3 and 8%
for %RSDr and %RSDR, respectively (analyte concentrations below 0.1%). The obtained
recoveries were always higher than 98% for concentrations of 75.0, 150, and 225 mg GAE
L–1, acceptable within the concentration ranges of 90-107% (100 ppm-0.1%). The validated
analytical method could be applied for daily analysis.
3.3. Variation of total polyphenol contents in tea products
The validated analytical method was applied to determine the total polyphenol contents
in three ancient tea products (white, green, and black) and one oolong tea sample (Figure 6).
Figure 6. Variation in total polyphenol contents in collected tea products
10
HCMUE Journal of Science
Nguyen Cong Hau et
al.
The analytical results in Figure 6 indicated that oolong tea had lower total
polyphenol contents than three ancient tea products (139.18 vs. 167.42-206.62 mg GAE g –
1
). Among the three ancient tea samples, red tea exhibited smaller total polyphenol contents
than white and green teas (167.42 vs. 201.33-206.62 mg GAE g–1). The enzymatic
oxidation of polyphenols could explain the lower polyphenol contents determined from
oolong and red teas during the fermentation of these tea types, in which dimer or
polymerization of catechin monomer happened, forming theaflavins and thearubigin, then
reducing the catechin contents in red tea, thereby contributing to the decrease in the total
polyphenol contents (Turkmen, Sarı, & Velioglu, 2009). It could be seen that oolong tea
exhibited smaller polyphenol contents compared to red tea despite the variation in
fermentation levels of red (fully fermented) and oolong teas (partially fermented). This
phenomenon might be due to the differences in tea species used to produce the collected
oolong tea (10-year-old oolong tea trees) and red tea (ancient tea trees grown for hundreds
of years).
Although white tea is mainly made from buds and young tea leaves, compared to
green tea mainly produced from mature tea leaves, the total polyphenol contents of these
two tea types did not differ much (5.29 mg GAE g–1), and the highest content was reported
in white tea (206.62 mg GAE g–1). This is possibly the result of the non-selective properties
of the Folin-Ciocalteu reagent, which not only reacts with polyphenol species but also with
other compounds having similar chemical structure to polyphenols such as ascorbic acid,
some proteins, or amino acids, then increasing the analyzed total polyphenol results.
Consequently, ancient teas could contain high quantities of these compounds, making the
total polyphenol contents determined not to perform much difference between white and
green teas. However, for better understanding and conclusions, it is necessary to conduct
some more chromatographic analysis.
Compared with several international publications on polyphenol contents in tea
products, Zhao et al. (2019) also reported a descending order of total polyphenol contents
in various tea types, particularly green tea (205.16 ± 32.02 mg GAE g–1) > yellow tea
(192.02 ±
25.36 mg GAE g–1) > oolong tea (108.91 ± 25.59 mg GAE g–1) > black tea (75.66 ± 28.70
mg GAE g–1) > white tea (68.38 ± 12.44 mg GAE g–1). This publication exhibited a similar
range of polyphenol in green tea, but nearly three times lower for white tea than our study.
Another study conducted by Anesini et al. (2008) determined the total polyphenol contents
and antioxidant capacity in commercial tea in Argentina, indicating that the total
polyphenol contents in green teas reached the highest value at 210.2 mg GAE g– 1, similar to
the results obtained in this study. The study of Yao et al. (2006) in Australia also showed the
highest total polyphenol content in green tea (250 mg GAE g– 1), but higher than the report
of Anesini et al. (2008) and this study. The differences could be the tea plant species. In
Vietnam, limited publications were found related to the assessment of polyphenols in tea
11
HCMUE Journal of Science
Nguyen Cong Hau et
products despite the high quantity of tea production. There wasal.a study carried out by
Pham et al. (2007) on the
12
HCMUE Journal of Science
Vol. 18, No. 6 (2021): 9931005
analysis of total polyphenol contents in 30 commercial Vietnamese tea products (green,
black, and oolong teas) collected in Ho Chi Minh City. The results of this publication also
showed that green tea had the highest polyphenol content (15.06 ± 0.53 mg GAE kg– 1),
followed by oolong and black teas. These analytical values were remarkably low compared
to our existing tea products, which might be due to the variations in tea quality and species.
3.4. Assessment of the total polyphenol contents in tea infusions prepared from various
brewing temperature
The temperature of brewing water affected the total polyphenol contents released in
the tea infusions; however, there may be tendency differences in the fluctuation of
polyphenol contents in tea infusions among various tea types. In this study, we investigated
the effects of brewing temperature at the different levels of 10, 20, 30, 40, 50, 60, 70, 80,
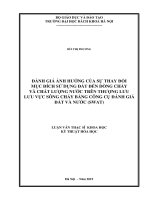
90, and 100oC. The results were shown in Figure 7.
Figure 7. Effects of brewing temperature on the total polyphenol contents in tea infusions
As shown in Figure 7, the brewing temperature had certain effects on the total
polyphenol contents in tea infusions of all tea samples. Particularly, with the same tea
quantity, brewing duration, and water volume, the higher the brewing temperatures were,
the higher the total polyphenol contents in the tea infusions were, reaching the highest
value at 80°C (oolong and green teas) and 100 °C (white and black teas). The oolong tea
sample showed its specific fluctuation, different from the rest three ancient tea products, in
which the polyphenol contents in oolong tea increased gradually from 10 to 50 oC
(releasing percentage of 12.2-16.7%), decreased again at 60-70oC (12.1-13.0%) and peaked
at 80 °C (17.2%) then descended at 100 °C (9.80%). Besides, the releasing percentage of
polyphenols in tea infusions for oolong tea (9.80-17.2% TPC extracted) was mostly lower
than those of the three ancient tea samples (11.9-62.1%, 5.30-44.1%, and 10.4- 34.2% for
green tea, white tea, and black tea, respectively). The reasons might be due to the "wrapcurled" structure of
13
HCMUE Journal of Science
Nguyen Cong Hau et
al.
oolong tea after the processing period, making the polyphenols hardly extracted from the
oolong tea matrix, or it took longer infusion durations for polyphenol species to be released
into the infusions. The same phenomenon was also reported in the study by Tao, Zhou,
Zhao, and Wei (2016), showing that polyphenol contents increased gradually regarding the
rising number of brewing cycles for oolong teas.
4.
Conclusions
This study validated an analytical method to determine the total polyphenol contents
in tea products applying the Folin-Ciocalteu method. The ultrasonic-assisted single
extraction within 10 minutes resulted in higher efficiency than in water bath double
extraction for 30 minutes as shown in ISO 14502-1:2005, which could save time and
energy, then suitable for routine analysis. The analytical method was validated on
Shimadzu 1800 UV-Vis instrument, performing proper linearity (R 2 = 0.9995) from 10 to
70 mg GAE L–1, acceptable repeatability and reproducibility, and high recoveries. This
validated method was employed in four tea products, exhibiting the variations in total
polyphenol contents regarding different processing methods and species with the highest
polyphenol contents recorded in non-fermented teas as green and white tea samples. The
releasing percentage values of polyphenol contents in tea infusions for each brewing
temperature were calculated to assess the effects of temperature during the brewing period
on polyphenol contents in infusions. We found that the increase in the brewing
temperature would increase the polyphenol contents extracted in tea infusion as a general
trend, and the highest percentage was observed for green tea (up to 60%), demonstrating
the health benefits of tea consumers. Additionally, oolong tea with its specific "wrapcurled" structure possessed its own fluctuation in polyphenol releasing percentage,
reaching the highest at 80°C (17.2%) then descending at 100°C (9.80%). However, more
tea samples from various processing methods and species need to be collected to obtain
more data for the assessment of the polyphenol variations among different products.
Besides, the number of brewing cycles should be considered for further study on the
brewing conditions for each typical type of tea so that the desired polyphenol contents in
tea infusions could be obtained.
Conflict of Interest: Authors have no conflict of interest to declare.
Acknowledgments: This research is funded by Nguyen Tat Thanh University, Ho Chi Minh City, Vietnam under grant number 2021.01.21/ HĐ-KHCN.
REFERENCES
Anesini, C., Ferraro, G. E., & Filip, R. (2008). Total Polyphenol Content and Antioxidant Capacity
of Commercially Available Tea (Camellia sinensis) in Argentina. Journal of Agricultural
and Food Chemistry, 56(19), 9225-9229. doi: 10.1021/jf8022782
Appendix F. AOAC: Guidelines for Standard Method Performance Requirements (2016).
14
HCMUE Journal of Science
Vol. 18, No. 6 (2021): 9931005
Han, Q., Mihara, S., Hashimoto, K., & Fujino, T. (2014). Optimization of Tea Sample Preparation
Methods for ICP-MS and Application to Verification of Chinese Tea Authenticity. Food
Science and Technology Research, 20(6), 1109-1119. doi: 10.3136/fstr.20.1109
ISO 14502-1:2005: Determination of substances characteristic of green and black tea-Part 1:
Content of total polyphenols in tea-Colorimetric method using Folin-Ciocalteu reagent
(2005).
ISO 1572:1980: Tea-Preparation of ground sample of known dry matter content (1980).
Jayasekera, S., Molan, A. L., Garg, M., & Moughan, P. J. (2011). Variation in antioxidant potential
and total polyphenol content of fresh and fully-fermented Sri Lankan tea. Food Chem,
125(2), 536-541. doi: 10.1016/j.foodchem.2010.09.045
Karori, S., Wachira, F., Wanyoko, J., & Ngure, R. (2007). Antioxidant capacity of different types of
tea products. African journal of Biotechnology, 6(19). doi: 10.5897/AJB2007.000-2358
Kerio, L., Wachira, F., Wanyoko, J., & Rotich, M. (2013). Total polyphenols, catechin profiles and
antioxidant activity of tea products from purple leaf coloured tea cultivars . Food Chem,
136(3-4), 1405-1413. doi: 10.1016/j.foodchem.2012.09.066
Pham, T. Q., Tong, V. H., Nguyen, H. H., & Bach, L. G. (2007). Total polyphenols, total catechins
content and DPPH free radical scavenger activity of several types of Vietnam commercial
green tea. Science & Technology Development, 10(10), 5-11.
QCVN 01-28:2010/BNNPTNT: National Technical regulation for tea-Procedures for sampling,
analysis of quality and food safety (2010).
Schwalfenberg, G., Genuis, S. J., & Rodushkin, I. (2013). The benefits and risks of consuming
brewed tea: beware of toxic element contamination. Journal of toxicology, 2013. doi:
10.1155/2013/370460
Tao, W., Zhou, Z., Zhao, B., & Wei, T. (2016). Simultaneous determination of eight catechins and
four theaflavins in green, black and oolong tea using new HPLC–MS–MS method. J Pharm
Biomed Anal, 131, 140-145. doi: 10.1016/j.jpba.2016.08.020
TCVN 5609:2007: Tea-Sampling (2007).
TCVN 9738:2013: Tea-Preparation of ground sample of known dry matter content (2013).
Turkmen, N., Sarı, F., & Velioglu, Y. S. (2009). Factors affecting polyphenol content and
composition of fresh and processed tea leaves. Akademik Gida, 7(6), 29-40.
Vuong, Q., Nguyen, V., Golding, J., & Roach, P. (2011). The content of bioactive constituents as a
quality index for Vietnamese teas. International Food Research Journal, 18(1).
Yan, Z., Zhong, Y., Duan, Y., Chen, Q., & Li, F. (2020). Antioxidant mechanism of tea polyphenols
and its impact on health benefits.
Animal
Nutrition,
6(2),
115-123.
doi: 10.1016/j.aninu.2020.01.001
Yao, L., Jiang, Y., Caffin, N., D'arcy, B., Datta, N., Liu, X., . . . & Xu, Y. (2006). Phenolic
compounds in tea
from
Australian
supermarkets.
Food
Chem,
96(4),
614-620. doi: 10.1016/j.foodchem.2005.03.009
Zhao, C.-N., Tang, G.-Y., Cao, S.-Y., Xu, X.-Y., Gan, R.-Y., Liu, Q., . . . & Li, H.-B. (2019).
Phenolic profiles and antioxidant activities of 30 tea infusions from green, black, oolong,
white, yellow and dark teas. Antioxidants, 8(7), 215. doi: 10.3390/antiox8070215
15
HCMUE Journal of Science
Nguyen Cong Hau et
al.
THẨM ĐỊNH PHƯƠNG PHÁP PHÂN TÍCH VÀ ĐÁNH GIÁ ẢNH
HƯỞNG CỦA NHIỆT ĐỘ PHA TRÀ ĐẾN HÀM LƯỢNG POLYPHENOL
TỔNG TRONG NƯỚC TRÀ CỦA MỘT SỐ SẢN PHẨM TRÀ VIỆT NAM
Nguyễn Công Hậu, Lê Thị Anh Đào, Nguyễn Phạm Như Quỳnh, Nguyễn Thành Nho*
Khoa Kỹ thuật Thực phẩm và Môi trường, Trường Đại học Nguyễn Tất Thành, Việt Nam
*
Tác giả liên hệ: Nguyễn Thành Nho – Email:
Ngày nhận bài: 20-02-2021; ngày nhận bài sửa: 24-3-2021; ngày duyệt đăng: 07-6-2021
TÓM TẮT
Sản xuất từ lá của cây Camellia sinesis L. (Kuntz), trà được xem là một trong những thức
uống phổ biến nhất trên thế giới và cây trà được trồng ở khoảng 30 quốc gia. Trong nghiên cứu
này, phương pháp Folin-Ciocalteu được áp dụng để xác định hàm lượng polyphenol tổng (quy về
milli đương lượng gam của gallic acid, GAE) trong các mẫu trà thành phẩm (ba mẫu trà cổ thụ
bao gồm trà đỏ, trà xanh, trà trắng và một mẫu trà oolong) dựa trên ISO 14502-1:2005 với một số
thay đổi, cụ thể là chiết một lần bằng dung mơi chiết methanol:nước (7:3, v/v) có sự hỗ trợ của
siêu âm ở 70 oC với tỉ lệ chiết 0.200:10.00 (g:mL). Phương pháp phân tích được thẩm định trên
thiết bị UV- Vis 1800 của hãng Shimadzu với độ tuyến tính phù hợp (R2 > 0.995), khoảng tuyến tính
10-70 mg GAE L–1, độ lặp lại và độ tái lặp tốt (%RSD lần lượt là 0.79 và 1.2% cho độ lặp trong
ngày và giữa các ngày) và tỉ lệ phục hồi cao (trên 98% cho các mẫu thêm chuẩn). Hàm lượng
polyphenol tổng (giá trị trung bình tính bằng mg GAE g–1 khối lượng khô trong dấu ngoặc đơn) thể
hiện xu hướng giảm dần giữa các mẫu trà, cụ thể trà trắng (206.62) ~ trà xanh (201.33) > trà đỏ
(167.42) > trà oolong (139.18) do sự khác biệt về mức độ oxy hố trong q trình lên men, đặc
biệt đối với trà đỏ và oolong. Hàm lượng polyphenol phóng thích vào nước trà thể hiện xu hướng
chung tăng dần khi tăng nhiệt độ pha trà, ngoại trừ mẫu trà oolong có xu hướng riêng, có thể do
cấu trúc “cuộn xoắn” của loại trà này, dẫn đến thời gian ngâm trà cần phải dài hơn để polyphenol
có thể được phóng thích ổn định và hồn tồn. Nghiên cứu này đóng góp một phần khiêm tốn để
làm giàu thêm dữ liệu cho các sản phẩm trà Việt Nam trong bối cảnh lượng trà sản xuất và xuất
khẩu cao.
Từ khoá: Camellia sinensis L., Folin-Ciocalteu, polyphenol tổng
16