Genome-wide association studies of plant architecture-related traits and 100-seed weight in soybean landraces
Bạn đang xem bản rút gọn của tài liệu. Xem và tải ngay bản đầy đủ của tài liệu tại đây (1.55 MB, 14 trang )
Zhang et al. BMC Genomic Data
(2021) 22:10
/>
BMC Genomic Data
RESEARCH ARTICLE
Open Access
Genome-wide association studies of plant
architecture-related traits and 100-seed
weight in soybean landraces
Xiaoli Zhang1, Wentao Ding1, Dong Xue1, Xiangnan Li1, Yang Zhou1, Jiacheng Shen1, Jianying Feng1, Na Guo1,
Lijuan Qiu2, Han Xing1 and Jinming Zhao1*
Abstract
Background: Plant architecture-related traits (e.g., plant height (PH), number of nodes on main stem (NN), branch
number (BN) and stem diameter (DI)) and 100-seed weight (100-SW) are important agronomic traits and are closely
related to soybean yield. However, the genetic basis and breeding potential of these important agronomic traits
remain largely ambiguous in soybean (Glycine max (L.) Merr.).
Results: In this study, we collected 133 soybean landraces from China, phenotyped them in two years at two
locations for the above five traits and conducted a genome-wide association study (GWAS) using 82,187 single
nucleotide polymorphisms (SNPs). As a result, we found that a total of 59 SNPs were repeatedly detected in at least
two environments. There were 12, 12, 4, 4 and 27 SNPs associated with PH, NN, BN, DI and 100-SW, respectively.
Among these markers, seven SNPs (AX-90380587, AX-90406013, AX-90387160, AX-90317160, AX-90449770, AX90460927 and AX-90520043) were large-effect markers for PH, NN, BN, DI and 100-SW, and 15 potential candidate
genes were predicted to be in linkage disequilibrium (LD) decay distance or LD block. In addition, real-time
quantitative PCR (qRT-PCR) analysis was performed on four 100-SW potential candidate genes, three of them
showed significantly different expression levels between the extreme materials at the seed development stage.
Therefore, Glyma.05 g127900, Glyma.05 g128000 and Glyma.05 g129000 were considered as candidate genes with
100-SW in soybean.
Conclusions: These findings shed light on the genetic basis of plant architecture-related traits and 100-SW in
soybean, and candidate genes could be used for further positional cloning.
Keywords: Soybean (Glycine max (L.) Merr.), Plant architecture-related traits, 100-seed weight, GWAS, Candidate
genes
* Correspondence:
1
National Center for Soybean Improvement, Key Laboratory of Biology and
Genetics and Breeding for Soybean, Ministry of Agriculture, State Key
Laboratory for Crop Genetics and Germplasm Enhancement, College of
Agriculture, Nanjing Agricultural University, Nanjing 210095, China
Full list of author information is available at the end of the article
© The Author(s). 2021 Open Access This article is licensed under a Creative Commons Attribution 4.0 International License,
which permits use, sharing, adaptation, distribution and reproduction in any medium or format, as long as you give
appropriate credit to the original author(s) and the source, provide a link to the Creative Commons licence, and indicate if
changes were made. The images or other third party material in this article are included in the article's Creative Commons
licence, unless indicated otherwise in a credit line to the material. If material is not included in the article's Creative Commons
licence and your intended use is not permitted by statutory regulation or exceeds the permitted use, you will need to obtain
permission directly from the copyright holder. To view a copy of this licence, visit />The Creative Commons Public Domain Dedication waiver ( applies to the
data made available in this article, unless otherwise stated in a credit line to the data.
Zhang et al. BMC Genomic Data
(2021) 22:10
Background
Soybean [Glycine max (L.) Merr.] is an important economic and oil crop, providing abundant plant proteins
and oil to humans [1]. Researchers have increased soybean yield as much as possible through traditional
breeding and molecular breeding methods [2]. The effort
to meet soybean demand on existing cropland areas for
a global population of 9.7 billion by the year 2050 puts
pressure on narrowing the existing gap between the
average yield and yield potential [3, 4]. Plant breeders
continually research how to maximize soybean yield to
solve the contradiction between supply and demand [5].
Plant architecture is a key factor affecting planting density and grain yield in soybean. The ideal soybean plant
architecture optimizes the canopy architecture, improves
photosynthetic efficiency, and prevents lodging, thus
resulting in high overall grain yield [5, 6]. 100-seed
weight (100-SW) is an important component of soybean
yield and an important target trait in field breeding [7].
Moreover, larger seeds, which have greater energy stores,
may improve seedling establishment [8]. Given the importance of four plant architecture-related traits (plant
height (PH), number of nodes on main stem (NN),
branch number (BN) and stem diameter (DI)) and 100SW of soybean, a large number of QTLs associated with
these traits have been identified in the past decade [9],
but the genes underlying the QTLs and their functions
remain largely unknown.
Plant architecture-related traits and 100-SW of soybean are complex quantitative traits influenced by multiple QTLs and are susceptible to environmental factors
[5]. Previous studies were conducted to dissect the genetic basis of plant architecture-related traits and 100-SW
in biparental populations. Hundreds of QTLs were detected across the whole genome of soybean, with many
being simultaneously detected in multiple populations
[10–13]. These studies demonstrated that the genetic
mapping of quantitative traits using genetic linkage
maps is an efficient approach for identifying QTLs. Currently, numerous researchers use molecular markers to
identify QTLs controlling these important agronomic
traits [14]. Given the increased use of molecular markers
to identify QTLs, opportunities exist to significantly increase our knowledge of the genetic basis of these traits
and to accelerate soybean breeding [15]. To date, many
QTLs for plant architecture-related traits and 100-SW
have been reported in investigations using biparental
populations [11, 16–18]. According to the SoyBase database (), there are 239 QTLs controlling PH in soybean, which are distributed on 20
chromosomes, and 37 QTLs related to NN. For BN and
100-SW, 21 and 297 related QTLs have been reported,
respectively. And there were a few reports on the QTL
position of DI in soybean. Despite the extensive QTL
Page 2 of 14
analysis on plant architecture-related traits and 100-SW
of soybean, traditional biparent segregation populations
have several disadvantages, including limited genetic
variation and mapping resolution [19].
With the development of genotyping and sequencing
technologies, the pace of genetic research on crop
quantitative traits has been accelerated. Comparing with
bi-parental QTL mapping studies, the genome-wide association study (GWAS) is a more powerful method for
dissecting the QTLs underlying agronomically important
traits in natural populations. High density of markers in
the GWAS also enables one to predict or identify causal
genes [20]. In recent years, GWAS has rapidly became a
popular and powerful tool to detect natural variation
that accounts for complex and important agronomic
traits of crops, and has been successfully applied to the
studies of many crops, such as Arabidopsis thaliana
[21], rice [22, 23], maize [24, 25], soybean [9], and foxtail
millet [26]. In soybean, the evaluation of several specific
agronomic traits, including seed protein content and oil
concentration [27, 28], sudden death syndrome resistance [29], cyst nematode resistance [30, 31], and flowering time [32], were conducted through GWAS by
genotyping either with Illumina Bead Chips or specific
locus amplified fragment sequence. These studies provide valuable resources for the future molecular breeding
of soybean.
In recent years, association studies have been performed in grain soybean for plant architecture and yieldrelated traits, and they have achieved great success in
identifying loci with high mapping precision [33].
Through genomic consequences of selection and
GWAS, a total of 125 candidate selection regions were
identified of 9 agronomic traits and 5 potential candidate
genes were predicted [34]. Zhang et al. (2016) conducted
a genome-wide association study in a population of 309
soybean germplasm accessions, identified 22 loci of
minor effect and predicted 3 candidate genes on
chromosome 19 [35]. Fang et al. (2017) collected 809
soybean materials worldwide and performed a two-year
phenotypic determination of 84 agronomic traits in three
locations, and identified 245 SNPs, including known
genes such as Dt1, E2, E1, Ln, Dt2, Fan and Fap, as well
as 16 unreported loci, which are pleiotropic for different
traits [9]. Diers et al. (2018) performed an association
mapping for the NAM population of 5600 inbred lines,
and SNP data revealed 23 significant marker-trait associations for yield, 19 for maturity, 15 for plant height, 17
for plant lodging, and 29 for seed mass [36]. Association
mapping has been used to identify significantly associated locus for flowering stage, grain filling stage, maturity stage, yield and 100-SW of soybean, and detected
nine, six, four, five and two significantly associated SNPs,
respectively [37]. A total of 58 SNPs that were
Zhang et al. BMC Genomic Data
(2021) 22:10
Page 3 of 14
significantly associated with internode number (IN),
plant height (PH), seed weight (SW), and seed yield per
plant (SYP) were identified by GWAS, and 28 related
candidate genes were predicted [38]. By using GWAS,
14 quantitative trait nucleotides (QTNs) were identified
to be associated with seed length, 13 with seed width
and 21 with seed thickness in four tested environments
[39]. Using the multilocus GWAS methods, a total of
118 QTNs of 100-seed weight were detected, and three
potential candidate genes were identified in soybean
[40]. Although a lot of researches for plant architecture
and yield-related traits have been carried out in soybean,
the molecular mechanism underlying these traits in soybean remains unclear due to their complexity genetic
mechanism.
In this study, we collected 133 diverse soybean landraces, cultivated them at two locations for 2 years, and
phenotyped them for the four plant architecture-related
traits (PH, NN, BN and DI) and 100-SW. Using the 180
K AXIOM SoyaSNP array, more than 160 thousand
genetic markers were generated. After filtering and
quality control, a total of 82,187 high-quality SNPs
(MAF > 0.05, missing data < 10%) were used for association mapping. The endeavor from comprehensive
GWAS analyses enabled the identification of the underlying genetic loci and prediction of potential candidate
genes for five traits. In addition, candidate genes of 100SW were initially confirmed by qRT-PCR. The objectives
of this study were to reveal the genetic basis of plant
architecture-related traits and 100-SW in soybean and
provide valuable markers and candidate genes for the
molecular breeding of soybean.
Results
Phenotypic analysis of the four plant architecture-related
traits and 100-SW
Four plant architecture-related traits and 100-SW were
investigated using the 133 soybean landraces planted in
two consecutive years at two locations. Extensive phenotypic variations were observed for all traits in the 133
soybean landraces (Table 1). The phenotypic variation of
PH, NN, BN and DI in the 2016JP, 2017JP and 2017DT
environments were 21.64–249.33 cm, 9.11–28.83, 0–7.33
and 2.90–11.01 mm, respectively. The 100-SW ranged
from 3.76 to 37.23 g in the 2017JP and 2017DT environments. The average of PH in 2017DT was higher than
that in 2016JP and 2017JP, whereas all of the other traits
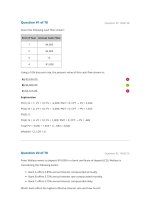
revealed little variation (Table 1). The frequency distribution of the five traits based on best linear unbiased
prediction (BLUP) values displayed an approximately
normal distribution, except for a few materials that had
large deviations (Fig. 1). Analysis of variance indicated
that the genotype (G), environment (E) and genotype by
environment interaction (G × E) had significant effects
on PH, NN and DI (P < 0.01; Table 1). The genotype (G)
and genotype by environment interaction (G × E) had
significant effects on BN and 100-SW, but the genotype
by environment interaction (G × E) had no significant effects. Heritability (h2) was calculated for the four plant
architecture-related traits and 100-SW (Table 1). The
Table 1 Descriptive statistics, ANOVA and heritability (h2) for the four plant architecture-related traits and 100-SW across multiple
environments
Traitsa
Environmentsb
Mean
SDc
Min
Max
Skew
Kurtosis
Gd
Ed
G × Ed
PH
2016JP
45.43
15.73
21.64
95.56
0.96
0.23
**
**
**
88.85
2017JP
74.67
30.51
27.11
184.33
0.91
0.76
2017DT
100.78
38.37
24.00
249.33
0.72
1.15
**
**
**
93.53
**
65.17
**
67.39
**
98.66
NN
BN
DI
100-SW
a
2016JP
15.54
3.96
9.11
28.00
0.75
0.03
2017JP
17.87
4.39
10.00
28.33
0.16
−0.90
2017DT
18.41
4.17
10.00
28.83
−0.05
−0.64
2016JP
2.83
1.16
0.56
7.33
0.85
1.70
2017JP
2.68
1.14
0.00
6.00
0.20
0.15
2017DT
2.72
1.25
0.17
6.67
0.83
1.38
2016JP
4.57
0.94
2.90
8.85
1.09
2.64
2017JP
6.20
1.29
3.86
9.56
0.66
−0.09
2017DI
6.83
1.27
3.74
11.01
0.28
0.34
2017JP
14.44
4.29
5.34
34.25
0.97
2.59
2017DI
14.43
4.55
3.76
37.23
1.09
4.00
**
**
**
**
PH (Plant height), NN (Number of nodes on main stem), BN (Branch number), DI (Stem diameter) and 100-SW (100-seed weight)
b
2016JP, 2017JP and 2017DT represent the environments of Jiangpu in 2016, Jiangpu in 2017 and Dangtu in 2017, respectively
c
SD represents standard deviation
d
G, E and G × E represent the effect for genotype, environment and genotype × environment interaction, respectively. **Significant at P ≤ 0.01
e 2
h (%) represents heritability
h2 e(%)
Zhang et al. BMC Genomic Data
(2021) 22:10
Page 4 of 14
Fig. 1 Phenotypic variations of the four plant architecture-related traits and 100-SW in soybean landraces. a, b, c, d and e represent the
frequency distribution of PH, NN, BN, DI and 100-SW, respectively
heritabilities of the five traits ranged from 65.17 to
98.66%. Among them, the heritability of 100-SW was
the highest at 98.66%, while the heritability of BN
was the lowest at 65.17%. The correlation coefficients
for the five traits were calculated based on the BLUP
values and are summarized in Table 2. There was a
significant positive correlation between PH and NN,
with a correlation coefficient of 0.894. There was also
a significant positive correlation between PH, NN, BN
and DI. Additionally, 100-SW was only significantly
positively correlated with DI, with a correlation coefficient of 0.244. Correlation analysis showed that there
was a positive correlation between PH, NN, BN, DI
and 100-SW in soybean.
Table 2 Correlation coefficients among the four plant
architecture-related traits and 100-SW
PH
NN
BN
NN
0.894**
BN
0.400**
0.490**
DI
0.482**
0.544**
0.460**
100-SW
0.044
−0.031
0.013
DI
Genetic diversity, LD and population structure
Analyses of the SNP data, LD and population structure
used in this study were reported by genotyping the 133
soybean landraces with the 180 K AXIOM Soya SNP
array [41]. According to MAF > 0.05 and missing data <
10%, we detected a total of 82,187 SNPs for subsequent
analysis. The marker density ranged from 16.28 kb/SNP
to 9.57 kb/SNP, with an average of 11.76 kb/SNP. The
average LD decay of all chromosomes was 119.07 kb at
the r2 calculated via PLINK V1.07 (Additional file 1: Fig.
S1) [41]. Previous studies have used 8270 SNPs and
STRUCTURE 2.3.4 software to analyze population structure of the population of the 133 soybean landraces [41].
Population structure analysis showed that the mean LnP
(K) did not plateau at a single K value, but instead continued to increase with relatively constant increments.
Calculation of Delta K revealed a sharp peak at K = 2,
therefore, the 133 soybean landraces were divided into
two subgroups, designated subgroup 1 and subgroup 2
(Additional file 2: Fig. S2) [41].
Model comparison for controlling false associations
0.244**
The values represent phenotypic correlation coefficients based on the BLUP
values across multiple environments. PH Plant height, NN Number of nodes on
main stem, BN Branch number, DI Stem diameter and 100-SW 100-seed
weight. ** Significant at P ≤ 0.01
Association mapping for the four plant architecturerelated traits and 100-SW were performed to evaluate
the effects of population structure (Q), principal component analysis (PCA) and familial relationship (K) on
Zhang et al. BMC Genomic Data
(2021) 22:10
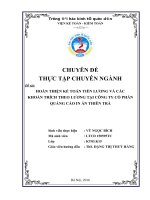
controlling false associations. For the five traits, the observed P values from the GLM (PCA) and GLM (Q)
models greatly deviated from the expected P values assuming that no association existed. The P values from
the MLM (PCA + K) and MLM (Q + K) models were
similar and close to the expected P values (Fig. 2).
Although the MLM (PCA + K) model detected fewer associations than the MLM (Q + K) model, the observed P
values for the Q + K model were closer to the expected
P values than the MLM (PCA + K) model, indicating that
the MLM (Q + K) model could effectively control false
positive associations and avoid false negative associations. Therefore, in the current study, the MLM (Q + K)
model was chosen for association mapping.
Association mapping of the four plant architecturerelated traits and 100-SW
The MLM model, with both Q and K-matrices as covariates, was used in the association study of 82,187 SNPs
with PH, NN, BN, DI and 100-SW from the 133 soybean
landraces. To identify SNPs associated with the five
Page 5 of 14
traits, we used the MLM (Q + K) model to analyze five
traits in the different environments. A total of 59 SNPs
was significantly associated (−log10(P) ≥ 3.5) with five
traits in at least two environments. Among them, 12, 12,
4, 4 and 27 SNPs were significantly associated with PH,
NN, BN, DI and 100-SW, respectively (Fig. 3 and
Table 3). For PH, 12 SNPs were detected in at least two
environments. Among these SNPs, AX-90380587 and
AX-90406013 were markers with larger effects and were
repeatedly detected in three environments, and the contribution of a single marker to the observed phenotypic
variation was 14.05–18.40% (Table 3). For NN, 12 SNPs
were detected in at least two environments. Among
these SNPs, AX-90387160 and AX-90317160 were
markers with larger effects and were repeatedly detected
in three environments, and the contribution of a single
marker to the observed phenotypic variation was 13.35–
19.21% (Table 3). For BN, 4 SNPs were detected in at
least two environments. Among these SNPs, AX90449770 was a larger effect marker which was repeatedly detected in three environments, and its contribution
Fig. 2 Q-Q plots of the estimated -log10(P) from association mapping of the four plant architecture-related traits and 100-SW. a, b, c, d, and e
represent Q-Q plots for PH, NN, BN, DI and 100-SW based on the BLUP values across multiple environments, respectively. The red line bisecting
the plot represents the expected P values with no associations present. The blue line represents observed P values using the GLM (PCA) model.
The green line represents observed P values using the GLM (Q) model. The black line represents observed P values using the MLM (PCA + K)
model. The red line represents observed P values using the MLM (Q + K) model
Zhang et al. BMC Genomic Data
(2021) 22:10
Page 6 of 14
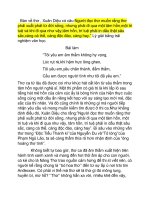
Fig. 3 Manhattan and Q-Q plots of the GWAS for the four plant architecture-related traits and 100-SW in soybean landraces. The horizontal red
line indicates the genome-wide significance threshold (−log10(P) ≥ 3.5). a, b, c, d and e represent association mapping of PH, NN, BN, DI and 100SW based on the BLUP values, respectively
Zhang et al. BMC Genomic Data
(2021) 22:10
Page 7 of 14
Table 3 SNPs significantly associated with the four plant architecture-related traits and 100-SW across multiple environments
Traits
Markersa
Chr.
Position
Environmentsb
-log10 (P)
R2(%)
PH
AX-90403529
1
56,192,858
2017DT/Mean/BLUP
3.65 ~ 4.2
16.02 ~ 17.32
AX-90343633
2
43,898,048
2017DT/BLUP
3.53 ~ 3.54
14.02 ~ 14.57
AX-90380587
5
2,724,763
2016JP/2017DT/BLUP
3.74 ~ 4.53
14.05 ~ 18.26
AX-90497935
5
2,820,291
2016JP/BLUP
3.53 ~ 3.76
13.3 ~ 14.98
AX-90498802
5
2,775,722
2017DT/Mean/BLUP
3.99 ~ 4.61
16.39 ~ 18.53
AX-90520578
5
2,727,221
2016JP/2017DT/BLUP
3.74 ~ 4.53
14.05 ~ 18.26
AX-90467414
11
1,375,175
2017DT/Mean/BLUP
3.59 ~ 3.99
13.66 ~ 16.41
AX-90406013
14
45,923,523
2017DT/Mean/BLUP
4.23 ~ 4.44
16.63 ~ 18.4
AX-90335719
15
47,490,299
2017DT/Mean/BLUP
3.52 ~ 4.08
12.5 ~ 15.48
AX-90456181
18
57,800,102
2017DT/BLUP
3.53 ~ 3.57
13.31–14.67
AX-90403639
18
44,436,699
2016JP/Mean/BLUP
3.75 ~ 4.49
12.05 ~ 15.05
AX-90466852
18
45,787,667
2016JP/Mean
3.53 ~ 4.56
11.19 ~ 19.21
AX-90387160
7
42,526,322
2016JP/Mean/BLUP
3.81 ~ 4.56
15.1 ~ 19.21
AX-90435665
11
25,260,079
2017JP/Mean
3.5 ~ 3.81
14.92 ~ 15.2
AX-90436094
11
25,264,410
2017JP/Mean
3.5 ~ 3.81
14.92 ~ 15.2
AX-90427317
12
39,270,786
2017JP/Mean
3.7 ~ 3.8
15.2 ~ 15.55
AX-90361359
14
45,843,392
2016JP/Mean
3.79 ~ 4.58
15.1 ~ 18.57
AX-90453654
14
44,683,373
2016JP/Mean
3.9 ~ 4.56
15.57 ~ 18.48
AX-90377223
16
6,762,918
2016JP/Mean
3.79 ~ 4.59
15.12 ~ 18.6
AX-90451767
16
6,715,180
2016JP/Mean
3.79 ~ 4.61
15.12 ~ 18.71
AX-90475022
16
6,895,355
Mean/BLUP
3.54 ~ 3.91
13.27 ~ 15.61
AX-90507356
16
6,751,612
2016JP/Mean
3.77 ~ 4.63
15.02 ~ 18.79
AX-90317160
19
38,745,810
2016JP/2017DT/Mean/BLUP
3.55 ~ 4.4
13.35 ~ 17.8
AX-90352912
19
45,142,445
2016JP/Mean
4.03 ~ 4.19
16.16 ~ 16.84
AX-90389449
6
7,767,192
Mean/BLUP
3.55 ~ 3.98
13.59 ~ 16.39
AX-90420194
6
15,358,000
2016JP/Mean
3.61 ~ 3.66
11.5 ~ 11.58
AX-90449770
6
48,360,017
2016JP/Mean/BLUP
3.58 ~ 3.66
10.71 ~ 11.51
AX-90345457
18
47,321,404
Mean/BLUP
4.29 ~ 4.45
16.47 ~ 18.18
AX-90397877
8
3,019,730
Mean/BLUP
3.77 ~ 3.8
14.1 ~ 14.7
AX-90460927
10
44,361,012
2016JP/Mean
4.03 ~ 4.08
16.03
AX-90488930
18
308,829
2017JP/Mean
3.56 ~ 4.05
13.9 ~ 16.16
AX-90511176
18
328,596
2017JP/Mean
3.66 ~ 4.03
14.19 ~ 16.01
AX-90483564
3
36,787,728
Mean/BLUP
4.11 ~ 4.42
18.13 ~ 20.04
AX-90435834
4
1,402,717
2017JP/BLUP
3.8 ~ 3.96
14.38 ~ 15.51
Seed weight 2–1; Seed weight 47–3
AX-90520043
5
32,154,586
2017JP/2017DT/BLUP
4.87 ~ 5.14
20.42 ~ 21
Seed weight 36–9; Seed weight 37–12
AX-90370125
6
5,791,933
2017JP/2017DT/BLUP
3.88 ~ 4.91
15.34 ~ 19.78
Seed weight-008; Seed weight-011
AX-90305893
7
35,963,868
2017JP/2017DT/BLUP
4.2 ~ 4.42
16.47 ~ 16.81
AX-90428268
7
14,899,829
2017JP/2017DT/BLUP
3.52 ~ 3.75
10.97 ~ 11.67
AX-90328574
9
39,625,218
2017DT/BLUP
3.98 ~ 4.28
15.04 ~ 16.8
AX-90390639
10
4,423,355
2017JP/2017DT/BLUP
3.64 ~ 3.7
13.89 ~ 14.24
AX-90397611
10
4,455,671
2017JP/2017DT/BLUP
3.77 ~ 3.95
14.67 ~ 15.45
AX-90338196
10
4,366,228
2017JP/2017DT/BLUP
3.5 ~ 3.56
10.47 ~ 11.2
AX-90450721
10
4,397,396
2017JP/2017DT/BLUP
3.57 ~ 3.61
10.76 ~ 11.2
AX-90450778
10
4,426,008
2017JP/2017DT/BLUP
3.7 ~ 3.85
14.47 ~ 15.19
NN
BN
DI
100SW
100SW
Known QTLsc
Plant height 26–10
Plant height 26–14
Seed weight 34–8
Zhang et al. BMC Genomic Data
(2021) 22:10
Page 8 of 14
Table 3 SNPs significantly associated with the four plant architecture-related traits and 100-SW across multiple environments
(Continued)
Traits
R2(%)
Markersa
Chr.
Position
Environmentsb
-log10 (P)
AX-90456677
10
4,365,393
2017JP/2017DT/BLUP
3.5 ~ 3.59
10.46 ~ 11.14
AX-90464016
10
4,376,046
2017JP/2017DT/BLUP
3.57 ~ 3.61
10.76 ~ 11.2
AX-90467603
10
4,363,693
2017JP/2017DT/BLUP
3.5 ~ 3.59
10.46 ~ 11.14
AX-90473871
10
4,426,717
2017JP/2017DT/BLUP
3.86 ~ 3.97
15.06 ~ 15.5
AX-90514209
10
1,523,443
2017JP/BLUP
3.52–3.54
13.27 ~ 13.62
AX-90462182
11
15,778,903
2017JP/2017DT/BLUP
4.38 ~ 4.58
15.2 ~ 15.48
AX-90463646
14
12,829,279
2017JP/2017DT/BLUP
4.28 ~ 4.51
17.43 ~ 18.23
AX-90481424
14
5,733,475
2017DT/BLUP
3.55 ~ 3.58
13.47 ~ 13.82
AX-90512978
14
45,661,649
2017JP/2017DT/BLUP
3.6 ~ 4.54
14.11 ~ 18.24
AX-90496773
16
1,617,227
2017DT/BLUP
4.27 ~ 4.48
16.25 ~ 17.77
AX-90519309
17
4,197,693
2017JP/2017DT/BLUP
3.86 ~ 4.64
15.23 ~ 19.32
AX-90336868
18
48,261,812
2017JP/2017DT/BLUP
3.62 ~ 4.0
14.04 ~ 15.44
AX-90369283
18
7,017,555
2017JP/2017DT/BLUP
4.37 ~ 4.82
17.49 ~ 18.8
AX-90350838
19
45,623,416
2017JP/2017DT/BLUP
4.29 ~ 4.41
17.68 ~ 18.24
AX-90460297
20
44,288,532
2017JP/2017DT/BLUP
4.31 ~ 4.6
16.93 ~ 17.58
Known QTLsc
Seed weight 36–11; Seed weight 4–1
Seed weight 50–4
a
The significant SNP ID, b 2016JP, 2017JP and 2017DT represent the environments of Jiangpu in 2016, Jiangpu in 2017 and Dangtu in 2017, respectively. c
Comparision of trait-marker associations identified in this study with QTLs identified in previous studies. “Mean” represents association mapping with the mean
values across three environments, “BLUP” represents association mapping with the BLUP values across three environments
to the observed phenotypic variation was 10.71–11.51%
(Table 3). For DI, 4 SNPs were detected in at least two
environments. Among these SNPs, AX-90460927 was
markers with larger effects and were repeatedly detected
in two environments, and the contribution of a single
marker to the observed phenotypic variation was 16.03%
(Table 3). For 100-SW, twenty-seven SNPs were detected in at least two environments. Among these SNPs,
AX-90520043 was a larger effect marker which was repeatedly detected in two environments, and its contribution to the observed phenotypic variation was 20.42–
21.0% (Table 3). Based on the stability of the SNPs with
significant associations in each environment and the
higher phenotype variation explanations, seven SNPs
(AX-90380587, AX-90406013, AX-90387160, AX90317160, AX-90449770, AX-90460927 and AX90520043) with large effects were selected for subsequent
candidate gene prediction.
Prediction of candidate genes
Using haplotype analysis of the LD decay distance (±
119.07 kb) where 7 SNPs with large effects markers are
located, we found that there is an LD block located in
the range of 130.9 kb (32141519–32,272,444) on
chromosome 5 with the SNP marker AX-90520043,
which is only significantly associated with 100-SW.
Compared to the candidate region where the marker
AX-90520043 is located, the LD block reduces the candidate region (± 119.07 kb) by approximately 107 kb
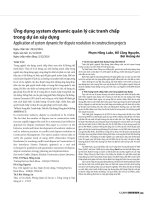
(Fig. 4a). Compared with the alternative alleles, the 100-
SW of the materials carrying the favorable allele (GG) at
AX-90520043 was 21.7% higher than the materials carrying the unfavorable allele (TT) (Fig. 4b). Based on the
LD decay distance or the LD block and functional annotations, we selected 15 candidate genes for the four plant
architecture-related traits and 100-SW in these regions
near those seven SNPs with large effects. Among them,
the number of candidate genes for PH, NN, BN, DI and
100-SW were four, two, one, four and four, respectively.
The detailed functional annotations are shown in
Table 4.
To confirm whether the potential candidate genes
participated in the accumulation of 100-SW, we tested
the expression patterns of the four genes (Glyma.05
g127900, Glyma.05 g128000, Glyma.05 g129000 and
Glyma.05 g129400) via qRT-PCR in the seeds from the
extreme materials at four developmental growth stages
(R3, R5, R6 and R7). The genotype of the ZDD06067
(100-SW 24.36 ± 1.67 g) and ZDD20532 (100-SW 4.55 ±
0.94 g) extreme materials at the AX-90520043 locus
were AA (unfavorable allele) and TT (favorable allele),
respectively. Among the four potential candidate genes
associated with 100-SW, Glyma.05 g127900, Glyma.05
g128000 and Glyma.05 g129000 showed significant
differences in expression between ZDD06067 and
ZDD20532 at four stages during soybean seed development (P ≤ 0.01) (Fig. 5). During all four tested growth
stages, there was a pronounced differential expression of
the 100-SW material genotype by ZDD06067 (higher)
and 100-SW genotype ZDD20532 (lower). Therefore,
Zhang et al. BMC Genomic Data
(2021) 22:10
Page 9 of 14
Fig. 4 The candidate regions of the large-effect markers associated with 100-SW and phenotypic differences between accessions carrying
different alleles. a AX-90520043 is significant associated with 100-SW, which is located on Gm05. b The allele effects for the 100-SW marker AX90520043 in soybean landraces. **Significant at P ≤ 0.01
Glyma.05 g127900, Glyma.05 g128000 and Glyma.05
g129000 may be used as candidate genes for soybean
100-SW, as they negatively regulate 100-SW in soybean.
Discussion
The large phenotypic variations observed within the four
plant architecture-related traits and 100-SW allowed us to
identify the best genes with the largest effects (Table 1). In
this study, the heritabilities of the five traits ranged from
65.17 to 98.66%; the smallest heritability was BN and the
largest was 100-SW. The heritability of NN is approximately 40% different from that calculated by Zhang et al.
(2015), but the heritabilities for other traits were not much
different [5]. This may be caused by the fact that NN is
Table 4 Functional annotation of the potential candidate genes for the four plant architecture-related traits and 100-SW in soybean
Traits
Candidate genes
Function annotation
PH
Glyma.05 g030900
Pentatricopeptide repeat (PPR) superfamily protein
Glyma.14 g194100
zinc finger (CCCH-type) family protein
Glyma.14 g194400
Pentatricopeptide repeat (PPR-like) superfamily protein
Glyma.14 g194600
ATNDI1, NDA1|alternative NAD(P)H dehydrogenase 1
Glyma.19 g128800
PIN1, ATPIN1|Auxin efflux carrier family protein
NN
Glyma.19 g129100
TTF-type zinc finger protein with HAT dimerisation domain
BN
Glyma.06 g294700
GDSL-like Lipase/Acylhydrolase superfamily protein
DI
Glyma.10 g210500
GATA transcription factor 9
Glyma.10 g210600
ARF16|auxin response factor 16
Glyma.10 g211000
PIP2B, PIP2;2|plasma membrane intrinsic protein 2
Glyma.10 g212200
UBC19|ubiquitin-conjugating enzyme19
Glyma.05 g127900
Small nuclear ribonucleo protein family protein
Glyma.05 g128000
Chlorophyll A/B binding protein 1
Glyma.05 g129000
HMG-box (high mobility group) DNA-binding family protein
Glyma.05 g129400
basic helix-loop-helix (bHLH) DNA-binding superfamily protein
100-SW
Zhang et al. BMC Genomic Data
(2021) 22:10
Page 10 of 14
Fig. 5 Expression analysis of potential 100-SW candidate genes in extreme materials at four growth developmental stages (R3, R5, R6 and R7).
The extreme materials for 100-SW include ZDD06067 (24.36 ± 1.67 g) and ZDD20532 (4.55 ± 0.94 g). The error bar indicates the standard deviation.
The results are representative of three biological replicates. *Significant at P ≤ 0.05; **Significant at P ≤ 0.01
greatly affected by environmental factors. In addition, the
average of PH in 2017DT was higher than that in 2016JP
and 2017JP, which may be due to the relatively sufficient
rain in 2017DT and dry weather in 2016JP and 2017JP
(Table 1). The results of previous studies confirmed that
PH, NN, BN, DI and 100-SW have a crucial role in soybean plant architecture or yield [42, 43]. Correlation analysis showed that there was a significant positive
correlation between PH, NN, BN and DI, while 100-SW
was only significantly positively correlated with DI. This
may be fact that PH, NN, BN and DI are plant architecture traits, and 100-SW is related to yield traits. Additionally, DI was significantly positively correlated with 100SW, which indicated that the photosynthetic products of
the larger stems were transported from the source to the
reservoir faster, thus the flux was larger, which played an
important role in the later grain and development [44].
Therefore, during the soybean breeding process, breeders
should pay special attention to selecting materials with
slightly higher PH and NN, moderate BN, and thicker DI
to ensure high soybean yield.
In this study, the MLM (Q + K) model was used for a
GWAS to examine the four plant architecture-related
traits and 100-SW. Fifty-nine stable and significant SNPs
were identified, of which 25 were located in QTLs of the
reported related traits. Thirty-four novel loci were
identified in this study. The three SNPs (AX-90335719,
AX-90403639, and AX-90466852) that were significantly
associated with PH were consistent with the results of
Sun et al. (2006) [45]. These SNPs, which are significantly associated with NN, BN, and DI are all new loci
identified in this study. Of the 27 SNPs significantly associated with 100-SW, 22 were within reported QTLs
for seed weight, and 5 were new loci. The significantly
associated marker AX-90435834 located on chromosome 4 is located within previously reported two seed
weight QTLs [16, 46]. Both AX-90520043 and AX90370125 are located within the previously reported seed
weight related QTLs [11, 47, 48]. The 10 SNPs on
chromosome 10 are close located and may belong to the
same seed weight QTL which are located within
previously reported seed weight QTL [49]. Both AX90462182 on chromosome 11 and AX-90369283 on
chromosome 18 are located within previously reported
QTLs [48–50]. In this study, thirty-four new loci were
identified and this may be related to the different populations and environments used for association mapping.
Through the functional annotation of genes, the
current study predicted a total of 15 potential candidate
genes associated with PH, NN, BN, DI and 100-SW.
Among these 15 genes, four genes (Glyma.05 g030900,
Glyma.14 g194100, Glyma.14 g194400 and Glyma.14
g194600) are related to PH. The proteins encoded by
Glyma.05 g030900 and Glyma.14 g194400 belong to the
pentatrico peptide repeat (PPR) family of proteins, which
are involved in the metabolic regulation of RNA, act as
Zhang et al. BMC Genomic Data
(2021) 22:10
binding proteins, and have chloroplasts and mitochondria as their sites of action [51]. Glyma.14 g194100 and
Glyma.14 g194600 encode a zinc finger family protein
and ATNDI1, respectively. The zinc finger family protein gene is expressed in different developmental stages
of different tissues of plants, regulating seed development and germination, and plays an important role in
plant growth and development [52]. The potential candidate genes for NN are Glyma.19 g128800 and Glyma.19
g129100, which encode an auxin transporter protein and
zinc finger protein, respectively. Glyma.06 g294700, a
candidate gene for BN, encodes a GDSL-type lipase that
belongs to a large gene family in plants. Plant GDSL
lipase plays an important role in plant growth and development, organ morphogenesis and lipid metabolism
[53]. There are four genes related to DI, among which
Glyma.10 g210500 encodes a GAGA-binding transcription factor protein, whereas Glyma.10 g210600,
Glyma.10 g211000 and Glyma.10 g212200 encode auxin
response factor 16 (ARF16), a plasma membrane protein
and ubiquitin-binding enzyme 19 (UBC19), respectively.
Additionally, this study also predicted four candidate
genes (Glyma.05 g127900, Glyma.05 g128000, Glyma.05
g129000 and Glyma.05 g129400) that may be related to
100-SW. The results of qRT-PCR analysis indicated that
Glyma.05 g127900, Glyma.05 g128000 and Glyma.05
g129000 were differentially expressed in 100-SW extreme materials. Among these genes, Glyma.05 g127900
encode a ribonucleoprotein, its homologous gene is
SAD1 in Arabidopsis. Studies have confirmed that SAD1
encodes a polypeptide similar to multifunctional Smlike-snRNP proteins that are required for mRNA
splicing, export, and degradation, the sad1 mutant of
Arabidopsis can delay seed germination [54]. Glyma.05
g128000 encode a chlorophyll a/b binding protein, previous studies have shown that the protein can bind to
photosynthetic pigments to form a light-harvesting pigment protein complex to participate in light energy
transfer and play a role in plant photosynthesis [55]. In
addition, AX-90520043, which is significantly associated
with 100-seed weight, is located in the CDS region of
Glyma.05 g128000. Glyma.05 g128000 may affect the accumulation and transport of soybean dry matter by
regulating photosynthetic reaction, and it is likely to participate in the regulation of seed weight in soybean.
Glyma.05 g129000 encodes a HMG-box DNA binding
protein. At present, the regulatory network of HMG-box
DNA binding protein is still unclear. It may be involved
in the regulation of genes involved in soybean seed
development, and then participate in the regulation of
100-SW in soybean. However, further evidence is needed
to functionally validate this hypothesis.
In summary, our results demonstrated that the four
plant architecture-related traits and 100-SW in soybean
Page 11 of 14
are substantially correlated with both phenotype and
genotype. The utilization of the highly associated
markers detected in multiple environments and the potential candidate genes could accelerate the optimization
of molecular breeding and the understanding of the genetic mechanisms underlying agronomic traits.
Conclusion
In this study, we identified 12, 12, 4, 4 and 27 SNPs
associated with PH, NN, BN, DI and 100-SW, respectively, via GWAS. Most markers were located within or
close to QTLs identified in previous studies. We were
particularly interested in the large-effect markers AX90380587, AX-90406013, AX-90387160, AX-90317160,
AX-90449770, AX-90460927 and AX-90520043 for PH,
NN, BN, DI and 100-SW, and 15 potential candidate
genes that were predicted based on functional annotations. According to the expression analyses, Glyma.05
g127900, Glyma.05 g128000 and Glyma.05 g129000 are
proposed as the candidate genes for 100-SW, but further
investigation is needed for verification of this hypothesis.
These findings shed light on the genetic basis of PH,
NN, BN, DI and 100-SW, and candidate genes could be
used for further positional cloning.
Methods
Plant materials, field trials and trait phenotyping
The germplasm for this study contained 133 soybean
landraces selected from the soybean mini core collection
of 23,587 soybean germplasms [56]. Those 133 soybean
landraces came from 24 provinces and were distributed
in four ecoregions of China as follows: the Northeast region, the North region, the Huang-huai region and the
South region [41]. The experiment materials were provided by Lijuan Qiu, a researcher from the Chinese
Academy of Agricultural Sciences.
One hundred and thirty three soybean landraces were
planted at Jangpu (N 31.2, E 118.4) in 2016 and 2017
and at Dangtu (N 31.6, E 118.5) in 2017 with three randomized replications, with one row per plot, 40 plants
per row, 10 cm between plants within each row and 50
cm between rows. 2016JP, 2017JP and 2017DT represent
the environments of Jiangpu in 2016, Jiangpu in 2017
and Dangtu in 2017, respectively. The field management
was performed under normal soybean production conditions. Five major plant traits, including PH, NN, BN, DI
and 100-SW, were investigated. For each of the 2016JP,
2017JP and 2017DT environments, 5 plants were randomly selected for the determination of PH, NN, BN,
and DI. In 2017JP and 2017DT, 100-SW determination
was performed for each block. Plant height (PH, measured in cm) is the length of the cotyledonary node to
the top of the plant. Number of nodes on main stem
(NN) indicate the number of nodes from the
Zhang et al. BMC Genomic Data
(2021) 22:10
cotyledonary node to the top of the main stem node.
Branch number (BN) indicates the effective number of
branches. The stem diameter of the main stem was measured at the third node space with a micrometer (DI,
measured in mm). 100-seed weight was obtained by
weighing 100 seeds immediately after drying the seeds
mixed in each block (100-SW, measured in g). The
names of the 133 soybean landraces used in this study
and the original phenotype data were listed in Additional file 3: Table S1.
Phenotypic data analysis
Statistical analyses of the above five traits were performed using the R software (http:/www.R-project.org)
[57]. Analysis of variance (ANOVA) was performed for
all traits using a general linear model. A best linear unbiased prediction (BLUP) mixed model was fit to account for the year, trial and location effects, together
with their interactions. The breeding value from the
mixed model was also used for association mapping as
phenotypic data. Broad-sense heritability was estimated
using SAS version 9.4 [58] according to the formula:
σ 2g
h2 ẳ
2g
2ge
2
ỵ
ỵ e
n
rn
!
where 2g is the genetic variance, σ2ge is the variance due
to the G × E interaction, σ2e is the residual error, n is the
number of environments and r is the number of replicates within the environment. The estimates of σ2g, σ2ge
and σ2e were obtained from ANOVA by considering the
environment as a random effect.
Analysis of SNP data, LD and population structure
The 133 soybean landraces had been genotyped with the
180 K AXIOM Soya SNP array previously [41]. According to MAF > 0.05 and missing data < 10%, we detected
a total of 82,187 SNPs that were used for association
mapping. LD was calculated using 44,838 SNPs covering
the 20 chromosomes by PLINK V1.07. The pairwise LD
(r2) among SNPs was estimated using E (r2) = 1/ (1 +
4Nec) [59], where c represents the recombination rate of
Morgan units and Ne represents the effective population
size. The LD decay rate of the population was measured
as the chromosomal distance when the average r2 decreased to half its maximum value [23]. The STRUCT
URE 2.3.4 software based on the Bayesian model was
used to explore the population structure of the 133 soybean landraces based on 82,187 SNPs [41]. A total of 82,
187 SNPs were employed to conduct principal component analysis (PCA) and construct a neighbor-joining
phylogenetic tree using PLINK V1.07 and PHYLIP. The
Page 12 of 14
TASSEL V5.2.15 software was used to calculate the
kinship matrix, which represents the similarity of the different pairs of SNPs between genotypes.
Association mapping
The existence of a population structure and relative
kinship in natural populations always results in a high
level of spurious positives in association mapping [60].
The population structure (Q), principal component analysis (PCA) and relative kinship (K) for the panel of 133
soybean landraces have been evaluated previously [41],
and their effects on associations were evaluated with the
following four statistical models: (1) the GLM model
(PCA); (2) the GLM model (Q); (3) the MLM model
(PCA + K); and (4) the MLM model (Q + K). The
quantile-quantile plots of the estimated −log10(P) were
displayed using the observed P values from marker-trait
associations and the expected P values from the assumption that no associations exist between the markers and
traits. The model with observed P values closest to the
expected P values was chosen as the optimal model to
control the confounding of population structure. Using
the optimal statistical model, association analyses were
carried out with 82,187 SNPs for all traits using the
mean and BLUP values across multiple environments
and within each environment [61]. Genome-wide association study were performed by TASSEL V5.2.15. In this
study, the markers above the significant association
threshold of –log10(P) ≥ 3.5 was considered significantly
associated with target traits.
Prediction of candidate genes
To reduce false positives, we defined the candidate SNPs
that had significant associations in at least two environments. We selected significant SNPs with large effects to
search candidate genes in their candidate regions. These
candidate regions were defined by the average LD decay
distance or the LD blocks. The functional annotations of
genes located in the candidate regions were obtained
from the SoyBase database ( />Based on the soybean genomic annotations, potential
candidate genes were predicted.
In addition, for potential candidate genes predicted for
100-SW, qRT-PCR was used to analyze the expression
patterns in extreme materials with large phenotypic
differences. According to the phenotypic data for 100-SW
in the 2017JP and 2016DT environments, the ZDD06067
(24.36 ± 1.67 g) and ZDD20532 (4.55 ± 0.94 g) materials
showed stable and large phenotypic differences. Therefore,
we chose them as the extreme materials and cultivated in
the field. Three replicate biological samples were collected
in liquid nitrogen at four stages during soybean seed development (R3 (Pod 5 mm long at one of the four uppermost nodes on the main stem with a fully developed leaf),
Zhang et al. BMC Genomic Data
(2021) 22:10
R5 (Seed 3 mm long in a pod at one of the four uppermost
nodes on the main stem with a fully developed leaf), R6
(Pod containing a green seed that fills the pod cavity at
one of the four uppermost nodes on the main stem with a
fully developed leaf) and R7 (One normal pod on the main
stem that has reached its mature pod color)), as defined
by Fehr et al. (1971) [62]. Total RNA was extracted from
R3, R5, R6 and R7 seeds using an RNA Simple Total RNA
kit (TIANGEN, China). cDNA was synthesized using a
Prime Script™ RT Reagent Kit (TaKaRa, Japan) with a
standard protocol. The qRT-PCR primers were designed
with Primer Premier 5.0 and were listed in Additional file 4:
Table S2. Gmβ-tubulin was selected as the control gene,
and the qRT-PCR assays were conducted three times
using a Light Cycler 480 instrument. The relative expression levels of the candidate genes were calculated using
the comparative 2−△△CT method [63]. Statistical analyses
were performed with the Student’s t-test.
Abbreviations
QTL: Quantitative trait locus; PH: Plant height; NN: Number of nodes on main
stem; BN: Branch number; DI: Stem diameter; 100-SW: 100-seed weight;
GWAS: Genome-wide association study; SNPs: Single nucleotide
polymorphisms; LD: Linkage disequilibrium; h2: Heritability; ANOVA: Analysis
of variance; BLUP: Best linear unbiased prediction; GLM: General linkage
model; MLM: Mixed linkage model; PCA: Principal component analysis; qRTPCR: Real-time quantitative PCR
Supplementary Information
The online version contains supplementary material available at https://doi.
org/10.1186/s12863-021-00964-5.
Additional file 1: Fig. S1. Average linkage disequilibrium (LD) decay
rate estimated among co-chromosome SNPs.
Additional file 2: Fig. S2. Population structure analysis of 133 soybean
landraces.
Additional file 3: Table S1. Phenotypic data of the four plant
architecture-related traits and 100-SW in the 133 soybean landraces.
Additional file 4: Table S2. Primer sequences for 100-seed weight candidate genes in soybean.
Acknowledgments
We thank Dr. Jianbo He for providing technical assistance in bioinformatics
and for his critical review of the manuscript.
Authors’ contributions
JMZ and HX conceived and designed the experiments. XLZ, WTD, DX and
XNL performed the experiments. XLZ, YZ, JCS, JYF and NG analyzed the data.
LJQ provided the genotype data. XLZ wrote the paper. XLZ, WTD, XNL, HX
and JMZ revised the paper. All authors read and approved the final
manuscript.
Funding
This research was supported by National Key R&D Program of China
(2017YFD0102002), the National Natural Science Foundation of China (Grant
No.32072082), the Province Key R & D Program of Jiangsu (BE2019376,
BE2019425), the Fundamental Research Funds for the Central Universities
(KYZ201811, KYT201801), Modern Agro-industry Technology Research System
of China (CARS-04-PS10), the National Natural Science Foundation of China
(Grant No.31301343), Program for Changjiang Scholars and Innovative Research Team in University (PCSIRT_17R55), Cyrus Tang Innovation Center for
Seed Industry and Jiangsu Collaborative Innovation Center for Modern Crop
Production (JCIC-MCP). The funding bodies played no role in the design of
Page 13 of 14
the study and collection, analysis, and interpretation of data and in writing
the manuscript.
Availability of data and materials
The dataset and materials presented in the investigation are available from
the supplementary tables and Additional file 3.
Declarations
Ethics approval and consent to participate
Not applicable.
Consent for publication
Not applicable.
Competing interests
The authors declare that they have no competing interests.
Author details
1
National Center for Soybean Improvement, Key Laboratory of Biology and
Genetics and Breeding for Soybean, Ministry of Agriculture, State Key
Laboratory for Crop Genetics and Germplasm Enhancement, College of
Agriculture, Nanjing Agricultural University, Nanjing 210095, China. 2The
National Key Facility for Crop Gene Resources and Genetic Improvement
(NFCRI), Key Lab of Germplasm Utilization (MOA), Institute of Crop Science,
Chinese Academy of Agricultural Sciences, Beijing 100081, China.
Received: 13 November 2019 Accepted: 24 February 2021
References
1. Moongkanna J, Nakasathien S, Novitzky WP, Kwanyuen P, Sinchaisri P,
Srinives P. SSR markers linking to seed traits and total oil content in
soybean. Thai J Agric Sci. 2011;44(4):233–41.
2. Liu W, Kim MY, Van K, Lee YH, Li H, Liu X, et al. QTL identification of yieldrelated traits and their association with flowering and maturity in soybean. J
Crop Sci Biotechnol. 2011;14(1):65–70.
3. Cassman KG, Dobermann AR, Walters DT, Yang H. Meeting cereal demand
while protecting natural resources and improving environmental quality.
Annu Rev Environ Resour. 2003;28:315–58.
4. Van Ittersum MK, Cassman KG, Grassini P, Wolf J, Tittonell P, Hochman Z.
Yield gap analysis with local to global relevance-a review. Field Crop Res.
2013;143:4–17.
5. Zhang H, Hao D, Sitoe HM, Yin Z, Hu Z, Zhang G, et al. Genetic dissection of
the relationship between plant architecture and yield component traits in
soybean (Glycine max) by association analysis across multiple environments.
Plant Breed. 2015;134(5):564–72.
6. Pan Q, Xu Y, Li K, Peng Y, Zhan W, Li W, et al. The genetic basis of plant
architecture in 10 maize recombinant inbred line populations. Plant Physiol.
2017;175(2):858–73.
7. Liang H, Li W, Wang H, Fang X. Genetic effects on seed traits in soybean.
Acta Genet Sin. 2005;32(11):1199–204.
8. Sedbrook JC, Phippen WB, Marks MD. New approaches to facilitate rapid
domestication of a wild plant to an oilseed crop: example pennycress
(Thlaspi arvense L.). Plant Sci. 2014;227:122–32.
9. Fang C, Ma Y, Wu S, Liu Z, Wang Z, Yang R, et al. Genome-wide association
studies dissect the genetic networks underlying agronomical traits in
soybean. Genome Biol. 2017;18:161.
10. Kim KS, Diers BW, Hyten DL, Rouf Mian MA, Shannon JG, Nelson RL.
Identification of positive yield QTL alleles from exotic soybean germplasm
in two backcross populations. Theor Appl Genet. 2012;125(6):1353–69.
11. Yao D, Liu Z, Zhang J, Liu S, Qu J, Guan S, et al. Analysis of quantitative trait
loci for main plant traits in soybean. Genet Mol Res. 2015;14(2):6101–9.
12. Lu X, Xiong Q, Cheng T, Li Q, Liu X, Bi Y, et al. A PP2C-1 allele underlying a
quantitative trait locus enhances soybean 100-seed weight. Mol Plant. 2017;
10(5):670–84.
13. Shim S, Kim MY, Ha J, Lee YH, Lee SH. Identification of QTLs for branching
in soybean (Glycine max (L.) Merrill). Euphytica. 2017;213(9):225.
14. Xu Y, Crouch JH. Marker-assisted selection in plant breeding: from
publications to practice. Crop Sci. 2008;48(2):391–407.
Zhang et al. BMC Genomic Data
(2021) 22:10
15. Panthee DR, Pantalone VR, Saxton AM, West DR, Sams CE. Quantitative trait
loci for agronomic traits in soybean. Plant Breed. 2007;126(1):51–7.
16. Li D, Sun M, Han Y, Teng W, Li W. Identification of QTL underlying soluble
pigment content in soybean stems related to resistance to soybean white
mold (Sclerotinia sclerotiorum). Euphytica. 2010;172(1):49–57.
17. Dargahi H, Tanya P, Somta P, Abe J, Srinives P. Mapping quantitative
trait loci for yield-related traits in soybean (Glycine max L.). Breed Sci.
2014;64(4):282–90.
18. Zhang X, Wang W, Guo N, Zhang Y, Bu Y, Zhao J, et al. Combining QTL-seq
and linkage mapping to fine map a wild soybean allele characteristic of
greater plant height. BMC Genomics. 2018;19:226.
19. Gupta PK, Rustgi S, Kulwal PL. Linkage disequilibrium and association
studies in higher plants: present status and future prospects. Plant Mol Biol.
2005;57(4):461–85.
20. Korte A, Farlow A. The advantages and limitations of trait analysis with
GWAS: a review. Plant Methods. 2013;9:29.
21. Atwell S, Huang YS, Vilhjálmsson BJ, Willems G, Horton M, Li Y, et al.
Genome-wide association study of 107 phenotypes in Arabidopsis thaliana
inbred lines. Nat. 2010;465(7298):627–31.
22. Chen W, Gao Y, Xie W, Gong L, Lu K, Wang W, et al. Genome-wide
association analyses provide genetic and biochemical insights into natural
variation in rice metabolism. Nat Genet. 2014;46(7):714–21.
23. Huang X, Wei X, Sang T, Zhao Q, Feng Q, Zhao Y, et al. Genome-wide
association studies of 14 agronomic traits in rice landraces. Nat Genet. 2010;
42(11):961–7.
24. Buckler ES, Holland JB, Bradbury PJ, Acharya CB, Brown PJ, Browne C, et al.
The genetic architecture of maize flowering time. Sci. 2009;325(5941):714–8.
25. Li H, Peng Z, Yang X, Wang W, Fu J, Wang J, et al. Genome-wide
association study dissects the genetic architecture of oil biosynthesis in
maize kernels. Nat Genet. 2013;45(1):43–50.
26. Jia G, Huang X, Zhi H, Zhao Y, Zhao Q, Li W, et al. A haplotype map of
genomic variations and genome-wide association studies of agronomic
traits in foxtail millet (Setaria italica). Nat Genet. 2013;45(8):957–61.
27. Hwang EY, Song Q, Jia G, Specht JE, Hyten DL, Costa J, et al. A genomewide association study of seed protein and oil content in soybean. BMC
Genomics. 2014;15:1.
28. Bandillo N, Jarquin D, Song Q, Nelson R, Cregan P, Specht J, et al. A
population structure and genome-wide association analysis on the USDA
soybean germplasm collection. Plant Genome. 2015;8(3).
29. Wen Z, Tan R, Yuan J, Bales C, Du W, Zhang S, et al. Genome-wide
association mapping of quantitative resistance to sudden death syndrome
in soybean. BMC Genomics. 2014;15:809.
30. Han Y, Zhao X, Cao G, Wang Y, Li Y, Liu D, et al. Genetic characteristics of
soybean resistance to HG type 0 and HG type 1.2.3.5.7 of the cyst
nematode analyzed by genome-wide association mapping. BMC Genomics.
2015;16:598.
31. Vuong TD, Sonah H, Meinhardt CG, Deshmukh R, Kadam S, Nelson RL, et al.
Genetic architecture of cyst nematode resistance revealed by genome-wide
association study in soybean. BMC Genomics. 2015;16:593.
32. Zhang J, Song Q, Cregan PB, Nelson RL, Wang X, Wu J, et al. Genome-wide
association study for flowering time, maturity dates and plant height in early
maturing soybean (Glycine max) germplasm. BMC Genomics. 2015;16:217.
33. Chaudhary J, Patil GB, Sonah H, Deshmukh RK, Vuong TD, Valliyodan B, et al.
Expanding omics resources for improvement of soybean seed composition
traits. Front Plant Sci. 2015;6:1021.
34. Wen Z, Boyse JF, Song Q, Cregan PB, Wang D. Genomic consequences of
selection and genome-wide association mapping in soybean. BMC
Genomics. 2015;16(1):671.
35. Zhang J, Song Q, Cregan PB, Jiang GL. Genome-wide association study,
genomic prediction and marker-assisted selection for seed weight in
soybean (Glycine max). Theor Appl Genet. 2016;129(1):117–30.
36. Diers BW, Specht J, Rainey KM, Cregan P, Song Q, Ramasubramanian V, et al.
Genetic Architecture of Soybean Yield and Agronomic Traits. G3 (Bethesda).
2018;8(10):3367–75.
37. Copley TR, Duceppe MO, O'Donoughue LS. Identification of novel loci
associated with maturity and yield traits in early maturity soybean plant
introduction lines. BMC Genomics. 2018;19:167.
38. Assefa T, Otyama PI, Brown AV, Kalberer SR, Kulkarni RS, Cannon SB.
Genome-wide associations and epistatic interactions for internode number,
plant height, seed weight and seed yield in soybean. BMC Genomics. 2019;
20(1):527.
Page 14 of 14
39. Zhao X, Li W, Zhao X, Wang J, Liu Z, Han Y, et al. Genome-wide association
mapping and candidate gene analysis for seed shape in soybean (Glycine
max)[J]. Crop Pasture Sci. 2019;70(8):684–93.
40. Qi Z, Song J, Zhang K, Liu S, Tian X, Wang Y, et al. Identification of QTNs
controlling 100-seed weight in soybean using multilocus genome-wide
association studies. Front Genet. 2020;11:689.
41. Li X, Zhang X, Zhu L, Bu Y, Wang X, Zhang X, et al. Genome-wide
association study of four yield-related traits at the R6 stage in soybean. BMC
Genet. 2019;20:39.
42. Oz M, Karasu A, Goksoy AT, Turan ZM. Interrelationships of agronomical
characteristics in soybean (Glycine max) grown in different environments. Int
J Agric Biol. 2009;11(1):85–8.
43. Asanome N, Ikeda T. Effect of branch direction's arrangement on soybean
yield and yield components. J Agron Crop Sci. 2010;181(2):95–102.
44. Evans LT, Dunstone RL. Some physiological aspects of evolution in wheat.
Aust J Biol Sci. 1970;23(4):725–42.
45. Sun D, Li W, Zhang Z, Chen Q, Ning H, Qiu L, et al. Quantitative trait loci
analysis for the developmental behavior of soybean (Glycine max L. Merr.).
Theor Appl Genet. 2006;112(4):665–73.
46. Mian MA, Bailey MA, Tamulonis JP, Shipe ER, Carter TE, Parrott WA, et al.
Molecular markers associated with seed weight in two soybean
populations. Theor Appl Genet. 1996;93(7):1011–6.
47. Han Y, Li D, Zhu D, Li H, Li X, Teng W, et al. QTL analysis of soybean seed
weight across multi-genetic backgrounds and environments. Theor Appl
Genet. 2012;125(4):671–83.
48. Pathan SM, Vuong T, Clark K, Lee JD. Genetic mapping and confirmation of
quantitative trait loci for seed protein and oil contents and seed weight in
soybean. Crop Sci. 2013;53(3):765–74.
49. Lee SH, Park KY, Lee HS, Boerma HR. Genetic mapping of QTLs conditioning
soybean sprout yield and quality. Theor Appl Genet. 2001;103(5):702–9.
50. Kato S, Sayama T, Fujii K, Yumoto S, Kono Y, Hwang TY, et al. A major and stable
QTL associated with seed weight in soybean across multiple environments and
genetic backgrounds. Theor Appl Genet. 2014;127(6):1365–74.
51. Shikanai T. RNA editing in plant organelles: machinery, physiological
function and evolution. Cell Mol Life Sci. 2006;63(6):698–708.
52. Bogamuwa S, Jang JC. The Arabidopsis tandem CCCH zinc finger proteins
AtTZF4, 5 and 6 are involved in light-, abscisic acid- and gibberellic acidmediated regulation of seed germination. Plant Cell Environ. 2013;36(8):
1507–19.
53. Chen M, Du X, Zhu Y, Wang Z, Hua S, Li Z, et al. Seed fatty acid reducer acts
downstream of gibberellin signalling pathway to lower seed fatty acid
storage in Arabidopsis. Plant Cell Environ. 2012;35(12):2155–69.
54. Xiong L, Gong Z, Rock CD, Subramanian S, Guo Y, Xu W, et al. Modulation
of abscisic acid signal transduction and biosynthesis by an Sm-like protein
in Arabidopsis. Dev Cell. 2001;1(6):771–81.
55. Labate MTV, Ko K, Ko ZW, Pinto LS, Real MJ, Romano MR, et al. Constitutive
expression of pea Lhcb1-2 in tobacco affects plant development,
morphology and photosynthetic capacity. Plant Mol Biol. 2004;55(5):701–14.
56. Qiu L, Li Y, Guan R, Liu Z, Wang L. Establishment, representative testing and
research progress of soybean core collection and mini core collection. Acta
Agronomica Sinica (in Chinese). 2009;35(4):571–9.
57. Team CR. R: a language and environment for statistical computing.
Computing. 2014;14:12–21.
58. Institute S. Base SAS 9.4 procedures guide: statistical procedures. Chapter. 2014.
59. Sved JA. Linkage disequilibrium and homozygosity of chromosome
segments in finite populations. Theor Popul Biol. 1971;2(2):125–41.
60. Yu J, Pressoir G, Briggs WH, Vroh BI, Yamasaki M, Doebley JF, et al. A unified
mixed-model method for association mapping that accounts for multiple
levels of relatedness. Nat Genet. 2006;38(2):203–8.
61. Cai D, Xiao Y, Yang W, Ye W, Wang B, Younas M, et al. Association mapping
of six yield-related traits in rapeseed (Brassica napus L.). Theor Appl Genet.
2014;127(1):85–96.
62. Fehr WR, Caviness CE, Burmood DT, Pennington JS. Stage of development
descriptions for soybeans, Glycine Max (L.) Merrill. Crop Sci. 1971;11(6):929–31.
63. Livak KJ, Schmittgen TD. Analysis of relative gene expression data using
real-time quantitative PCR and the 2−ΔΔCT method. Methods. 2001;25(4):
402–8.
Publisher’s Note
Springer Nature remains neutral with regard to jurisdictional claims in
published maps and institutional affiliations.