Characterization of grapevine (V. vinifera L.) varieties grown in Yozgat province (Turkey) by simple sequence repeat (SSR) markers
Bạn đang xem bản rút gọn của tài liệu. Xem và tải ngay bản đầy đủ của tài liệu tại đây (2.38 MB, 11 trang )
Turkish Journal of Agriculture and Forestry
Turk J Agric For
(2022) 46: 38-48
© TÜBİTAK
doi:10.3906/tar-2104-75
/>
Research Article
Characterization of grapevine (V. vinifera L.) varieties grown in Yozgat province
(Turkey) by simple sequence repeat (SSR) markers
1,
2
Selda DALER *, Rüstem CANGİ
Department of Horticulture, Faculty of Agriculture, Yozgat Bozok University, Yozgat, Turkey
2
Department of Horticulture, Faculty of Agriculture, Tokat Gaziosmanpasa University, Tokat, Turkey
1
Received: 24.04.2021
Accepted/Published Online: 25.11.2021
Final Version: 09.02.2022
Abstract: The study was conducted to characterise 50 grape varieties grown in Yozgat by molecular methods. Molecular definitions
were realized using 9 simple sequence repeat (SSR) primers (VVS2, VVMD5, VVMD7, VVMD24, VVMD27, VVMD28, VVMD31,
VrZAG62, and VrZAG79), including six microsatellite loci used for grapevine variety collections by the European Union funded project
(GENRES 081), accepted as the minimum standard set (core set) by the world. According to the SSR analysis results, 451 alleles,
233 of which polymorphic, were obtained. The highest allele numbers were designated as 52 in the VVMD7, VVMD24, VVMD27,
VrZAG62, and VrZAG79 loci. The mean number of alleles was recorded as 50.11 (± 1.306), while the average number of polymorphic
alleles was 25.89 (± 1.896). The VVMD28 primer gave the highest number of polymorphic alleles (Na=36). The mean of the expected
heterozygosity (He) value was calculated as 0.932 (± 0.005), while the average of observed heterozygosity (Ho) value was 0.481 (± 0.082).
Polymorphism information content (PIC) values ranged from 0.908 (VVMD31) to 0.955 (VVMD28) with a mean PIC value of 0.927.
The unweighted pair group method with arithmetic average (UPGMA) clustering technique was used to generate the dendrogram.
Population structure analysis results showed that by compatible phylogenetic analysis, the varieties depicted into 2 main clusters. The
genetic similarity rate among the varieties changed to ranging from 0% to 50%. The highest genetic similarity coefficient with a 0.50 was
found between Horoz Üzümü and Karagevrek.
Key words: Characterization, simple sequence repeats, structure analysis, Vitis vinifera L., Yozgat province
1. Introduction
The grapevine is one of the oldest known plant groups of the
earth according to geological findings (Çelik et al., 1998).
Since ancient times, grapes have been used in different ways,
both for table and as processed (black treacle, grape juice,
raisins, wine, vinegar, mash, etc.). Grapes, being extremely
important in terms of human health, contain important
substances, vitamins, proteins, carbohydrates, and minerals,
also flavonoids, proanthocyanidins, and anthocyanidins,
along with phenols and polyphenols such as anthocyanin,
flavanol, flavonol, phenolic acid, caffeic acid, catechin,
quercetin, resveratrol (Xia et al., 2010; Lim, 2013).
The grapevine is a plant belonging to the “Vitaceae”
family of the “Rhamnales” order. All the grape varieties
cultivated in the world are included in the “Vitis” genus,
which is the most significant member of this family,
and most of these varieties are included in the “Euvitis”
subgenus that also inclue the “V. vinifera L.” species as pure
or hybrid (Winkler et al., 1974; Antcliff, 1992).
Of the world’s 10,000 known grapevine varieties
provide more than 95% V. vinifera L. species (Çelik, 2011).
According to the data of FAO 2020, 77.1 million tonnes
of grape production has been conducted on an area of
6.9 million hectares in the world. Turkey ranks 5th with
400,000 hectares (5.85%) in terms of area and ranks 6th with
4.2 million tonnes (5.32%) concerning grape production1
in the world.
The viticulture history of Yozgat, which has been one
of the oldest settlements of Anatolia, dates back to 1800
– 1600 BC, and the archaeological excavations document
that the viticulture and wine culture has a deep-rooted
history in Yozgat and its surrounding (Wilson and Allen,
1937; Oraman, 1965; Çelik, 2011).
In Yozgat, which has a total agricultural area of 1.1
million ha, viticulture activities have been performed on
2.9 thousand hectares areas, and a total of 15.6 thousand
tonnes of grapes (table, seeded) produced2.
1
Food and Agriculture Organization of the United Nations (2021). FAOSTAT [online]. Website [accessed 10.04.2021].
2
Turkish Statistical Institute (2021). TURKSTAT [online]. Website [accessed 05.04.2021].
*Correspondence:
38
This work is licensed under a Creative Commons Attribution 4.0 International License.
DALER and CANGİ / Turk J Agric For
In Yozgat, where the continental climate is dominant,
the common vegetation the steppe. The average altitude
of the province above sea level is approximately 1500 m.
According to climate data between the years 2000 and 2020,
the difference between day and night temperatures has
an average of 15.3 °C. Annually, the average temperature
throughout the city is 11.29 °C, the average temperature
of the summer months is 20.83 °C, the hottest month
average temperature is 22.13 °C, the coldest month average
temperature is –0.46 °C, and the average temperature of
the development period is 16.90 °C.
The effective heat summation of the province is 1,559.69
degree days. However, an average of 89.4 days of the year
is below zero. Frost days have not encountered only in
July in the region, and the development period is limited
to 149.71 days on average. The number of sunny hours
annually is 2 528.29 h, and the average daily sunbathing
time is 6 h 52 min. The average annual rainfall is 411.49
mm, and the distribution of precipitation according to the
seasons is irregular. The annual average relative humidity
is 63.97%. Annually average wind speed 2.61 m / s. The
effective wind direction is northeast, the second dominant
wind direction is north. Also, the local pressure average is
888.36 mbar3.
So far, the most comprehensive study performed
to reveal grapevine genetic resources has been the
“Determination, Conservation and Identification of
Grapevine Genetic Resources (National Collection
Vineyard)” project launched by Tekirdağ Viticulture
Research Institute in 1965, and, with this project, “National
Collection Vineyard” established. Preliminary studies have
given us the idea that Yozgat province may have a richer
grapevine gene potential.
The grapevine genetic resources of Yozgat province
have not been characterised by molecular methods until
now. These varieties, which have been grown in Yozgat
for many years and adapted to the cold climate conditions
of the region, are preferred by the local people and are
consumed fresh and used in the production of local
products. In this research, Autochthonous grape varieties
grown in Yozgat were identified with 9 SSR primers
from molecular methods. The regional grapevine genetic
diversity is a prerequisite for future grapevine – breeding
studies.
Therefore, the works on the determination,
conservation, and management of genetic resources are of
great importance.
2. Materials and methods
2.1. Plant material
This research was conducted on 50 grape varieties
grown in Çandır, Boğazlıyan, Şefaatli, Sarıkaya, and
3
Sorgun districts of Yozgat in 2017–2020. All analyses
on molecular descriptions were performed in Sivas
Cumhuriyet University Advanced Technology Research
and Application Centre. To collect the identity (passport)
information of the varieties, the methods specified in The
International Board for Plant Genetic Resources (IBPGR,
1997) were used. Coordinates and altitudes of varieties
were tagged using the navigation application (Kraus und
Karnath GbR 2Kit Consulting GPS & Maps-v2.8). Identity
(passport) information of the grapevine varieties was
presented in Table 1.
2.2. DNA extraction
As plant material, were used fresh leaves received from the
tip of the shoots (1st and 3rd node) of 50 autochthonous
grape varieties, and two reference varieties (Cabernet
Sauvignon and Merlot).
Isolation of total genomic DNA from leaf samples
received was performed according to the CTAB procedure,
adapted with some modifications of the Doyle and Doyle
(1990) method. The extracted total genomic DNAs were
controlled in both 1% agarose gel electrophoresis and
Nanodrop (Maestrogen, MN-913) to evaluate the quality
and quantity. Checked DNAs were stored at –20 °C for
PCR reactions.
2.3. SSR – PCR reactions
In the research, 9 SSR primers, VVS2 (Thomas and
Scott, 1993), VVMD5, VVMD7 (Bowers et al., 1996),
VVMD24, VVMD27, VVMD28, VVMD31 (Bowers et al.,
1999b), VrZAG62 and VrZAG79 (Sefc et al., 1999) were
used. VVS2, VVMD5, VVMD7, VVMD27, VrZAG62,
and VrZAG79 loci have been accepted as the minimum
standard set (core set) according to international norms
and have been made mandatory to be used in molecular
characterization studies in Vitis species (This et al., 2004).
The other 3 SSRs (VVMD24, VVMD28, and VVMD31)
were also preferred in this study, as they were frequently
included in previous studies for molecular characterisation
and determination of genetic relatedness degrees (Karauz,
2013; Agỹero et al., 2003; Karaaaỗ, 2006; Vouillamoz et
al., 2006; Yıldırım, 2008; Aslantaş, 2010; Yıldırım, 2010).
The forward primers of each locus were marked
fluorescently. Optimal melting (Tm) and binding (Ta)
temperature values for the amplification of SSR loci were
determined by the Gradient PCR approach.
The PCR reaction was performed in a final PCR reaction
volume of 25.125 µL containing 25 – 100 ng DNA, 10 × Taq
buffer (KCl – MgCl2), 25 mM MgCl2, 2.5 mM total dNTP,
10 pmol labelled forward primer, 10 pmol reverse primer,
0.625 U Taq DNA polymerase (5 U / µl) and ddH2O. PCR
conditions of an initial denaturation at 94 °C for 5 min,
followed by 35 cycles at 94 °C for 45 s (denaturation), the
Turkish State Meteorological Service (2020). MGM Reports for the year 2000 – 2020.
39
DALER and CANGİ / Turk J Agric For
Table 1. Identity (passport) information and some berry characteristics of the grapevine varieties.
No
Variety Name
1
2
3
4
5
6
7
8
9
10
11
12
13
14
15
16
17
18
19
20
21
22
23
24
25
26
27
28
29
30
31
32
33
34
35
36
37
38
39
40
41
42
43
44
45
46
47
48
49
50
Cam Üzümü
Kırmızı Bulut
Zilifder
Kara Üzüm
Karanlıkdere Beyazı
Candır Üzümü
Kara Bulut
Çiğitsiz
Mor Üzüm
Gül Üzümü
Eldaş
Ak Üzüm
Dirmit
Sarı Üzüm
Şıralık
Gưk Üzüm
Mis Üzümü
Dağ Karası
Kuş Üzümü
Gelinparmağı
Çavuş
Kabaeldaş
Bozdirge
Baldırıkızıl
Beyaz Patpat
Karaevlek
Mor Patpat
Hevenk
Kưftür
Karaburcu
Şeker Üzümü
Pembe Üzüm
Cafer Üzümü
Kaya Üzümü
Alaca Üzüm
Ekşi Kara
Erik Üzümü
Yerli Kara
Mor Bulut
Göğcek
Şahmuratlı Üzümü
Siyah Üzüm
Köledoyuran
Kirpi Üzümü
Horoz Üzümü
Tatlı Kara
Karagevrek
Misket Üzümü
Parmak Üzümü
Bulut Üzümü
40
OIV 223
OIV 225
Berry: shape
Berry: color of skin
Globose
Globose
Globose
Globose
Globose
Cylindric
Globose
Broad ellipsoid
Globose
Broad ellipsoid
Globose
Globose
Broad ellipsoid
Globose
Globose
Globose
Broad ellipsoid
Broad ellipsoid
Globose
Horn shaped
Broad ellipsoid
Globose
Globose
Broad ellipsoid
Globose
Broad ellipsoid
Broad ellipsoid
Broad ellipsoid
Globose
Globose
Globose
Broad ellipsoid
Broad ellipsoid
Globose
Globose
Globose
Globose
Globose
Globose
Globose
Broad ellipsoid
Broad ellipsoid
Obloid
Obloid
Narow ellipsoid
Globose
Broad ellipsoid
Obloid
Horn shaped
Globose
Green yellow
Dark red violet
Green yellow
Dark red violet
Green yellow
Dark red violet
Dark red violet
Green yellow
Grey
Rose
Green yellow
Green yellow
Dark red violet
Green yellow
Dark red violet
Grey
Green yellow
Dark red violet
Green yellow
Green yellow
Green yellow
Green yellow
Green yellow
Dark red violet
Green yellow
Dark red violet
Dark red violet
Green yellow
Green yellow
Dark red violet
Grey
Rose
Dark red violet
Dark red violet
Dark red violet
Dark red violet
Blue black
Dark red violet
Grey
Green yellow
Green yellow
Dark red violet
Green yellow
Green yellow
Grey
Dark red violet
Dark red violet
Green yellow
Green yellow
Dark red violet
Location
Kozan/Çandır
Kozan/Çandır
Kozan/Çandır
Kozan/Çandır
Kozan/Çandır
Çandır
Çandır
Çandır
Çandır
Çandır
Çandır
Kozan/Çandır
Kozan/Çandır
Kozan/Çandır
Kozan/Çandır
Çandır
Kozan/Çandır
Kozan/Çandır
Çakmak/Boğazlıyan
Çakmak/Boğazlıyan
Çakmak/Boğazlıyan
Çakmak/Boğazlıyan
Çakmak/Boğazlıyan
Çakmak/Boğazlıyan
Cankılı/Şefaatli
Cankılı/Şefaatli
Cankılı/Şefaatli
Cankılı/Şefaatli
Cankılı/Şefaatli
Cankılı/Şefaatli
Cankılı/Şefaatli
Cankılı/Şefaatli
Cankılı/Şefaatli
Cankılı/Şefaatli
Cankılı/Şefaatli
Cankılı/Şefaatli
Cankılı/Şefaatli
Babayağmur/Sarıkaya
Babayağmur/Sarıkaya
Babayağmur/Sarıkaya
Şahmuratlı/Sorgun
Şahmuratlı/Sorgun
Şahmuratlı/Sorgun
Şahmuratlı/Sorgun
Şahmuratlı/Sorgun
Şahmuratlı/Sorgun
Şahmuratlı/Sorgun
Şahmuratlı/Sorgun
Şahmuratlı/Sorgun
Şahmuratlı/Sorgun
Coordinates
Altitude (m)
North
East
39°15’07”
39°15’07”
39°15’06”
39°15’06”
39°15’05”
39°14’39”
39°14’44”
39°14’45”
39°14’38”
39°14’38”
39°14’37”
39°14’55”
39°15’12”
39°15’14”
39°15’01”
39°14’37”
39°15’05”
39°15’15”
39°18’03”
39°18’03”
39°18’03”
39°18’04”
39°19’28”
39°18’04”
39°33’11”
39°33’12”
39°33’12”
39°33’12”
39°33’11”
39°33’10”
39°33’10”
39°33’12”
39°33’11”
39°33’12”
39°33’12”
39°33’11”
39°33’12”
39°22’04”
39°22’03”
39°22’03”
39°44’42”
39°44’43”
39°44’30”
39°44’43”
39°44’33”
39°44’41”
39°44’38”
39°44’37”
39°44’38”
39°44’37”
35°33’16”
35°33’17”
35°33’16”
35°33’17”
35°33’19”
35°31’03”
35°30’54”
35°30’54”
35°31’04”
35°31’03”
35°31’03”
35°32’57”
35°33’22”
35°33’25”
35°33’06”
35°31’02”
35°33’18”
35°33’23”
35°11’26”
35°11’25”
35°11’26”
35°11’27”
35°11’59”
35°11’28”
34°41’15”
34°41’15”
34°41’15”
34°41’15”
34°41’15”
34°41’14”
34°41’13”
34°41’24”
34°41’16”
34°41’16”
34°41’16”
34°41’16”
34°41’16”
35°28’28”
35°28’28”
35°28’37”
35°05’20”
35°05’20”
35°05’27”
35°05’19”
35°05’28”
35°05’19”
35°05’30”
35°05’30”
35°05’31”
35°05’31”
1270
1269
1268
1268
1265
1224
1231
1233
1222
1223
1222
1273
1280
1289
1275
1222
1265
1284
1311
1313
1312
1312
1270
1312
881
872
874
878
881
890
889
870
878
875
872
882
875
1262
1263
1265
1170
1172
1157
1172
1158
1169
1158
1158
1158
1158
DALER and CANGİ / Turk J Agric For
temperature specific to the primer pair for 30 s (annealing);
and 72 °C for 30 s (extension), and a final extension at 72
°C for 3 min gave the best amplification for all the primer
pairs. PCR products belonging to the loci were checked in
a 2% agarose gel electrophoresis environment according
to fragment sizes to determine whether amplification
had occurred. Amplified samples were diluted with 20 µl
SLS (Sample Loading Solution) in different proportions
according to the fluorescent dyes used in labelling (D2,
D3, and D4), and then 0.2 – 0.4 µL the standard – 400
was added. Allele types (homozygous and heterozygous)
and allele sizes (bp) at all loci were analysed with Bioptic
Qsep100 DNA / RNA Fragment Analyzer using a high –
resolution cartridge.
2.4. Data analysis
After genotyping of grape varieties was completed, genetic
diversity and differentiation indices at both population
and locus levels were calculated using GenAIEx 6.51b2
software, according to Nei (1987)’s unbiased genetic
similarity and genetic difference coefficients. Coordinate
graphs based on SSR allele sizes of varieties were created
using GenAIEx 6.51b2 programme.
NTSYSpc v.2.10e programme was used to determine
phylogenetic relationships between loci (Rohlf, 1998).
Genetic Similarity Matrix was calculated according
to the SM (Simple Matching) parameter of Sokal and
Michener (1958). The dendrogram was drawn according
to the SM coefficient based on UPGMA (Unweighted Pair
Group Method with Arithmetic Average). Populations
are structured into genetically distinct subpopulations
(Intarapanich et al., 2009). Analysis of population structure
involves grouping individuals into subpopulations based
on common genetic variations.
The population structure was investigated through
clustering based on the Bayesian model in which the
Markov Chain Monte Carlo (MCMC) algorithm was
applied in Structure v.2.3.4 software (Pritchard et al.,
2000). In this model, a number of populations (K) are
assumed to be present that are characterised by a set of
allele frequencies at each locus. The MCMC process
begins with the random assignment of individuals to a
predetermined number of populations (clusters), then
variable frequencies are estimated in each group, and
individuals are reassigned based on these frequency
estimates. This process involved the burning process that
results in progressive convergence towards reliable allele
frequency estimates in each population and membership
probabilities of individuals to a population. Delta K (ΔK)
method (Evanno et al., 2005) was used in the Structure
Harvester programme to determine the best K cluster
(Earl & von Holdt, 2012). LnP(D) (logarithm probability
for each K) values were calculated, and the logarithm
probability curve L(K) was drawn. The simulations were
created with 10 independent repetitions for each K (the
number of inferred genetic clusters) value ranging from
1 to 10, with a burn-in of 100 000 and 1 000 000 MCMC.
Delta K, based on the second-order ratio of change in
LnP(D), was calculated (ΔK = 2 to ΔK = 10) and the graph
drawn. The information about the probable population
number was shown with the highest K of Delta K in the
diagram.
3. Results
Molecular definitions were performed using 9 SSR loci
on 52 grape varieties, including 50 autochthonous and 2
reference varieties. Allele sizes at all loci were recorded as
peak data in the fragment analysis system.
3.1. Genetic diversity and differentiation in the
population
Genetic diversity and differentiation indices at the
population and locus level were analysed according to the
Hardy – Weinberg equilibrium principle (Table 2). Allele
– frequency plots were created using the Genalex 6.51b2
programme (Figure 1).
3.2. Genetic relationships among grapevine varieties
When the UPGMA dendrogram was examined, it was
observed that the varieties were divided into 2 main
clusters. The varieties showing the highest similar rate in
cluster 1 were Mor Üzüm (No. 9) and Kabaeldaş (No. 22)
with a similarity coefficient of 0.44. Cluster 2 was mainly
divided into 3 subgroups. The 1st subgroup of cluster 2 was
divided into 2 main branches. While the varieties showing
the highest similarity rate were Kuş Üzümü (No. 19) and
Çavuş (No. 21) with a similarity coefficient of 0.44 in the
branch 1, it was determined as Horoz Üzümü (No. 45) and
Karagevrek (No. 47) with a similarity coefficient of 0.5 in
branch 2. In the 2nd subgroup of Cluster 2, Merlot (No.
51), Cabernet Sauvignon (No. 52) and Şahmuratlı Üzümü
(No. 41) in branch 1; Göğcek (No. 40) and Tatlı Kara (No.
46) took place in branch 2. However, Kaya Üzümü (No.
34) and Ekşi Kara (No. 36) grouped separately in the 3rd
subgroup on the dendrogram. These findings indicated
that reference varieties had similar alleles with some
autochthonous varieties, but the Kaya Üzümü and Ekşi
Kara varieties had unique alleles. Consequently, the much
branching of the dendrogram, on which the grapevine
genotypes were visualized, showed that the sample
population had high genetic diversity. The enumerations
of the varieties in the Coordinate Graph (Figure 1) and
UPGMA Dendrogram (Figure 2) were arranged based on
the ranking system presented in Table 1.
3.3. Structure analysis
Structural genetic analysis was performed on 52
grapevine genotypes with 9 SSR primers using Structure
and Structure Harvester programmes. As a result of the
41
DALER and CANGİ / Turk J Agric For
Table 2. Number of alleles (n), number of polymorphic alleles (Na), number of effective alleles (Ne),
Shannon diversity index (I), polymorphism information content (PIC), observed heterozygosity (Ho),
and expected heterozygosity (He) values based on 9 SSR primers used for V. vinifera genotypes.
SSRs
n
Na
Ne
I
PIC
He
Ho
VVS2
51
20
12.657
2.733
0.916
0.921
0.471
VVMD5
49
24
13.084
2.858
0.919
0.924
0.143
VVMD7
52
27
14.696
2.980
0.928
0.932
0.558
VVMD24
52
20
13.287
2.767
0.920
0.925
0.673
VVMD27
52
25
15.234
2.921
0.931
0.934
0.154
VVMD28
40
36
23.188
3.351
0.955
0.957
0.400
VVMD31
51
22
11.612
2.703
0.908
0.914
0.529
VrZAG62
52
25
13.386
2.885
0.920
0.925
0.942
VrZAG79
52
34
20.880
3.264
0.950
0.952
0.462
Total
451
233
138.025
26.461
8.346
8.384
4.331
Mean
50.11
25.89
15.336
2.940
0.927
0.932
0.481
SE
1.306
1.896
1.328
0.076
-
0.005
0.082
48
43
42
3510
PC2(10.71%)
4
44
7
46 40
8
38
51 52
3
37
45
50
41
14
34
12
5
9
1
3023
29
16
20
19
6
47
39
22
33 36
31 49
2 24
25
28
13 27
11
21
17
32
15
26
18
PC1(6.01%)
1
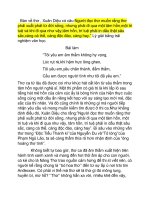
Figure 1. Principal coordinates graph (PCoA) of V. vinifera genotypes. In the graph, two main clusters were
defined, represented by red (cluster 1) and green (cluster 2) coloured points.
analysis, the highest ΔK value corresponding to the most
probable population number was found as 2. Additionally,
ΔK = 3, corresponded to the number of subpopulations in
the study (Figure 3). According to ΔK = 2, both populations
had the admixture of alleles, and no pure line was observed
except for Alaca Üzüm (No. 35), Horoz Üzümü (No.
45) and Tatlı Kara (No. 46) genotypes. In the structure
42
analysis, all the genotypes were divided into two main
clusters similar to UPGMA tree analysis results (Figure
2). Genetic association dendrograms of the varieties were
similar to structural genetic analysis. Furthermore, in ΔK
= 3, genotypes were divided into three subpopulations.
All three subpopulations had mutual alleles inside and
outside of the assigned clusters, with the exception of No.
DALER and CANGİ / Turk J Agric For
1
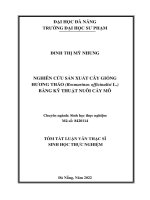
Figure 2. Left: The unweighted pair group method with arithmetic average (UPGMA) clustering pattern. Right:
Results of STRUCTURE (ΔK = 2) analysis of 52 V. vinifera genotypes. Each bar represented an individual, in
which, first and second clusters were presented by red and green, respectively.
25, 39, and 50 in the first subpopulations, No. 10, 35, 45,
46, and 48 in the second subpopulations, No. 19, 21, and
32 in the third subpopulations. In the structure analysis
(Figure 4), each individual was represented by a single
vertical bar divided into coloured tabs according to their
estimated membership in subpopulations 2 to 10. It was
the probability of those assigned to any set K on the Y-axis.
The black line separates the varieties from each other. In
43
DALER and CANGİ / Turk J Agric For
1
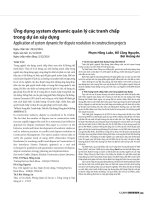
Figure 3. Value of ΔK, that the rate of change in the log probability of data between
successive K values, as described by Evanno et al. (2005), estimated for the structure
analysis of V. vinifera genotypes (ΔK = 2 populations and ΔK = 3 subpopulations).
the Structure analysis (Figure 4), the numbering of the
varieties was arranged according to the ranking system
given in Table 1.
4. Discussion
4.2. SSR polymorphism
Microsatellites (simple sequence repeats, SSRs) have been
the most commonly used genetic marker in population
genetics over the past 20 years (Vieira et al., 2016). SSRs,
have been preferred due to their codominant structure,
abundance in the genome, show high polymorphism,
suitability for automation, and reproducibility (Kacem
et al., 2017). Additionally, SSRs are widely utilised in
grapevine genetic studies for the identification of varieties
(Sefc et al., 1999; Martin et al., 2003; Ibañez et al., 2003),
parentage analysis (Bowers and Meredith 1997; Bowers
et al., 1999a), genome mapping (Doligez et al., 2002; Riaz
et al., 2004) and genetic characterisation of germplasm
(Lopes et al., 1999; Sefc et al., 1999). In this context,
various studies have been carried out to determine the
molecular characterization and genetic relatedness of
locally distributed autochthonous grapevine genotypes
based on SSR markers (Hızarcı, 2010; Karaca - Sanyürek,
2014; Ovayurt, 2017). As a result of our research, 451 alleles
(n), 233 of which polymorphic (Na), were obtained. The
highest number of alleles was 52 at the VVS2, VVMD24,
VVMD27, VrZAG62, and VrZAG79 loci. The lowest
number of alleles was determined as 40 at the VVMD28
44
locus, the average number of alleles 50.11 (± 1.306),
and the average number of polymorphic alleles 25.89 (±
1.896). The number of alleles obtained according to the
results of population genetics was considerably high. Our
results showed that the grapevine population in Yozgat
is genetically heterogeneous. Karaca – Sanyürek (2014)
obtained 61 alleles because of genetic analysis performed
with 6 SSR loci of 54 grape varieties and she found the
highest number of alleles as 12 in the VVMD5 locus. In
our study, the number of effective alleles (Ne) varied from
11.612 (VVMD31) to 23.188 (VVMD28). The average
effective allele numbers as 15.336 (± 1.328) were found to
be lower than the mean allele numbers. In our research,
expected heterozygosity (He) values were in the range
of 0.914–0.957, the observed heterozygosity (Ho) ratios
varied between 0.143 and 0.942. The average expected
heterozygosity (He) value was calculated as 0.932 (±
0.005) and the average observed heterozygous (Ho) value
0.481 (± 0.082). The expected heterozygosity (He) value
at the VVMD28 (0.957) and VrZAG79 (0.952) loci and
the observed heterozygosity (Ho) value at the VrZAG62
(0.942) and VVMD24 (0.673) loci were highest. In our
study, the expected heterozygosity values were found to
be higher than the heterozygosity values observed in 8
loci. Gök Tangolar et al. (2009) determined the average
observed heterozygosity as (Ho) 0.743 and expected
heterozygosity 0.749. According to the data we obtained
from our study, polymorphism information content (PIC)
DALER and CANGİ / Turk J Agric For
K=10
K=9
K=8
K=7
K=6
K=5
K=4
K=3
K=2
1
Figure 4. Population structure of 52 V. vinifera genotypes estimated from 9 SSRs using structure (ΔK = 2 to 10). Each
bar represented an individual, in which, different color represents the estimated membership coefficients.
value varied between the highest 0.955 (VVMD28) and
the lowest 0.908 (VVMD31), and the average PIC values
of all loci were found to be 0.927. The Shannon diversity
index (I) was observed at the highest VVMD28 locus
(3.351) and the lowest VVMD31 locus (2.703). Taheri
and Ramandi (2020) reported that because of the genetic
analysis of 25 local grapevine accessions with 14 SSR
markers, the PIC value varied between 0.50 and 0.87, and
45
DALER and CANGİ / Turk J Agric For
the Shannon diversity index varied between 0.79 and 2.13.
In our research, allele frequencies ranged between 0.01 and
0.184. When the allele – frequency distribution ratios in the
loci were examined, it was observed that it varies between
0.01 and 0.184. 244 with 0.184 allele frequency at VVMD5
locus, 212 with 0.167 allele frequency at VVMD31 locus,
and 193 with 0.163 allele frequency at VrZAG62 locus were
the most common alleles. Hızarcı (2010) according to the
distribution of alleles in loci the highest allele frequencies
values determined in the loci VrZAG83 (191), VVMD27
(185), VVMD24 (207) and VVMD7 (246).
4.3. Genetic relationships among grapevine varieties
According to the results of phylogenetic analysis, similarity
coefficients among varieties ranged from 0 to 0.50. The
varieties showing the highest similarity with 0.50 were
Horoz Üzümü (No. 45) and Karagevrek (No. 47). The
varieties were divided into two main clusters according to
the genetic relationship dendrogram. Cluster 1 revealed
less genetic diversity than cluster 2 that showed a wider
range of genetic variation, including unique alleles. In
the 2nd subgroup of cluster 2, it was determined that the
Merlot (No. 51) and Cabernet Sauvignon (No. 52) branched
together with some autochthonous varieties (No. 40, 41, and
46). In many studies using Merlot and Cabernet Sauvignon
as reference varieties, it was determined that the reference
varieties were clustered separately with the autochthonous
varieties (Garğin, 2014; Karaca - Sanyürek, 2014; Ovayurt,
2017). However, similar to our findings, Hızarcı et al. (2012),
in their study examining the genetic characterisation and
relatedness levels of autochthonous grapevine varieties
in Northeast Turkey with SSR loci, determined that two
reference varieties (Cabernet Sauvignon and Merlot)
and two autochthonous varieties (Mandagözü and Beyaz
Istanbul) were in the same subgroup. The grouping
of European and Turkish autochthonous grapevine
populations together indicates that the grapevine from the
Yozgat region could have originated from a common genetic
background with reference varieties. In addition to these,
in the 3rd subgroup of the 2nd cluster, it was determined
that Kaya Üzümü (No. 34) and Ekşi Kara (No. 36) varieties
were clustered separately on the dendrogram. These high
levels of within-group variation observed probably suggest
a complex history of the development of grapevine varieties
in Yozgat. Our data suggested that these varieties grouped
separately might have originated from the Transcaucasia
region and introduced through routes like trade or human
migration. Similarly, Hızarcı et al. (2012) reported that one
of the grapevine varieties they collected from Northeast
Turkey clustered separately on the dendogram and that this
variety might have been brought to the Çoruh Valley from
the island of Cyprus and preserved its genetic structure
there. According to the results of the research, 100%
similarity synonymous varieties were not found among
analysed varieties in the population under study. The Basic
46
Coordinates Analysis (PCoA) showed that according to
the codominant genotypic distance method, 31.89% of
the cumulative variation for 52 grapevine genotypes was
explained in the first three coordinates (Figure 1). However,
it was observed that some genotypes spread out of the main
clusters. Emanuelli et al. (2013) analysed 2 273 accessions of
Vitis vinifera spp. sativa and their wild relatives (V. vinifera
ssp. sylvestris) using 22 microsatellite loci based on genetic
distance matrix. They reported that PCoA was explained in
the first and second axes with rates of 38.51% and 21.29%,
respectively.
Structural analysis has many applications in population
genetic studies and is highly informative for understanding
genetic diversity (Eltaher et al., 2018). This analysis is
used to obtain a clear insight into the underlying genetic
population substructure and is a crucial prerequisite
for any analysis of genetic data, such as genome-wide
association studies, to eventually reduce false-positive
rates (Alhusain and Hafez, 2018). It also provides more
information for selecting genetically different varieties for
future hybridisation programmes (Olukolu et al., 2012).
According to our research results, ΔK criteria proposed
by Evanno et al. (2005) reached the maximum value at
K=2, which corresponded to the most probable number
of populations in the study. The dendrograms of these
varieties’ relationships were similar to the structural genetic
analysis (Figure 2). Similar to our research results, Bakker
et al. (2009) analyzed 179 individuals from B. distachyon, B.
hybridum, and B. stacei species with 12 microsatellite loci
using structure software and found ΔK=2 indicating two
geographic clusters.
5. Conclusion
This article has proven once again that microsatellite
analysis is a powerful tool for the characterization of
grapevine varieties. Thanks to this study, which has been
the first to identify comprehensively the grapevine genetic
resources grown in Yozgat province by verifying with
molecular techniques, significant variations have been
revealed among the varieties. With this research, it has
been observed that there was a significant amount of genetic
variation in the gene pool of grape varieties grown in Yozgat
province. Considering the environmental conditions of the
Yozgat, it has been expected that the grapevine germplasm
in the region would have economically important adaptive
traits that can potentially be incorporated into grapevine
breeding programs. The studies performed on germplasm
characterisation are essential for effective hybridisation
programmes in the future.
Acknowledgement
The authors thank Tokat Gaziosmanpaşa University
Scientific Research Projects Unit (Project No. 2019/08) for
its financial support.
DALER and CANGİ / Turk J Agric For
References
Agüero CB, Rodrígez JG, Martinez LE, Dangl GS, Meredith CP (2003).
Identity and parentage of torrontes cultivars in Argentina.
American Journal of Enology and Viticulture 54(4): 318-321.
Evanno G, Regnaut S, Goudet J (2005). Detecting the number of
clusters of individuals using the software STRUCTURE: a
simulation study. Molecular Ecology 14: 2611-2620.
Alhusain L, Hafez AM (2018). Nonparametric approaches for
population structure analysis. Human Genomics 12: 25.
Garğın S (2014). Researches on some grape varieties of Eğirdir region
for ampelographic-moleculer identification and determination
of phenolic compositions yield and quality traits. PhD, Ege
University, İzmir, Turkey (in Turkish with an abstract in
English).
Antcliff AJ (1992). Taxonomy-the Grapevine as a member of the plant
kingdom. Viticulture 1: 107-117.
Aslantaş Ş (2010). Molecular characterization of the Western
Mediterranean grapevine germplasm and genetic relationship
with country grapevine germplasm resources. MSc, Ankara
University, Ankara, Turkey (in Turkish with an abstract in
English).
Bakker EG, Montgomery B, Nguyen T, Eide K, Chang J et al. (2009).
Strong population structure characterizes weediness gene
evolution in the invasive grass species Brachypodium distachyon.
Molecular Ecology 18: 2588-2601.
Bowers JE, Dangl GS, Vignani R, Meredith CP (1996). Isolation and
characterization of new polymorphic simple sequence repeat
loci in grape (Vitis vinifera L.). Genome 39: 628-633.
Bowers JE, Meredith CP (1997). The parentage of a classic wine grape,
Cabernet Sauvignon. Nature Genetics, 16: 84-87.
Bowers JE, Boursiquot JM, This P, Chu K, Johansson H et al. (1999a).
Historical Genetics: The parentage of Chardonnay, Gamay, and
other wine grapes of Northeastern France. Science 285: 15621565.
Gök Tangolar S, Soydam S, Bakr M, Karaaaỗ E, Tangolar S et al.
(2009). Genetic analysis of grapevine cultivars from the Eastern
Mediterranean Region of Turkey, based on SSR markers. The
Journal of Agricultural Science 15: 1-8.
Hızarcı Y (2010). Description of ampelographical characteristics and
determine genetic relationships by using SSR markers among
grapevine cultivars grown in Yusufeli district. PhD, Atatürk
University, Erzurum, Turkey (in Turkish with an abstract in
English).
Hizarci Y, Ercişli S, Yüksel C, Ergül A (2012). Genetic characterization
and relatedness among autochthonous grapevine cultivars
from Northeast Turkey by Simple Sequence Repeats (SSR).
Journal of Applied Botany and Food Quality 85: 224−228.
Ibañez J, De Andres MT, Molino A, Borrego J (2003). Genetic
study of key Spanish varieties using microsatellites analysis.
American Journal of Enology and Viticulture 54: 22-30.
IBPGR (1997). Descriptors for Grapevine (Vitis spp.). Italy, Rome:
International Board for Plant Genetic Resources Institute Press.
Bowers JE, Dangl GS, Meredith CP (1999b). Development and
characterization of additional microsatellite DNA markers for
grape. American Journal of Enology and Viticulture 50: 243246.
Intarapanich A, Shaw PJ, Assawamakin A, Wangkumhang
P, Ngamphiw C et al. (2009). Iterative pruning PCA
improves resolution of highly structured populations. BMC
bioinformatics 10: 382.
Çelik H, Ağaoğlu YS, Fidan Y, Marasalı B, Söylemezoğlu G (1998).
Genel Bağcılık. p. 253. Ankara, Türkiye (in Turkish).
Kacem NS, Muhovski Y, Djekoun A, Watillon B (2017). Molecular
characterization of genetic variation in somaclones of durum
wheat (Triticum durum Desf) using SSR markers. European
Scientific Journal 13: 426-437.
Çelik S (2011). Bağcılık (Ampeloloji). p. 428. Tekirdağ, Türkiye (in
Turkish).
Doligez A, Bouquet A, Danglot Y, Lahogue F, Riaz S et al. (2002).
Genetic mapping of grapevine (Vitis vinifera L) applied to
detection of QTLs for seedlessness and berry weight. Theoretical
and Applied Genetics 105: 780-795.Doyle JJ, Doyle JL (1990).
Isolation of plant DNA from fresh tissue. Focus 12: 13-15.
Earl DA, von Holdt BM (2012). STRUCTURE HARVESTER: A
website and program for visualizing STRUCTURE output and
implementing the Evanno method. Conservation Genetics
Resources 4: 359-361.
Eltaher S, Sallam A, Belamkar V, Emara HA, Nower AA et al. (2018).
Genetic diversity and population structure of F3:6 Nebraska
winter wheat genotypes using genotyping-by-sequencing.
Frontiers in Genetics 9: 76.
Emanuelli F, Lorenzi S, Grzeskowiak L, Catalano V, Stefanini M et al.
(2013). Genetic diversity and population structure assessed by
SSR and SNP markers in a large germplasm collection of grape.
BMC Plant Biology 13: 39. doi: 10.1186/1471-2229-13-39.
Karaaaỗ E (2006). molecular analysis of grapevine germplasm by
SSR (Simple Sequence Repeats) marker in Gaziantep province.
PhD, Ankara University, Ankara, Turkey (in Turkish with an
abstract in English).
Karaca – Sanyürek N (2014). Determination of the ampelographic
characters by clasiccal methods and SSR markers of grape
varieties grown in Tunceli province. PhD, Ankara University,
Ankara, Turkey (in Turkish with an abstract in English).
Karauz A (2013). The parental analysis of grape cultivar released by
crossbreeding and the selection of seedless individuals based
on marker assisted selection. PhD, Namık Kemal University,
Tekirdağ, Turkey (in Turkish with an abstract in English).
Lim TK (2013). Edible medicinal and non-medicinal plants. Volume
6, Fruits. Vitaceae 450-482.
Lopes MS, Sefc KM, Eiras Dias E, Steinkellner H, Laimer Da
Câmara Machado M et al. (1999). The use of microsatellites for
germplasm management in a Portuguese grapevine collection.
Theoretical and Applied Genetics 99: 733-739.
47
DALER and CANGİ / Turk J Agric For
Martin JP, Borrego J, Cabello F, Ortiz JM (2003). Characterization
of Spanish grapevine cultivar diversity using sequence-tagged
microsatellite site markers. Genome 46: 10–18.
Nei M (1987). Molecular evolutionary genetics. New York, ABD:
Columbia University Press. p. 512.
Olukolu BA, Mayes S, Stadler F, Ng NQ, Fawole I et al. (2012).
Genetic diversity in Bambara groundnut (Vigna subterranea
(L.) Verdc.) as revealed by phenotypic descriptors and DArT
marker analysis. Genetic Resources and Crop Evolution 59:
347–358.
Oraman MN (1965). Arkeolojik buluntuların ışığı altında Türkiye
bağcılığının tarihỗesi ỹzerinde aratrmalar-I. Ankara
ĩniversitesi Ziraat Fakỹltesi Yll. Ankara, Tỹrkiye: 15(2): pp.
96-108 (in Turkish).
Ovayurt Ç (2017). Viticulture in Kirsehir and determination of grape
cultivars grown in Kirsehir province by classical ampelographic
characters and SSR markers. MSc, Ankara University, Ankara,
Turkey (in Turkish with an abstract in English).
Pritchard JK, Stephens M, Donnelly P (2000). Inference of population
structure using multilocus genotype data. Genetics 155: 945959.
Riaz S, Dangl GS, Edwards KJ, Meredith C (2004). A microsatellite
marker-based framework linkage map of Vitis vinifera L.
Theoretical and Applied Genetics 108: 864-872.
Rohlf FJ (1998). NTSyS-p.c. Numerical taxonomy and multivariate
analysis system (Version 2.0). Setauket, New York, ABD: Exeter
Software Publishers Ltd.
Sefc KM, Regner F, Turetschek E, Gloessl J, Steinkellenr H (1999).
Identification of microsatellite sequences in Vitis riparia and
their applicability for genotyping of different Vitis species.
Genome 42: 367-373.
Sokal RR, Michener CD (1958). A statistical method for evaluating
relationships. The University of Kansas science bulletin 38:
1409-1448.
Taheri F, Ramandi HD (2020). Microsatellite markers analysis for
the genetic characterization and relationships among some
of Iranian local grapevine accessions (Vitis Vinifera L.).
International Journal of Fruit Science 20 (2): 387-404.
48
This P, Jung A, Boccacci P, Borrego J, Botta, R et al. (2004).
Development of a standard set of microsatellite reference
alleles for identification of grape. Theoretical and Applied
Genetics 109 (7): 1448-1458.
Thomas MR, Scott NS (1993). Microsatellite repeats in grapevine
reveal DNA polymorphisms when analysed as sequencetagged sites (STSs). Theoretical and Applied Genetics 86: 985990.
Vieira MLC, Santini L, Diniz, AL, Munhoz, CF (2016). Microsatellite
markers: What they mean and why they are so useful. Genetics
and Molecular Biology 39 (3): 312-328.
Vouillamoz JF, McGovern PE, Ergül A, Söylemezoğlu G, Tevzadze
G et al. (2006). Genetic characterization and relationships of
traditional grape cultivars from Transcaucasia and Anatolia.
Plant Genet Resources: Characterization &Utilization 4 (2):
1448-1458.
Wilson JA, Allen TG (1937). Researches in Anatolia-the Alishar
Hüyük by Hans HenningVon Der Osten, Seasons of 1930-32,
Volume VIII, Part II. Chicago, ABD: The University of Chicago
Oriental Institute Press.
Winkler AJ, Cook JA, Kliwer WM, Lider LA (1974). General
viticulture. Berkeley and Los Angeles, CA, ABD: University of
California Press. p. 710.
Xia EQ, Deng GF, Guo YJ, Li HB (2010). Biological activities of
polyphenols from grapes. International Journal of Molecular
Sciences 622-646.
Yıldırım F (2008). Genetic characterization of Ankara and Çankırı
grapevine germplasm based on SSR markers. MSc, Ankara
University, Ankara, Turkey (in Turkish with an abstract in
English).
Yıldırım N (2010). Characterization of kara (siyah) üzüm groups
based on SSR (Simple Sequence Repeat) markers and genetic
relations of these cultivars and national grapevine germplasms.
MSc, Ankara University, Ankara, Turkey (in Turkish with an
abstract in English).