question financial statement analysis
Bạn đang xem bản rút gọn của tài liệu. Xem và tải ngay bản đầy đủ của tài liệu tại đây (114.16 KB, 9 trang )
Financial Statement Analysis
Question No 1:
Using the Following information, complete the balance sheet
Long term debt to equity .5 to 1
Total Asset Turnover 2.5 times
Average Collection Period 18 days
Inventory turnover 9 times
Gross Profit margin 10%
Acid-test ratio 1 to 1
Cash $ Notes and payables $ 100,000
Accounts Recievable $ Long-term debt $
Inventory $ Common stock $ 100,000
Plant and Equipment $ Retained earnings $ 100,000
Total Assets
Total Liabilities and
shareholders equity
Question No 2
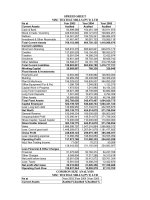
Kedzie Kord Company had following balance sheets and income statements over the last three years
20X1 20X2 20X3
Cash $561.00 $387.00 $202.00
Recievables $1,963.00 $2,870.00 $4,051.00
Inventories $2,031.00 $2,613.00 $3,287.00
Current Assets $4,555.00 $5,870.00 $7,540.00
Net fixed assets $2,581.00 $4,430.00 $4,364.00
Total assets $7,136.00 $10,300.00 $11,904.00
Payables $1,862.00 $2,944.00 $3,613.00
Accruals $301.00 $516.00 $587.00
Bank loan $250.00 $900.00 $1,050.00
Current liabilities $2,413.00 $4,360.00 $5,250.00
Long-term debt $500.00 $1,000.00 $950.00
shareholders equity $4,223.00 $4,940.00 $5,704.00
Total Liabilities and
shareholders equity $7,136.00 $10,300.00 $11,904.00
Sales $11,863.00 $14,952.00 $16,349.00
COGS $8,537.00 $11,124.00 $12,016.00
Selling, general
and admin expense $2,276.00 $2,471.00 $2,793.00
interest $73.00 $188.00 $200.00
Profit before tax $977.00 $1,169.00 $1,340.00
taxes $390.00 $452.00 $576.00
profit after tax $587.00 $717.00 $764.00
Using common-size and percentage analysis, evaluate trends in the company's financial condition and
performance
Question No 3
The data for various companies in the same industry are as follows
Company
A B C D E F
Sales (in millions)
$
10.00
$
20.00
$8.00
$5.00
$12.00
$17.00
Total assets (in millions)
$
8.00
$
10.00
$6.00
$2.50
$
4.00
$
8.00
Net income (in millions)
$
0.70
$
2.00
$0.80
$0.50
$
1.50
$
1.00
Determine the total asset turnover, net profit margin, and earning power for
each of the companies
Question No 4
Cordillera Carson Company has the following balance sheet and income statement for 20X2 (in thousands)
Balace Sheet Income Statement
Cash $ 400.00 Net sales (all credit)
$
12,680.00
Accounts Recievable $ 1,300.00 Cost of goods sold
$
8,930.00
Inventories $ 2,100.00 Gross profit
$
3,750.00
Current Assets $ 3,800.00
selling, general and admin
expense $ 2,230.00Net Fixed Assets $ 3,320.00
Total Assets $ 7,120.00 Interest expense $ 460.00
Profit before taxe
$
1,060.00
Account Payable $ 320.00 Taxes $ 390.00
Accruals $ 260.00 Profit after taxes $ 670.00
Short term loans $ 1,100.00
Current liabilities $ 1,680.00
Long-term debt $ 2,000.00
Net worth $ 3,440.00
Total Liabilities and shareholders equity $ 7,120.00
On the basis of this information, compute (a) the current ratio, (b) the acid test ratio, ( c) the average collection period,
(d) the inventory turnover ratio, (e) the debt to net worth ratio, (f) the long term debt to equity ratio, (g) gross profit
margin, (h) the net profit margin, and (i) the return on equity
Question No 5
the following information is available on the Vanier Corporation:
BALANCE SHEET AS OF DECEMBER 31, 20X6 (in thousands)
Cash and marketable securities $ 500.00 Accounts payable
$
400.00
Accounts receivable ? Bank loan ?
Inventories ? Accruals
$
200.00
Current Assets ? Current liabilities ?
Long-term debt
$
2,650.00
Net fixed assets ?
common stock and
retained earnings
$
3,750.00
Total assets ? Total liabilities and equity ?
INCOME STATEMENT FOR 20X6
(in thousands)
Credit sales $ 8,000.00
COGS ?
Gross profit ?
selling and admin expense ?
Interest Expense $ 400.00
Profit before Taxes ?
Taxes (44% rate) ?
Profit after taxes ?
OTHER INFORMATION
Current ratio 3 to 1
Depreciation $ 500.00
Net profit margin 7%
Total liabilities. Shareholders equity 1 to 1
Average collection period 45 days
inventory turnover ratio 3 to 1
Assuming that sales and production are steady through out a 360-day year, complete the balance sheet and
income statement for the Vanier Corporation
Q. Playbus Ltd is a company established a few years ago to operate a small chain of retail toy
shops in Wales. The chain was built up from the original shop by the present owners who
continue to manage the business, but due to serious illnesses are considering putting the
company on the market.
Extracts from the accounts of Playbus Ltd for each of the past two years ended 30 September
2002 are as follows:
Profit and Loss Account for the year ended 30 September
2002 2001
£'000 £'000
Turnover 15,000 12,000
Cost of Sales (9.500) (7.000)
Gross Profit 5,500 5,000
Administrative Expenses (3,200) (2,900)
Interest (300) (100)
Profit before taxation 2,000 2,000
Taxation (1.000) (600)
Profit after Taxation 1.000 1400
Balance Sheet as at 30lh September
2002 2001
£'000 £'000
Fixed Assets 4,400 2,000
Current Assets
Stock 1500 1,000
Debtors 800 500
Cash 3.300 3.500
5,600 5,000
Creditors due within one year (2.000) 3.600 (1,500) 3,500
8,000 5,500
Long-term liabilities (2,500) (1,000)
5,500 4,500
Share Capital (£1 ordinary shares) 1,000 1,000
Retained profit 4,500 3,500
5,500 4,500
Cash Flow Statement for the year ended 30 September
2002 2001
£'000 £'000
Net cash inflow from operations 1,650 1,600
Servicing of Finance
Interest paid (250) (100)
Taxation paid (600) ((1,000)
Capital Expenditure
Purchase of buildings (1,800) -
(700) -
Increase in loan 1,500 1,000
(Decrease)/ Increase in cash (200) 1,500
Childplay plc has a much larger chain of retail toy outlets and is looking to expand. An
expansion either into Wales or into the North East would make a good strategic fit.
Childplay has already done a financial analysis of another potential takeover target, Greattoys
pic, which is quoted on the AIM market and is located in the North East.
Grealtoys shares are quoted with a price giving a Price Earnings ratio (PER) of 12X whilst the
average PER for the retail sector companies trading in similar products is
16X. Childplay has a PER of 20X.
The following financial statistics have been obtained for Greattoys for the same pair of time
periods as Playbus.
Greattoys Plc Ratios
2002 2001
Profitability
Annual average sales growth
over 5 years 34% 35%
Sales growth over previous year 30% 30%
Return on capital employed 30% 28%
Return on sales 15% 14%
Asset turnover 2x 2x
Return on equity 40% 40%
Earnings per share £0.80 £0.60
Liouiditv
Current ratio 2.0x 2.2x
Quick ratio 0.7x 0.8x
Quality of profit 120% 115%
Efficiency
Debtors period 15days 15days
Stock period 70days 65days
Capital Structure
Long-term debt/Equity 60% 60%
Total debt of Total assets 50% 45%
Interest cover 4x 4x
Playbus' annual average sales growth for the past 5 years in 2002 was 30%, which was lower
than in 2001 when it was 35 %. The sales growth from 2001 to 2002 was 25%.
Required
(a) Compute values for each year for not more than 10 ratios for Playbus which should be
used in your report in answer to (b) below.
(15 marks)
(b) Write a report for Childplay plc advising them on which of the two companies, Playbus
or Grealtoys, purely on financial grounds, would make the beuer takeover target. Use the
values computed in (a) and the other information provided in the question. Mention some
other pieces of information that are not available in the question, but which would be
useful to obtain to aid your deliberations.
(10 marks)
Q. The following information is available on the Shahnawaz Company:
Balance Sheet as of December 31, 20X6(In thousands)
Cash and marketable
securities
Accounts Receivable
Inventory
Current Assets
Net Fixed Assets
Rs,5,000
?
?
?
?
Accounts payable
Bank loan
Accruals
Current Liabilities
Long-term debt
Common Stock and
Retained earnings
Rs.4,000
?
2,000
?
26,500
37,500
Total Assets ? Total Liabilities and
Shareholders’ equity
?
INCOME Statement for 20X6 (In thousands)
Credit Sales
Cost of Goods sold
Gross Profit
Selling and admin expense
Interest expense
Profit Before taxes
Taxes(30%)
Profit After Tax
Rs.100,000
_______?
?
?
____4,000
?
_______?
?
Current Ratio
Depreciation
Net profit margin
Total liabilities/shareholders’
equity
Average collection period
Inventory turnover ratio
3 to 1
Rs.500
7%
1 to 1
45 days
3 to 1
Assume that sales and production are steady throughout a 360-day year; complete the balance
sheet and income statement for Shah Sahib Company. (15)