McElwee 2008 household socioeconomic influencing forest use - Các yếu tố kinh tế xã hội ảnh hưởng đến các hộ gia đình sử dụng rừng.
Bạn đang xem bản rút gọn của tài liệu. Xem và tải ngay bản đầy đủ của tài liệu tại đây (581.95 KB, 13 trang )
Environmental Conservation 35 (2): 147–159 © 2008 Foundation for Environmental Conservation doi:10.1017/S0376892908004736
Forest environmental income in Vietnam: household socioeconomic
factors influencing forest use
PAMELA D. MCELWEE
School of Global Studies, Arizona State University, PO Box 875102, Tempe AZ 85287-5102, USA
Date submitted: 20 October 2007; Date accepted: 20 April 2008
SUMMARY
Much research has focused on understanding the
importance of forest environmental income in differ-
ent communities and highlighting key socioeconomic
characteristics of forest-dependent households. This
paper examines the economic importance of forests
among rural agriculturalists in Vietnam. Data were
collected through a questionnaire survey of 104
households in five study villages in Ha Tinh province in
north central Vietnam surrounding the Ke Go Nature
Reserve (KGNR). Variables such as migration status
of the household, age, income class and landholdings
were used to identify characteristics of households
with high forest income in both absolute and relative
terms. More than half of households reported receiving
forest environmental income in cash. Socioeconomic
variables were compared between forest cash income
(FCI) households and non-FCI households. Non-FCI
households had more alternative income sources from
wage labour and livestock, while FCI households were
significantly younger, tended to live closer to the
forest and had larger landholdings. Contrary to other
research onforest use,the households deriving the most
forest income in both absolute and relative terms were
not the poorerhouseholds, but those in the middle class.
These findings highlight the need for conservation and
development projects to pay attention to the specific
household factors that influence forest use, rather than
relying on assumptions that poverty and forests are
always linked.
Keywords: forest environmental income, household liveli-
hoods, non-timber forest products, poverty, Vietnam
INTRODUCTION
The world trade in non-timber forest products (NTFPs)
(for example forest fruits, medicines, aromatics and resins)
is worth billions of dollars (Iqbal 1993). Many have advocated
that NTFPs and other forms of forest products be promoted
to provide increased income opportunities for forest dwellers
∗
Correspondence: Dr Pamela McElwee Tel: +1 480 727 0736 Fax:
+1 480 727 8292 e-mail:
and users (Counsell & Rice 1992; Wollenberg & Ingles
1998). However, the initial optimism that the twin goals
of conservation and economic development could be linked
through NTFP extraction seems to have diminished (Ruiz-
P
´
erez & Arnold 1996; Arnold & Ruiz-P
´
erez 2001). There have
been naive assumptions behind many marketing plans, and
historical trends in NTFP use indicate that negative outcomes
are common (Gray 1990, Dove 1993).
However, many millions of households continue to harvest
forest products to enhance their livelihoods (Byron & Arnold
1999). Better understanding of why some households harvest
forest goods while others do not may help explain some of the
problems encountered in NTFP promotion, such as whether
the poor or rich are more likely to benefit from commer-
cialization schemes (Neumann & Hirsch 2000; Marshall et al.
2003; Belcher et al. 2005). Recent research has highlighted key
socioeconomic characteristics of forest-dependent households
that can play roles in explaining forest use. For example,
in a study in the Philippines, elderly people were more
likely to collect forest goods because of their more extensive
knowledge of forest plants and wildlife (Lacuna-Richman
2002). Elsewhere, younger households are more dependent on
wild-collected products, as they set out to start families and
have lower agricultural assets than older better-established
households (Coomes et al. 2004; McSweeney 2004).
Another key variable of interest is the relationship between
income and forest use. Siebert and Belsky (1985) found the
households with the lowest level of rice self-sufficiency relied
most on rattan harvesting for income in the Philippines.
Gunatilake et al. (1993) found that contributions of NTFPs
to incomes in Sri Lanka declined as incomes rose. Similar
arguments have been made elsewhere that the poor are
more dependent on forest goods than better-off households
(Cavendish 2000; Hegde & Enters 2000; Mahapatra & Tewari
2005), and the poor particularly rely on forest income in times
of particular need (McSweeney 2002, 2004).
Other studies indicate that medium-income or richer
households are, in some situations, more likely to have forest
income than the poor, owing to high labour requirements
or elite capture of valuable resources (Godoy et al. 1995;
Wickramasinghe et al. 1996; Ambrose-Oji 2003; de Merode
et al. 2004). Often the role of income class depends on
what variable is measured. In a meta-analysis of 54 different
studies, absolute forest income increased as total household
income increased and ‘was thus important not only for poor
communities’, but forest income as a share of total income
148 P. D. McElwee
decreased, indicating the poor were more dependent on forest
income (Vedeld et al. 2004, p. xiv). This finding was echoed in
Ethiopia, where wealthier households received more absolute
cash income from forest produce, while poorer households
were dependent on forests for a larger percentage of their
income (Mamo et al. 2007). When comparing forest use in
South Africa, poor, average and rich households did not differ
in terms of the number of NTFPs used or the proportion
of households using them (Shackleton & Shackleton 2006).
However, the poorer households did use more NTFPs per
person in terms of volume when both income and subsistence
purposes were considered.
Other studies have noted the importance of land tenure.
The landless and land-poor are often more dependent on forest
product collection than the land-rich (Lacuna-Richman 2002;
Pandit & Thapa 2003). For those who have no access to land
for agriculture, NTFPs can provide a much needed source
of support, especially when they are collected from common
or open lands. In Orissa (India) dependence on forest income
was strongly correlated with size of land holdings, with the
landless being most dependent (Fernandes & Menon (1987).
Other social variables may also influence forest use. In
one study, NTFP exploitation was positively correlated with
household debt, labour availability and male to female ratios
and negatively correlated with income, education, distance
to forest, involvement in non-agricultural activities and
incorporation into the market (Gunatilake 1998). Factors such
as the size and labour capacity of households (Mamo et al.
2007), migration status (Lacuna-Richman 2006), opportunity
costs of collection and the substitutions of forest products
by market purchased goods (Senaratne et al. 2003), and the
strength of markets for forest produce (Ruiz-P
´
erez et al. 2004;
Bista & Webb 2006) may also be important. Previous studies
having highlighted heterogeneity even within smaller forest-
extracting communities (Coomes et al. 2004; Vedeld et al.
2004), more studies are needed to comprehensively account
for use of forest products across a range of ecological locations
andsocialsituations.
In Vietnam, millions of rural people live in close proximity
to forests, yet there has been little published on NTFP use, the
research there predominantly focusing on ethnic minorities,
who comprise around 13% of the national population and
live in mountainous areas with higher rates of forest coverage
(Wetterwald et al. 2004; Dang Viet Quang & Tran Nam Anh
2006; Hilfiker et al. 2006). There has been much less attention
to forest use among ethnic Vietnamese and those in lowland
areas. The present study attempts to remedy this through
a case study of forest extraction by Vietnamese households
living in lowland and midland areas of north central Vietnam.
The study aimed to build on experiences garnered from
previous studies on NTFP use and environmental income, and
attempted to follow the ‘best practices’ of Vedeld et al. (2004).
First, I examined all plant and animals extracted from forests,
both NTFPs and wood products, to establish their relative
importance so that different sources of forest income could be
clearly compared. Second, I collected information on all other
types of household income, both subsistence and in cash, in the
study area, so that forest environmental income could be put in
the context of overall household livelihoods. Third, I worked
with a number of households with diverse socioeconomic
backgrounds, including from all income classes and with
households from both the land poor and land rich, thus
accounting for factors often ignored in other studies which
frequently focus only on poor or landless households (Bista &
Webb 2006). Fourth, I worked with migrants and local-born
populations to see what effect the household’s background
and history played in their forest use decisions. The main
objective of the project was to determine which of a number
of socioeconomic factors had the strongest relationship with
the use of forest produce and forest environmental income
dependency.
METHODS
Research setting
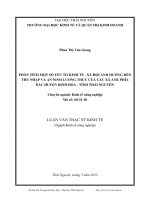
The study was conducted in rural areas of Ha Tinh province,
approximately 300 km south of the national capital Hanoi
(Fig. 1). Ha Tinh had an estimated population of 1.286
million in 1999 and is among the poorest areas of Vietnam
(Department of Planning and Investment Ha Tinh 2003). The
province has an area of 6055 km
2
divided into 11 districts and a
further 259 communes, the lowest level of state administration
in Vietnam. Below the commune most households group into
villages, although these are not officially recognized as an
administrative unit.
Ha Tinh is characterized by low coastal plains bordering
the South China Sea, rising to high mountains in the
Annamite chain separating Vietnam from Laos. Two major
nature reserves, the Vu Quang Nature Reserve and the Ke
Go Nature Reserve (KGNR), have been demarcated in
the past 15 years to protect what are seen as high levels of
biodiversity, particularly of mammals and birds (Eames 1996;
Le Trong Trai et al. 1999). The KGNR was established in
1996 with > 35 000 ha, primarily to protect populations of
two endemic and endangered pheasant species. The Reserve
was described at the time of founding as having one of the
‘largest remaining blocks of broadleaf evergreen forest in
the level lowlands of central Vietnam’ (Le Trong Trai et al.
1999, p. vii). However, more than 75% of the forest has
been classified as heavily disturbed due to past logging by
state-owned timber companies, and only at higher elevations
are areas of lightly disturbed forest found. The topography of
the Reserve is mostly low, gently sloping hills, with altitudes
of 50–500 m and it supports at least 46 mammal, 270 bird and
562 plant species (Le Trong Trai et al. 1999).
Officially, most protected areas in Vietnam consist of a
strictly protected inner core in which almost all anthropogenic
activities are banned (ICEM [International Centre for
Environmental Management] 2003). Within national parks
and nature reserves in particular, it is prohibited to ‘log,
exploit (excluding activities related to forest cleaning and
Forest environmental income in Vietnam 149
Figure 1 Map of the study area.
rehabilitation), hunt animals, collect specimens under any
means and forms Strict protection areas within national
parks and nature preservation areas should be protected
strictly. Every activity that causes negative impacts to forest
is not allowed’ (MARD [Ministry of Agriculture and Rural
Development] 1997). Any commune sharing a border with
a protected area is considered to be a ‘buffer zone’ in state
law, although in reality this creates no significant restrictions
on land use (Gilmour & San 1999). Many buffer zones,
however, have been able to attract projects, such as integrated
conservation and development projects (ICDP), in order to
reduce dependence of residents on protected area resources;
one such project was set up in Ke Go, funded through
the IUCN (World Conservation Union), to encourage the
planting of domesticated NTFPs like rattan and medicinal
plants in home gardens.
When the KGNR was demarcated the boundaries were
deliberately drawn to exclude human settlements, which fell
into a buffer zone of 22 000 ha. While no households were
living inside the actual boundaries of the Reserve at the time
of the present study, approximately 40 000 people lived in the
buffer zone, spread over eight communes in the district of Cam
Xuyen, one of the poorer districts. While not all residents in
these communes were involved in forest extraction activities,
those in areas closer to the Reserve were often actively
engaged. The most accessible areas within the KGNR used by
nearby villages were dominated by secondary forest and scrub
growth where timber, fuelwood and a variety of NTFPs could
be harvested, and buffalo and cattle were occasionally grazed
as well. The borders of Ke Go were only sporadically patrolled
by small numbers of rangers; while in the law any exploitative
extraction of goods from a nature reserve was illegal, rangers
primarily focused interdiction efforts on timber, charcoal
extraction, and hunting, while ignoring infractions of other
NTFPs or fuelwood harvesting for the most part. The typical
punishment for illegal logging was confiscation of timber and
any equipment used to cut it, and a monetary fine up to
500 000 VND (c. US$ 34), while charcoal makers were subject
to lower fines. In addition to these restrictions on extraction,
national law also stated that no land tenure certificates would
be granted to people farming inside the official boundaries of
any protected area, and any encroachment of agriculture onto
the Reserve would be stopped through fines and resettlement.
Study sample
Five villages in the KGNR buffer zone were chosen based
on stratified random sampling to include those with good
access and those with poorer access to the KGNR forest. The
approximate distance households in each village had to walk
to arrive at the natural forests that make up the KGNR were
used to classify villages as either close (<3 km away) or far
(>3 km away). Once households reached the KGNR border,
it was usually an additional two or more kilometres walk into
Reserve areas with sufficient forest cover to collect the most
common products. The general topography and ecology was
approximately the same for all villages; altitudes were <500 m
and all villages were located on the east or north-east side of
the KGNR. I visited the villages regularly from November
2000 until October 2001.
150 P. D. McElwee
Data collection
I randomly selected one-fifth of the households on each
village’s annual census roll and interviewed them in
Vietnamese with a standardized survey over the course of
several hours up to several days. Households were defined by
the official Vietnamese government classification of family
members living and eating together (known as a ho in
Vietnamese). In most cases, both husband (traditionally the
household head) and wife were interviewed together to
provide the most comprehensive recall on answers. Household
level information collected included household size, income,
migration status and history, educational levels and position
in the village, along with major household assets, such as
motorcycles, water pumps and tractors. Respondents were
also asked about land tenure holdings and access, and local
knowledge of forest species. They were asked to estimate
both the quantity and cash income raised from all forest
product extraction activities in the previous 12 months, along
with questions about the seasons and labour needed. All
answers were based on informant recall. Checklists of the
main categories of forest goods and species used were compiled
from group meetings and used as prompts to aid in memory
recall (for example respondents were specifically asked ‘Did
you collect any of species X in the past 12 months?’ for all
known products, as well as being allowed to add any additional
products collected).
A market survey was conducted at the main commune
and district markets to assess prices of goods throughout
the year and check against prices reported by respondents.
Qualitative interviews were also held with key informants,
and for each major type of forest product collected from
the KGNR (palm leaves, medicinal plants, wildlife, timber,
rattan and aromatics), focus groups were conducted with self-
identified collectors. More than 300 plant voucher specimens
were taken and deposited at the Institute of Biogeography’s
herbarium in Hanoi, and identified by a botanist specializing
in central Vietnam.
Data analysis
A number of variables were used in the analysis. Income
equivalents were derived for all products that were sold,
through use of average market prices and by informant recall.
Some products, however, were primarily used for subsistence
purposes (such as fuelwood, collected by 76% of households
but sold by only 35%). It is difficult to attach values to sub-
sistence forest goods (Godoy & Lubowski 1992; Wollenberg
2000; Gram 2001), but in this study, most products had a
local market (only few edible plants and fruits did not), aiding
construction of income equivalents for subsistence goods.
However, subsistence equivalent values should be taken as
approximations only, as recall on consumption was more
difficult for informants than for cash incomes raised.
All forest products collected by households in the past
12 months were listed and identified by species, through
voucher specimens for plants and by consultation of illustrated
guidebooks for animals. The survey distinguished between
forest goods collected in natural forests and income raised
from plantation forests (such as pine resin tapping) or planted
gardens (where some fuelwood was harvested). Domesticated
or planted trees were included as agricultural or plantation
income, and only income derived from natural forests was
counted as ‘forest income’. Although the collection of many
forest goods was technically illegal, households appeared
quite open in discussing patterns of use, primarily because
enforcement of the KGNR border was fairly low and
there was no threat of punishment by speaking with the
researcher. Furthermore, because this survey was combined
with ethnographic presence in the villages over the course of
several months, households were more open about forest use
activities. Multiple visits to households and multiple visits to
forest harvest sites with collectors were used to verify the data
obtained in the survey alone.
Following Vedeld et al. (2004), Sjaastad et al. (2005) and
Vedeld et al. (2007), environmental income was defined as
‘value added’, in other words ‘gross benefit net the costs of
capital consumption and intermediate inputs’ (Vedeld et al.
2004, p. 6). This definition does not require the subtraction
of labour costs, as a definition of rent might. The use of value
added income models is appropriate for this site in Vietnam
in which labour markets were very underdeveloped; a day
collecting forest goods was not a day taken away from other
wage activities, but rather was an activity undertaken when
there was a lack of other work opportunities, such as during
the agricultural slack season. Furthermore, there was little to
no capital outlay needed for any forest environmental activities
in Ke Go; for example, logging was carried out with hand
saws that the household often possessed anyway, not with
capital intensive chainsaws as is common i n other areas of Asia.
Further, there was little to no processing of forest products
beyond drying leaves or burning charcoal. Thus no processing
costs for goods needed to be included in income figures, due
to the low levels of value-adding to harvested products.
All other sources of household income were also calculated
from informant recall of amounts of goods produced and
income earned for a number of sectors. In agriculture, the main
crop planted was rice, along with a number of non-irrigated
crops such as corn, potatoes, sesame and beans. The total
amount of rice produced in the previous year was assessed,
which was multiplied by the average market price per kg of
rice to reach a value of ‘subsistence rice production’. However,
because only a minority of households (39%) actually sold
any rice, the ‘cash rice income’ was also calculated. Cash
income raised from the sale of all non-rice crops was also
assessed; the majority of households raised beans, corn and
sesame for sale, not subsistence, while cassava and potatoes
were primarily grown for livestock. Livestock income was
reported for cash earnings from the sales of meat, milk, eggs
or young animals; however, subsistence income was difficult
to calculate and therefore was underestimated for livestock.
Any garden products sold such as vegetables, fruits and herbs
Forest environmental income in Vietnam 151
were assessed as garden income, but as much garden produce
was consumed and not marketed, and as subsistence figures
were very difficult for households to recall exactly, garden
income was likely also underreported here.
All other cash income earned by household members in
various activities was enumerated, including unskilled wage
labour employment (primarily in construction, road building
and brick factories), as well as skilled labour, including
providing services (such as renting ploughs, fixing motorbikes,
etc), salaried employment, and government retirement or
pensions. Government subsidy payments, business income
and migrant remittances were all added to cash income to
form the category ‘cash wages’.
Once total annual income was calculated for each
household, income terciles were created, using both measures
of only cash income and cash plus subsistence income. For
comparisons of cash income, ‘low income households’ (n = 34)
were those with total household income below 2.8 million
VND (US$ 193) (US$ 1 = 14 500 VND in 2001), ‘average
income households’ had incomes of 2.8–5.5 million VND
(US$ 193–379) and ‘high income households’ were those with
incomes > 5.6 million VND (>US$ 386). For total cash and
subsistence income, ‘low income households’ were those with
incomes <4.7 million VND (<US$ 324), ‘average income
households’ had incomes of 4.8–7.61 million VND (US$ 324–
525) and ‘high income households’ had incomes > 7.62 million
VND (>US$ 525).
Landholdings were assessed using local land categories.
Agricultural lands included rice fields, both irrigated and
non-irrigated, and agricultural plots for field crops such as
cassava and corn. Around the household compound, home
gardens were usually found, and some households also had
hill gardens located further away. Some households’ land
holdings included government-allocated forest land, which
were plots of land with planted trees (mainly acacia, pine
and eucalypts) or which were slated for reforestation, and
which had been given to households for long-term protection
rights. Landholdings were measured in sao, the local land
measurement unit (1 sao = 500 m
2
or 20 sao = 1 ha). Most
households were clear on the number of sao they had land
rights to as such information was listed on all household land
tenure certificates, which had been recently issued.
Household expenses were calculated from informant recall,
a standard tool in most household living standards surveys
done in Vietnam and elsewhere (World Bank 2001). While
this is an imperfect method, households often did keep receipts
for many purchases, which could be checked and verified, and
when exact amounts of money spent could not be verified,
approximations based on total number of items purchased
and current market prices were used. However, because of
the difficulty of recall, these numbers should be taken as
relative assessments that provide approximate, not exact,
amounts of expenditures. Households were asked to estimate
their expenses for the previous 12 months in a number of
categories, including agriculture (buying seedlings, pesticides,
fertilizers, irrigation, harvesting and transport), forestry,
house maintenance (electricity, repair and upgrade, household
goods), food costs, schooling costs, health costs, agricultural
and land taxes and miscellaneous travel, ceremonial and other
expenses. These expenses were compared with income figures
to provide general estimates of household welfare.
Non-parametric t-tests (Mann-Whitney U tests) and non-
parametric one-way analysis of variance (ANOVA) (Kruskal-
Wallis tests) were used to interrogate the variations between
households in their forest use and income to determine
characteristics of forest-dependent and non-forest-dependent
households. The non-parametric Spearman rank correlation
was used to study associations among variables, and ordinary
least squares (OLS) multiple regressions were used to build
models of the household characteristics associated with forest
income earnings, both in terms of absolute forest income and
the relative share of overall household income.
RESULTS
Household characteristics
Household size was relatively even across the five study
villages, with a mean size of 4.8 members (SD 1.5). Household
heads on average had completed 6.6 years of schooling, and
were 45 years old. Sixty-three per cent of the households
identified themselves as ‘migrant households’, meaning the
household head had been born other than at the current place
of residence, with most having moved 200 km or less. The
mean annual income in cash for households was 4 710 031
VND (US$ 325) while the absolute income including
subsistence activities was 6 408 938 VND (US$ 442). Average
landholding was 15.4 sao (0.77 ha), of which 62% was used
for agriculture and the rest for residences and forestry.
Forest products collected
Eighty-eight per cent of households had harvested some sort
of forest product from around their villages in the past year.
Households on average collected 5.5 different wild species
(SD 7.0). Of 10 major forest product categories, fodder was
the most difficult to quantify, as several households indicated
they let their animals graze in the Reserve for several months
per year, but it was not possible to quantify this in terms
comparable with other plant extraction activities. Thus, total
income figures are underestimations, as they do not include
fodder that was not cut and brought to the home (which could
be measured and recalled).
In most cases, forest products were collected for both
subsistence and commercial use, with the exception of
charcoal, which was produced solely for commercial sale
(Table 1). The most commonly collected forest product for
subsistence was fuelwood, which 76% of households obtained
from natural forests, other households sourcing it from private
gardens or purchase. The most common commercial products
were fuelwood and leaves, both sold by 35% of households.
The most lucrative income-generating product collected from
152 P. D. McElwee
Table 1 Average cash income generation from forest-based sources.
Forest-based activity Total number of
households
collecting
(% of total)
Number of
households
selling
(% of total)
Average cash obtained by
selling product (VND yr
−1
)
for those households with
cash income from product
Average % contribution
to overall household cash
income for households
that sold product
Fuelwood 79 (76%) 36 (35%) 409 417 9.8
Leaves 54 (52%) 36 (35%) 365 681 8.4
Fruits 36 (35%) 8 (8%) 178 438 4.9
Timber 27 (26%) 23 (22%) 510 870 12.1
Rattans/bamboos 27 (26%) 5 (5%) 184 000 4.2
Charcoal 19 (18%) 19 (18%) 1 173 947 25.0
Medicinals 14 (13%) 7 (7%) 232 429 5.2
Fodder 8 (8%) 0 0 0
Honey 5 (5%) 3 (3%) 733 333 11.5
Aromatics/oils/others 4 (4%) 1 (1%) 20 000 <1
Animals 3 (3%) 1 (1%) 500 000 13.1
forests was charcoal, raising on average over 1 million VND
yr
−1
(US$ 69) and accounting for 25% of the income of
charcoal-making households (18% of the sample). Overall,
57% of households surveyed raised at least some cash income
from collecting forest products. On average, all non-wood
products contributed 190 952 VND (US$ 13) in cash value
per year to all surveyed households, while wood products
(fuelwood, timber and charcoal) contributed 469 173 VND
(US$ 32) in cash. If we exclude those households who reported
no cash forest income at all, the mean annual non-wood
forest product income was 336 593 VND (US$ 23) and the
mean wood income was 827 016 VND (US$ 57). Adding
subsistence goods, the values are even greater: the mean forest
environmental income was 1 137 649 VND (US$ 78) from all
sources averaged across the sample, and was US$ 90 for only
those households reporting some forest use.
While absolute forest income may seem small, as a
percentage of total income it was a significant contributor
to households in Ke Go, who reported very low total incomes
overall (Table 2). Forest environmental income was the
second-highest in absolute terms among all household cash
income sources, and was third among all income sources
in number of people benefiting. On average, households
received 20% of their total overall incomes from natural forest
exploitation, and 18% of their cash incomes.
Factors influencing forest environmental income
Households that derived some cash income benefit from
forests (hereafter ‘forest cash income (FCI) households’)
differed from ‘non-forest cash income (non-FCI) households’
(Table 3). Non-FCI households had significantly more income
from wage labour and livestock than FCI households, while
the latter were younger and more likely to live nearer the
forest. Agricultural production did not differ between the two
groups, although landholdings of the FCI households were
larger than non-FCI households (p = 0.042). Migration status
did not differ between FCI and non-FCI households, nor did
overall levels of income of the household.
Household age
Young households (household head ≤ 30 years), middle-aged
households (31–55 years) and households over 56 years old
(commensurate with Vietnam’s mandatory retirement age of
Table 2 Sources of household cash income in Ke Go.
Main categories of cash income Mean income (VND yr
−1
)
per household (n = 104)
No. of households
reporting this source
SD
Livestock 1 164 904 100 1 017 514
Forest environmental income 660 125 59 1 022 325
Government salary and state benefits 647 212 24 1 483 631
Gardens (fruits, vegetables, medicinals) 435 078 82 899 496
Migrant employment and remittances 425 961 26 1 029 728
Dry field crops (cassava, corn, peanuts, beans) 351 442 52 552 177
Rice sales 399 541 41 664 350
Plantation forestry 219 231 7 801 828
Local wage labour (construction, factories, etc.) 134 615 5 744 399
Services (motorbike repair, plough rental, etc.) 124 038 8 489 600
Other sources 35 865 4 231 691
Businesses/shops 14 423 2 109 206
Total mean income 4 700 031 – 2 945 940
Forest environmental income in Vietnam 153
Table 3 Comparison of forest cash income (FCI) households with non-forest cash income (non-FCI) households.
∗
= significant (p < 0.05),
∗∗
= highly significant (p < 0.01).
Household socioeconomic characteristics FCI households
(n = 59)
Non-FCI households
(n = 45)
Zscore p
Distance (0 = close to forest, 1 = far) 0.17 0.62 −4.933 0.000
∗∗
Migration status (0 = local, 1 = migrant) 0.68 0.57 −1.271 0.204
Age 41 49 −2.962 0.003
∗∗
Education 6.30 6.90 −1.133 0.257
Household size 5.03 4.49 −1.610 0.107
Subsistence rice production 1 583 288 1 670 267 −0.382 0.703
Rice cash income 296 122 535 133 −1.536 0.124
Livestock cash income 954 237 1 441 111 −2.066 0.039
∗
All non-wood forest product cash income 336 593 0 −7.348 0.000
∗∗
Wood cash income 827 017 0 −7.226 0.000
∗∗
Wages (all forms) 715 234 2 353 333 −4.093 0.000
∗∗
Absolute household cash income 4 158 936 5 432 578 −1.486 0.137
Household expenses 5 435 920 5 977 639 −0.505 0.613
Total household landholdings 16.31 14.29 −2.038 0.042
∗
55) differed in the amount of rice produced (Kruskal-Wallis
p = 0.001), the cash obtained from selling wood products (p =
0.012), the income obtained from employment (p = 0.029)
and in landholdings (p = 0.004). Young households depended
more on forest extraction, while older households were more
likely to have income from wages, salaries or pensions, and
less income from forests, as well as smaller landholdings.
Migration status
Migrants had higher incomes from the sale of wood products
(Mann-Whitney p = 0.049), but not from other forest goods.
Migrants’ overall percentage of cash income derived from
forests was significantly higher than non-migrants, indicating
they were more dependent on forest products (p = 0.023).
Migrants also had much lower incomes from employmentthan
did non-migrants (p = 0.029). Overall, however, migration
status had less effect than other socioeconomic factors on
forest environmental income.
Relationship of overall household wealth to forest
environmental income
Absolute forest environmental income
The poorest households were not those with the highest
absolute (AFI) or relative forest income (RFI) (Table 4).
When households were ranked by their overall cash income,
the cash-poorest household tercile had much lower levels of
cash AFI (378 265 VND) than did middle income households
(1 060 200 VND) and rich households (533 857 VND)
(χ
2
= 11.05; p = 0.004) (Fig. 2). Poor households also differed
from average and rich households in other ways; in general,
poor households produced lower amounts of cash income from
agricultural goods and had fewer livestock, lower incomes
from cash wages and smaller overall landholdings.
When households were ranked by a combination of both
cash and subsistence income, the differences in AFI became
less significant: the poorest households received 884 510 VND
in all forms of forest environmental income, while the middle
households received 1 321 511 VND and rich households
Table 4 ANOVA of socioeconomic variables, comparing households ranked by cash income sources.
∗
= significant (p < 0.05),
∗∗
= highly
significant (p < 0.01).
Household socioeconomic
characteristics
Poor households
(n = 34)
Average households
(n = 35)
Rich households
(n = 35)
χ
2
p
Age 45.4 39.5 49.3 10.540 0.005
∗∗
Education 5.6 7.0 7.1 5.898 0.052
Household size 4.3 5.2 4.9 5.217 0.074
Subsistence rice production 1 212 822 1 776 514 1 861 714 10.786 0.005
∗∗
Rice cash income 75 353 502 863 611 143 10.996 0.004
∗∗
Dry crop cash income 192 941 262 000 594 857 6.849 0.033
∗
Garden cash income 147 809 381 486 767 730 7.390 0.025
∗
Livestock cash income 741 146 1 100 000 1 641 429 15.141 0.001
∗∗
Cash wages 164 706 340 000 1 397 143 40.198 0.000
∗∗
Absolute household cash income 1 824 074 4 291 406 7 932 159 91.558 0.000
∗∗
Total household landholdings 8.95 16.11 19.93 6.974 0.031
∗
Absolute forest income 378 265 1 060 200 533 857 11.048 0.004
∗∗
Relative forest income 21% 26% 7% 11.948 0.003
∗∗
154 P. D. McElwee
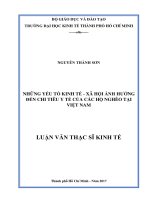
Figure 2 Box plot of t otal cash income from forest-based sources
by income classes. AFI = absolute forest income, HH = household.
Thick black line = median value, grey box = 25th–75th percentile
of values, whisker line = largest value within 1.5 box lengths.
received 1 199 694 VND (χ
2
= 3.92; p = 0.141). However,
it should be remembered that fodder is undervalued in these
figures, for reasons noted earlier, and if it were included,
it would probably increase the subsistence incomes of the
average and rich households more than the poor, as the poor
were less likely to own buffalo or cattle (χ
2
= 5.41; p = 0.067)
However, because subsistence forest income did not differ
significantly between income classes (poor households 428 099
VND, medium households 461 582 VND and rich households
541 476 VND), there was a fairly standard ‘baseline’ of forest
subsistence consumption (primarily fuelwood use) across all
classes. When households exceeded this baseline and sold
additional products for cash, it was middle income, not the
poor households, who most benefited.
Relative forest income and dependency
Absolute income is not always the best measure to explain
the importance of forests to households. Rather, it is often the
percentage of household income from forests that reflects how
dependent households are on natural resources. There was a
wider range of variation in RFI among economic classes than
there was in AFI (Fig. 3). Both the poor and average income
terciles had several households with high RFI, including some
households who obtained 100% of their families’ annual cash
income from forests. Yet, overall RFI corresponded with AFI;
poor households were less dependent on forest income than
average households. On average, the poor raised 21% of their
cash from forests, middle income households raised 26% and
rich households raised 7% (χ
2
= 11.95; p = 0.003).
Further ANOVA analysis showed that high dependency
households (those obtaining 50% or more of their cash income
from forests, n = 16) earned less from wage labour (p = 0.035)
and livestock (p = 0.007) than low-dependency (n = 42) and
Figure 3 Percentage of household cash income contributed by
forest-based sources by income classes. RFI = relative forest
income, HH = household. Thick black line = median value, grey
box = 25th–75th percentile of values, whisker line = largest value
within 1.5 box lengths.
non-dependent (n = 46) households. This suggests that it is
insufficient to analyse whether poorer or richer households are
dependent on forest income, without additionally focusing
on the specific income streams that correlate with lower
household dependency. In the Ke Go case, it appeared that
households may use forest environmental income to make up
for lower income from other sources like wages or livestock.
Factors affecting income from forests
Combining all the previously considered independent
continuous variables (age, income sources and landholdings),
and adding in binary dummy variables such as migration
status, distance to the forest and income status (poor and
non-poor), allows analysis of the relative importance of these
variables in regression models (Table 5 and 6). OLS regression
to test the effects of the various independent variables on
the dependent variable of AFI (Table 5) indicated there
was a clear relationship between forest income and social
variables such as the age of the household head, and whether
it was a poor household; the model indicated younger and
medium-rich households had higher AFI. AFI was also
related to specific income streams: those who derived a higher
percentage of their cash income from wages and livestock
had negative relationships with AFI, as did those households
which produced more rice. A household’s migration status,
its distance to the forest and size were not significant in the
AFI regression model.
OLS regression with RFI as the dependent variable
(Table 6) indicated variables such as income from wages
and livestock and rice productivity and landholdings were
negatively associated with RFI. However, unlike AFI, age
was not important in predicting RFI while distance was:
Forest environmental income in Vietnam 155
Table 5 OLS regression with absolute forest income (AFI) as the dependent variable (n = 104, R = 0.713,
adjusted R
2
= 0.461, SE = 750374.889, F =10.799, p = 0.000).
∗
= significant (p < 0.05),
∗∗
= highly significant
(p < 0.01).
Variables Unstandardized
coefficients
SE T p
(Constant) 173246.81 435240.979 3.980 0.000
∗∗
Distance (dummy: 0 = near to forest,
1 = far from forest)
−161020.35 204620 −0.787 0.433
Age −15347.398 6470.601 −2.372 0.020
∗
Migration status (dummy: 0 = local,
1 = migrant)
252857.036 175334.278 1.442 0.153
Livestock income −0.232 0.085 −2.730 0.008
∗∗
Household size 34892.272 61945.294 0.563 0.575
% income derived from cash wages −173693.7 321260.951 −5.090 0.000
∗∗
Income class (dummy: 0 = poor,
1 = non-poor)
1126989.16 193969.178 5.810 0.000
∗∗
Total value of household rice
production
−0.350 0.109 −3.212 0.002
∗∗
Total household landholdings −10804.065 5162.846 −2.093 0.039
∗
households closer to the forest had a higher RFI. Migration
status and household size did not affect RFI.
DISCUSSION
The study supported the initial supposition that
socioeconomic variables can potentially be used to identify
and even predict likely forest–income generating and forest-
dependent households. While subsistence use of forests was
fairly evenly spread across all households, FCI households
were generally closer to the forest, younger households and
had fewer wage labour opportunities and low income from
livestock. When all variables were combined in regression
models however, R
2
values were modest, indicating the
difficulties of developing a robust model of forest dependency
or forest income, given the heterogeneity in the sample and
number of variables involved. Nonetheless, age, distance,
income class and sources of income were all significantly
linked to the household AFI and RFI, and these variables
clearly warrant further research (Vedeld et al. 2004).
This study indicates household age should be included in
forest income analysis, however only 14 out of 54 cases in a
recent meta-analysis of forest environmental income included
household age, and statistics did not reveal variation in age
to be a significant factor in explaining forest incomes (Vedeld
et al. 2004). Other work on poverty in Asia has posited that
land-based income, such as that from forests, is increasingly
less important for young households who have more off-
farm opportunities (Rigg 2006), however this study failed to
confirm this. Some young people had migrated out of the
province and sent remittances to their families (included in
the household income totals, and averaging about 1.9 million
VND [US$ 131] per migrant). However, the majority of young
people in Ke Go did not migrate and had no alternative
Table 6 OLS regression with relative forest income (RFI) as the dependent variable (n = 104, R = 0.698, adjusted
R
2
= 0.438, SE = 0.19268, F = 9.920, p = 0.000).
∗
= significant (p < 0.05),
∗∗
= highly significant (p < 0.01).
Variables Unstandardized
coefficients
SE T p
(Constant) 0.444 0.112 3.974 0.000
∗∗
Distance (dummy: 0 = near to forest,
1= far from forest)
−0.109 0.053 −2.068 0.041
∗
Age −2.365 0.002 −1.423 0.158
Migration status (dummy: 0 = local,
1 = migrant)
4.533 0.045 1.007 0.317
Livestock income −6.315 0.000 −2.893 0.005
∗∗
Household size 2.228 0.016 1.401 0.165
% income derived from cash wages −0.401 0.088 −4.576 0.000
∗∗
Income class (dummy: 0 = poor,
1 = non-poor)
0.127 0.050 2.554 0.012
∗
Total value of household rice
production
−6.661 0.000 −2.381 0.019
∗
Total household landholdings −3.976 0.001 −2.999 0.003
∗∗
156 P. D. McElwee
to continued on-farm work, including forest exploitation.
Younger households reported much lower access to prime
government jobs and local wage labour than middle-aged
and older households, and concomitantly higher reliance on
forest environmental income as a result. Age was particularly
important in explaining levels of AFI, with young households
registering high AFI, likely due to the lack of other alternative
income streams and smaller landholdings, and their ability to
undertake physically demanding forest work.
The findings of the study on the links between forest
environmental income and household welfare in Ke Go raise
intriguing questions, as they appear to contradict much of
the literature on poverty and forest use (Angelsen & Wunder
2003; Belcher 2005). For example, in Zimbabwe, Cavendish
(2000) found poor households derived more than 40% of
their income from forests, a higher percentage than the rich,
while here the poor had significantly lower RFI levels than
average income households, although all household classes
used approximately the same amounts of subsistence forest
products. Why did the poor not collect more products in
the KGNR to sell? This would seem to be a logical welfare
strategy, given that cash-poor households also produced less
rice and sold less rice. They also derived significantly less of
their income from wages and livestock. The poor also had
less land, especially the most productive irrigated rice lands.
Given these disadvantages, why did poor households not raise
more FCI?
There are several possible explanations. First, poorer
households had fewer overall landholdings, and may have
been more likely to expend limited household labour on inputs
into the small agricultural landholdings they did have, rather
than collecting forest products. It is well known that wet rice
production can be raised substantially, even in the absence
of cash inputs like pesticides and fertilizer, by increasing
inputs of labour, a process first termed ‘agricultural involution’
(Geertz 1963). This contrasts with other cropping systems,
in which labour inputs peak at some point and produce
diminishing returns per increase in labour expended. Because
increasing labour inputs for wet rice farming may often be
the only choice available for capital-deficient households, this
can result in labour shortages that may be especially acute for
the cash-poor. Any additional labour spent on rice probably
reduced labour available for forest collection activities for poor
households; qualitative interviews with the poor confirmed
that this was a concern for many.
Second, most FCI in Ke Go was raised from the protected
forests of the KGNR. However, because extraction there was
technically illegal, under state law rangers had the right to
confiscate all produce leaving the Reserve. In practice, rangers
rarely imposed fines or meted punishments for NTFPs, but
timber and charcoal were increasingly being targeted for
interdiction. Households reported that an ‘informal payment’
could often be offered to rangers to allow them to continue to
take produce out of the KGNR; the average payment needed
to remove timber was c. one-third of the timber’s retail value.
Poorer households would likely have less available cash for
these bribes, and thus may have been less able to afford the
cost of access to the KGNR. Either poorer households entered
the forest less frequently due to concerns bribes could not be
paid, or the poor took less produce from the KGNR in the
hope of avoiding larger fines. Future studies on the impact
of forest law enforcement among different income classes are
required to resolve this question.
CONCLUSIONS
Poor households in Ke Go show lower levels of reliance on
forest produce in both absolute and relative terms than wealth-
ier households. Development interventions around protected
areas often assume that poorer households will be more
dependent on forests, and thus these households are often
targeted for development assistance in integrated conservation
and development projects (ICDPs) (Salafsky & Wollenberg
2000; Hughes & Flintan 2001). This has certainly been in case
in Vietnam, where poor households living around protected
forests have been prime objects of ICDP interventions, such
as providing alternative income sources like garden plants or
livestock (Sage & Nguyen Cu 2001; ICEM 2003). Yet this
study indicates that if conservation projects wish to target
high forest-using households to induce them to abandon forest
exploitation, it is middle income households that need to be
targeted. Poor households may also be targeted to reduce
poverty, but a concomitant conservation outcome would not
be as clear, since the poor use less forest produce.
While specific household targeting may appear infeasible
or unwieldy, pro-poor targeting is well-established in many
projects in Vietnam, both in conservation and in other sectors.
Villages keep extensive lists of which households meet national
poverty criteria, and these households are often eligible for
ID cards that enable them to receive reduced prices on
some subsidized goods, free health care, free schooling and
other benefits (AusAid 2002). Recent studies on forests and
poverty in Vietnam have advocated better links between
the two sectors and the extension of pro-poor policies and
poverty targeting to distribution of land and forest resources
(Muller et al. 2006). Although these pro-poor targeting
efforts are expanding rapidly, they may not necessarily be
applicable to conservation work, which may need to focus on
middle-income households. Simply identifying where poor
communes and districts intersect with high forest cover
(Muller et al. 2006) may not be as useful as identifying
household level factors that influence forest use. Even in areas
of general poverty like Ke Go there were large variations in
the relative levels of poverty, and these appear to strongly
influence forest use patterns among households.
Forestry could contribute to poverty alleviation in Vietnam
(Sunderlin & Huynh Thu Ba 2005; Sunderlin 2006). For
example, there may be poverty outcomes that could be
addressed by providing poor households with greater access
to goods now harvested illegally from places like the KGNR,
along with better access to markets for harvested goods
and value-added processing to raise prices for goods sold.
Forest environmental income in Vietnam 157
However, in terms of conservation outcomes, projects to
reduce the impact of households on protected areas should
pay close attention to households who use protected forests
the most, and these may not be the poorest households.
Further, ICDPs and other conservation interventions often
rely on community participation to help determine who
benefits from projects. Older households may be more likely
to be invited to meetings than younger ones, and older
community leaders (such as village headmen or shamans) may
be recruited to lend their local respect and prestige to ICDP
activities. Yet this study suggests that older households are
least likely to exploit the forest, thus meetings and projects
would do well to also explicitly target younger households, as
they are more likely to be forest-users.
Forest dependency seems to be lowest in households with
alternative wage labour opportunities, while relationships
between agricultural production, for example in gardens, and
forest use were less clear. KNGR households with steady
cash wages were the least likely to have forest income, while
households with greater access to gardens and alternative crops
did not differ in lower forest use. This suggests that instead
of improving agriculture, through garden development or
alternative crops in rural areas near protected reserves (the
most common approach in Vietnam and many other places; see
examples in SNV [Netherlands Development Organization]
2000), conservation interventions should focus on increasing
wage labour opportunities, such as providing job training
for unskilled workers or creating waged positions in forest
protection, for example rangers. If funded, such alternatives
are likely to be feasible given that a number of households
surveyed were already seeking such opportunities through
migrant remittances. If more l ocal waged positions were
available, it is likely that more households would be able to
reduce their forest use, given access to appropriate income
substitutions.
ACKNOWLEDGEMENTS
Research funding was generously provided by the Wenner
Gren Foundation for Anthropological Research and a
National Science Foundation Dissertation Improvement
Grant. I would like to thank my research sponsor in Vietnam,
the Center for Natural Resources and Environmental Studies
of Vietnam National University and, in particular, Dr Vo Quy,
Dr Truong Quang Hoc and Vo Thanh Giang, for supporting
this research. I am grateful to Dr Le Tran Chan for assistance
in identifying specimens. I would also like to thank Dr. J.E.M.
(Mike) Arnold for inspiring my interest in NTFP research
many years ago.
References
Ambrose-Oji, B. (2003) The contribution of NTFPs to the
livelihoods of the ‘forest poor’: evidence from the tropical forest
zone of south-west Cameroon. International Forestry Review 5:
106–117.
Angelsen, A. & Wunder, S. (2003). Exploring the Forest-Poverty Link:
Key Concepts, Issues and Research Implications. Bogor, Indonesia:
CIFOR.
Arnold, J.E.M. & Ruiz-P
´
erez, M. (2001) Can non-timber forest
products match tropical forest conservation and development
objectives? Ecological Economics 39: 437–447.
AusAid (2002) Vietnam Poverty Analysis. Sydney, Australia:
Australian Agency for International Development.
Belcher, B. (2005) Forest product markets, forests and poverty
reduction. International Forestry Review 7: 82–89.
Belcher, B., Ruiz-P
´
erez, M. & Achidiawan, R. (2005) Global patterns
and trends in the use and management of commercial NTFPs:
implication for livelihoods and conservation. World Development
33: 1435–1452.
Bista, S. & Webb, E.L. (2006) Collection and marketing of
non-timber forest products in the far western hills of Nepal.
Environmental Conservation 33: 244–255.
Byron, R. & Arnold, M. (1999) What futures for the people of the
tropical forests? World Development 27: 789–805.
Cavendish, W. (2000) Empirical regularities in the poverty-
environment relationship of rural households: evidence from
Zimbabwe. World Development 28: 1979–2003.
Coomes, O.T., Barham, B.L. & Takasaki, Y. (2004) Targeting
conservation-development initiatives in tropical forests: insights
from analyses of rain forest use and economic reliance among
Amazonian peasants. Ecological Economics 51: 47–64.
Counsell, T. & Rice, S., eds. (1992) The Rainforest Harvest:
Sustainable Strategies for Saving the Tropical Forests. London, UK:
Friends of the Earth.
Dang Viet Quang & Tran Nam Anh (2006) Commercial collection
of NTFPs and households living in or near the forests: case study
in Que, Con Cuong and Ma, Tuong Duong, Nghe An, Vietnam.
Ecological Economics 60: 65–74.
de Merode, E., Homewood, K. & Cowlishaw, G. (2004) The value
of bushmeat and other wild foods to rural households living in
extreme poverty in Democratic Republic of Congo. Biological
Conservation 118: 573–581.
Department of Planning and Investment Ha Tinh (2003) Planning
Atlas of Ha Tinh. Ha Tinh Province, Vietnam: Department of
Planning and Investment.
Dove, M.R. (1993) A revisionist view of tropical deforestation and
development. Environmental Conservation 20: 1–17.
Eames, J. (1996) Ke Go Nature Reserve. World Birdwatch 18:
6–8.
Fernandes, W. & Menon, G. (1987) Tribal Women and Forest
Economy. New Delhi, India: Indian Social Institute.
Geertz, C. (1963) Agricultural Involution: The Processes of Ecological
Change in Indonesia. Berkeley, CA, USA: University of California
Press.
Gilmour, D.A. & San, N.V. (1999) Buffer Zone Management in
Vietnam. Hanoi, Vietnam: IUCN.
Godoy, R. & Lubowski, R. (1992) Guidelines for t he economic
valuation of non-timber forest products. Current Anthropology 33:
424–433.
Godoy, R., Brokaw, N. & Wilkie, D. (1995) The effect of income
on the extraction of non-timber tropical forest products: model,
hypotheses, and preliminary findings from the Sumu Indians of
Nicaragua. Human Ecology 23: 29–53.
Gram, S. (2001) Economic valuation of special forest products: an
assessment of methodological shortcomings. Ecological Economics
36: 109–117.
158 P. D. McElwee
Gray, A. (1990) Indigenous peoples and the marketing of the
rainforest. In: The Ecologist 20: 223–227.
Gunatilake, H. (1998) The role of rural development in protecting
tropical rainforests: evidence from Sri Lanka. Journal of
Environmental Management 53: 273–292.
Gunatilake, H.M., Senaratne, D.M.A.H. & Abeygunawardena, P.
(1993) Role of non-timber forest products in the economy of
peripheral communities of Knuckles National Wilderness Area
of Sri Lanka: a farming systems approach. Economic B otany 47:
275–281.
Hegde, R. & Enters, T. (2000) Forest products and household
economy: a case study from Mudumalai Wildlife Sanctuary,
Southern India. Environmental Conservation 27: 250–259.
Hilfiker, K., Zingerli, C., Sorg, J.P. & Lothi, R. (2006) Market
potential and resource management of non-timber forest products
(NTFPs) in the northern uplands of Vietnam. Schweizerische
Zeitschrift fur Forstwesen 157: 49–56.
Hughes, R. & Flintan, F. (2001) Integrating Conservation and
Development Experience: A Review and Bibliography of the ICDP
Literature. London, UK: IIED.
ICEM (2003) Vietnam National Report on Protected Areas and
Development: Review of Protected Areas and Development in the
Lower Mekong River Region. Indooroopilly, Queensland, Australia:
The International Centre for Environmental Management.
Iqbal, M. (1993) International Trade of Non-Wood Forest Products:
An Overview. Rome, Italy: Food and Agriculture Organization.
Lacuna-Richman, C. (2002) The socio-economic significance of
subsistence non-wood forest products in Leyte, Philippines.
Environmental Conservation 29: 253–262.
Lacuna-Richman, C. (2006) The use of non-wood forest products by
migrants in a new settlement: experiences of a Visayan community
in Palawan, Philippines. Journal of Ethnobiology and Ethnomedicine
2: 36.
Le Trong Trai, Dung, N.H., Cu, N., Cham, L.V., Eames, J. &
Chicoine, G. (1999) An Investment Plan for Ke Go Nature Reserve,
Ha Tinh Province, Vietnam: A Contribution to the Management
Plan. Hanoi, Vietnam: Birdlife International and the Forest
Inventory and Planning Institute.
Mahapatra, A.K. & Tewari, D.D. (2005) Importance of non-timber
forest products in the economic valuation of dry deciduous forests
of India. Forest Policy and Economics 7: 455–467.
Mamo, G., Sjaastad, E. & Vedeld, P. (2007) Economic dependence
on forest resources: a case from Dendi District, Ethiopia. Forest
Policy and Economics 9: 916–927.
MARD (1997) Review report on planning, organization
and management of special use forest. Cuc Phuong
National Park, Vietnam: Ministry of Agriculture and Rural
Development.
Marshall, E., Newton, A.C. & Schreckenberg, K. (2003)
Commercialisation of non-timber forest products: first steps in
analysing the factors influencing success. International Forestry
Review 5: 128–137.
McSweeney, K. (2002) Who is ‘forest-dependent’? Capturing local
variation in forest-product sale, Eastern Honduras. Professional
Geographer 54: 158–174.
McSweeney, K. (2004) Forest product sale as natural insurance: the
effects of household characteristics and the nature of shock in
eastern Honduras. Society and Natural Resources 17: 39–56.
Muller, D., Epprecht, M. & Sunderlin, W.D. (2006) Where are the
Poor and Where are the Trees?: Targeting of Poverty Reduction
and Forest Conservation in Vietnam. Bogor, Indonesia: Center for
International Forestry Research (CIFOR).
Neumann, R.P. & Hirsch, E. (2000) Commercialisation ofNon-Timber
Forest Products: Review and Analysis of Research. Rome, Italy:
CIFOR and FAO.
Pandit, B.H. & Thapa, G.B. (2003) A tragedy of non-timber forest
resources in the mountain commons of Nepal. Environmental
Conservation 30: 283–292.
Rigg, J. (2006) Land, farming, livelihoods and poverty: rethinking
the links in the rural South. World Development 34: 180–202.
Ruiz-P
´
erez, M. & Arnold, J., eds (1996) Current Issues in Non-
Timber Forest Products Research. Bogor, Indonesia: Center for
International Forestry Research (CIFOR).
Ruiz-P
´
erez, M., Belcher, B., Achidiawan, R., Alexiades, M.,
Aubertin, C., Cabellero, J., Campbell, B., Clement, C.,
Cunningham, A., Fantini, A., de Forestra, H., Gracia Fernandez,
C., Gautam, K., Martinez, P.H., de Jong, W., Kusters, K.,
Kutty, M.G., Lopez, C., Fu, M., Martinez Alfaro, M.A.,
Nair, T.K.R., Ndoye, O., Ocampo, R., Rai, N., Ricker, M.,
Schreckenberg, K., Shackleton, S., Shanley, P., Sunderland, T.
& Youn, Y.C. (2004) Markets drive the specialization strategies
of forest peoples. Ecology and Society 9:4 [www document]. URL
/>Sage, N. & Nguyen Cu, eds (2001) A discussion paper on analysis
of constraints and enabling factors of integrated conservation and
development projects (ICDP) in Vietnam. Hanoi: ICDP Working
Group and IUCN.
Salafsky, N. & Wollenberg, E. (2000) Linking livelihoods and
conservation: a conceptual framework and scale for assessing the
integration of human needs and biodiversity. World Development
28: 1421–1438.
Senaratne, A., Abeygunawardena, P. & Jayatilake, W. (2003)
Changing role of non-timber forest products (NTFP) in rural
household economy: the case of Sinharaja World Heritage site in
Sri Lanka. Environmental Management 32: 559–571.
Shackleton, C.M. & Shackleton, S.E. (2006) Household wealth status
and natural resource use in the Kat River valley, South Africa.
Ecological Economics 57: 306–317.
Siebert, S.F. & Belsky, J. (1985) Forest product trade in a lowland
Filipino Village. Economic Botany 39: 522–533.
Sjaastad, E., Angelsen, A., Vedeld, P. & Bojo, J. (2005). What is
environmental income? Ecological Economics 55: 37–46.
SNV (2000) Proceedings of Integrated Conservation and Development
Projects Lessons Learned Workshop. Hanoi, Vietnam: SNV, WWF
and IUCN.
Sunderlin, W. & Huynh Thu Ba (2005) Poverty Alleviation and
Forests in Vietnam. Bogor, Indonesia: Centre for International
Forestry Research (CIFOR).
Sunderlin, W. (2006) Poverty alleviation through community
forestry in Cambodia, Laos and Vietnam: an assessment of the
potential. Forest Policy and Economics 8: 386–396.
Vedeld, P., Angelsen, A., Sjaastad, E., & Berg, G.K. (2004)
Counting on the environment: forest incomes and the rural poor.
Environmental Economics Series Paper No. 98. Washington DC,
USA: The World Bank.
Vedeld, P., Angelsen, A., Bojo, J., Sjaastad, E. & Berg, G.K. (2007)
Forest environmental incomes and the rural poor. Forest Policy
and Economics 9: 869–879.
Wetterwald, O., Zingerli, C. & Sorg, J.P. (2004) Non-timber forest
products in Nam Dong District, Central Vietnam: Ecological and
Forest environmental income in Vietnam 159
economic prospects. Schweizerische Zeitschrift fur Forstwesen 155:
45–52.
Wickramasinghe, A., Perez, M.R. & Blockhus, J.M. (1996)
Nontimber forest product gathering in Ritigala forest (Sri Lanka):
household strategies and community differentiation. Human
Ecology 24: 493–519.
Wollenberg, E. (2000) Methods for estimating forest income and
their challenges. Society and Natural Resources 13: 777–795.
Wollenberg, E. & Ingles, A., eds. (1998) Incomes from the Forest:
Methods for the Development and Conservation of Forest Products
for Local Communities. Bogor, Indonesia: Centre for International
Forestry Research (CIFOR).
World Bank (2001) Vietnam Living Standards Survey (VLSS),
1997–98: Basic Information. Washington DC, USA:
Poverty and Human Resources Division, The World
Bank.