Assessment of the WRF model for Southern region of Viet Nam in dry and rainy seasons
Bạn đang xem bản rút gọn của tài liệu. Xem và tải ngay bản đầy đủ của tài liệu tại đây (5.67 MB, 10 trang )
ASSESSMENT OF THE WRF MODEL FOR SOUTHERN REGION
OF VIET NAM IN DRY AND RAINY SEASONS
Le Anh Ngoc(1), Vo Thi Nguyen(1), Nguyen Van Hong(1), Bui Chi Nam(1), Le Hong Duong(2)
(1)
Viet Nam Sub-Institute of HydroMeteorology and Cimate Change
(2)
Department of Southern Environmental Protection
Received: 17 July 2022; Accepted: 15 August 2022
Abstract: This article investigates the capability of the applicability of numerical WRF model to
forecast weather at 48 hours for the Southern Region Viet Nam in the rainy and dry seasons in 2021 (12/2020
- 11/2021). The WRF model shows that predicted maximum temperature, minimum temperature and
rainfall are lower than measured values. Temperature forecasts are more accurate than rainfall forecasts.
Rainfall forecast in the rainy season has a higher error than the rainfall forecast in the dry season, on the
contrary, the temperature forecast in the rainy season gives lower error than the temperature forecast in
the dry season.
Keywords: WRF, temperature forecast, rainfall, Southern region.
1. Introduction
Nowadays, applying numerical models in
weather forecasting and warning of different
types of natural disasters is a prevailing method.
The Weather Research and Forecasting (WRF)
model [5] was developed in the US and is one
of the models being applied for professional
weather forecasting in many countries around
the world including Viet Nam [2]. Moreover, the
outputs of the model can also provide input data
to hydrological, hydrographic, environmental
models, etc. ... The WRF model was originally
developed as a regional scale model. However,
with the multi-layer mesh method, this model
can be set up to simulate for the Southern
region with detailed grid resolution of several
kilometers.
The Southern region of Viet Nam is located
in the tropical monsoon climate, with two distinct seasons in a year: The rainy season and
the season. Rainy season usually lasts from
May to November, accounting for 90 - 95%
of the total annual rainfall. The change in
topography can cause different weather patterns.
Corresponding author: Nguyen Van Hong
E-mail:
24
JOURNAL OF CLIMATE CHANGE SCIENCE
NO. 23 - SEP. 2022
Therefore, timely and accurate forecasting of
the corresponding weather in the area is an
important work. Air temperature and
precipitation are meteorological factors that
reflect the climatic characteristics of regions. In
this study, the WRF model is applied to predict
the changes and characteristics of the above
factors between the rainy and dry seasons in the
Southern region of Viet Nam.
2. Methods and data
2.1. Setting up the WRF model
The WRF model was developed by the
National Center for Atmospheric Research
(NCAR), and the National Center for
Environmental Prediction (NCEP). The WRF
model is designed to be flexible, highly
customizable and capable of operating on
mainframe systems and can be easily customized
for both research and operational forecasting.
WRF can simulate climate by dynamic
downscaling (Dynamic downscaling climate
simulations), air quality research and assessment,
combined ocean-atmospheric models and ideal
simulations (such as boundary layer vortices,
convection, sub-pressure waves, etc.). Because
of the above advantages, the WRF model is being
used in atmospheric research and operational
forecasting in the United States as well as in many
parts of the world. This article uses the latest
version of WRFV4.0, which is much improved
than before: Includes adding missing values to
land fields (Soil temperature, soil moisture, etc.).
The key equation of the WRF model is the Euler
non-hydrostatic complete system of equations.
The vertical coordinate system is the pressure
coordinate system. Horizontal coordinate
system: Arakawa-C interlaced grid between
quantities with wind direction (u,v) and scalar
quantities (temperature, pressure).
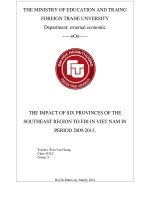
The physical parameterization diagrams in
the WRF model are divided into the following five
categories: microphysical processes (describing
the mixed physical processes of solid-liquidgas phase to solve the model's cloud problem),
convection parameterization schemes (shallow
and deep convection parameterization), surface
physical processes (due to the variety of
surface coating properties from simple thermal
models to fully vegetated and wet soil surfaces,
including snow cover and sea ice), processes
occurring in the boundary layer (for turbulent
kinetic energy forecasting and diagrams) and
radiative balance in the atmosphere (including
long and short-wave effects with wide or shortwave only, cloud effects and surface fluxes).
Figure 1. Vertical coordinate system and physical interactions in WRF
Initial conditions of WRF: WRFARW model can
run with input from global models such as GME
(General Department of Weather, GermanyDWD), GFS (US National Center for
Environmental Forecasting-NCEP), GSM (Japan
Meteorological Agency-JMA), NOGAPS (US Naval
Meteorological Agency). In this article, the
model is set to 6 h time step/metric for 04
sessions/day (00,06,12,18 UTC), the model
resolution of domain 1 is 0.18o x 0.18o and
domain 2 is 0.04o x 0. 04o number of 32 ink levels,
the data includes 21 surface variables
(rain, t2m, q2m, um, v10m, cloud, OLR, Tsoil……..)
and 5 variables on pressure level; Terrain
altitude (H), wind (U, V), temperature (T),
humidity (Q).
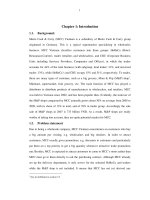
Figure 2. Simulation domain of the WRF model
JOURNAL OF CLIMATE CHANGE SCIENCE
NO. 23 - SEP. 2022
25
Domain and grid of the model
Domain D01: Includes 130 x 120 grid points,
grid size 20 km
Domain D02: Includes 161 x 121 grid points,
grid size 4 km.
This paper evaluates the possibility of using
the WRF model to forecast 48 hour weather for
19 stations in the South in 2021. The data time
step is 6 hours (4 step: 00,06,12,18 UTC), the
forecast time is 00 z UTC (or GMT+7).
Table 1. Parameterization diagram of the sign used in the simulation [1], [4]
Convection
Kain-Fritsch
Longwave radiation
RRTM
Shortwave radiation
Dudhia
Planetary boundary layer
Mellor-Yamada-Janjic
Soil
FAO 8km
Surface
Monin-Obukhov
Cloud microphysics
2.2. Data used and method of error assessment
GFS 0.5° input data is taken from the global
model at website address: ads.
ncep.noaa.gov/pub/data/nccf/com/gfs/para/
gfs.yyyymmddhh.
The observed temperature and rainfall data
are taken from 19 meteorological stations in the
South: Tan Son Nhat (Ho Chi Minh City), Tri An
(Binh Duong), Bien Hoa (Dong Nai), Tay Ninh,
Dong Phu (Binh Phuoc), Con Dao and Vung Tau
(Ba Ria - Vung Tau), Moc Hoa (Long An), My Tho
(Tien Giang), Cao Lanh (Dong Thap), Ba Tri (Ben
Tre), Cang Long (Tra) Vinh), Can Tho, Soc Trang,
Bac Lieu, Chau Doc (An Giang), Rach Gia and Phu
Quoc (Kien Giang), Ca Mau.
● Error assessment method:
Export the 48 hour forecast value for 19
station points, then calculate the average
forecast value of temperature and rainfall in the
Southern region. Actual temperature and rainfall
data collected at 19 stations are also averaged
for the Southern region.
Next, the study calculates the 48-hour
forecast error in the months of the rainy season
and in the months of the dry season according
to the following error formulas:
F: Forecast; O: Monitoring; N: Total number
of cases
▪ Mean Error (ME): Indicates the trend of
mean deviation of the predicted value from the
observed value
26
JOURNAL OF CLIMATE CHANGE SCIENCE
NO. 23 - SEP. 2022
WSM 6-class
(1)
▪ Mean absolute error (MAE): Represents the
mean amplitude of the model error
(2)
▪ Root-mean-square error (RMSE): Represents
the average size of the error. The closer the
RMSE is to the MAE, the more stable the model
error, and the model product correction can be
performed
(3)
3. Research results
Application of point weather forecast
model for the South from December 2020 to
November 2021. The factors studied and
evaluated include temperature and precipitation.
The forecast values of the above two factors are
evaluated according to 02 seasons: Rainy season
(from May to November), dry season (from
December 2020 to April).
The average 48-hour forecast results
from 19 stations in the southern region are
compared with the average monitoring data
at 19 stations, then averaged monthly and
divided into two seasons, through statistical
indicators. to evaluate the predictive power of
the model.
3.1. Meteorological forecast 48 hours in dry
season
Example of a dry season meteorological
forecast: 48 hour temperature forecast results
(forecast time - 00 z on February 8, 2021) for
the Southern region are shown in Figure 3 and
rainfall forecast results 48 hours is shown in
Figure 4.
The 24 hour forecast, February 8, 2021, the
Southeast region's temperature is 31 - 33oC,
night temperature is 22 - 24oC. Bien Hoa, Tay
Ninh, Dong Phu experience heavy rains, while
moderate rain is occurred in Tan Son Nhat and
no rain at the remaining stations. The average
humidity is about 73 - 75%. In the Soutwest
region, the day temperature is 29 - 31oC, the
night temperature is 22 - 25oC, the stations
with the highest day temperature are Ba Tri,
Cang Long, Soc Trang, Can Tho, Bac Lieu, Phu
00 z
Quoc and Rach Gia. Stations with the lowest
night temperature are Ca Mau, Chau Doc,
and Can Tho. Day and night without rain. The
average humidity is about 73 - 76.5%.
Forecast for the next 48 hours, on February 9,
2021, the Southeast region's day temperature is
31 - 33oC, night temperature is 22 - 24oC. Heavy
rain in Bien Hoa, Dong Phu, moderate rain in Tan
Son Nhat, Tay Ninh and no rain at the remaining
stations. Average humidity is around 73 - 75%.
In the Southwest region, the day temperature is
29 - 31oC, the night temperature is 22 - 25oC, the
stations with the highest day temperature are
Ba Tri, Cang Long, Soc Trang, Can Tho, Bac Lieu,
Phu Quoc and Rach Gia. The stations with the
lowest night temperature are Ca Mau, Chau Doc
and Can Tho. Day and night without rain. The
average humidity is about 73 - 76.5%.
Evaluation of meteorological forecast results
in the dry season (December 2020 - April 2021):
Figure 5 shows a negative ME error for the
maximum temperature forecast for the dry
season months, indicating the forecast value
is lower than the actual measurement. The
average MAE error value is 1.07oC. And the
average RMSE error value is 1.2oC. January has
the lowest RMSE error and April has the highest
RMSE error.
12 z
24 z
Figure 3. Temperature field at
forecast time on 08/02/2021
36 z
48 z
JOURNAL OF CLIMATE CHANGE SCIENCE
NO. 23 - SEP. 2022
27
00 z - 06 z
06z - 12 z
18 z - 24 z
24 z - 30 z
12 z - 18 z
30 z - 36 z
Figure 4. Cumulative rainfall
field from on February 8, 2021
36 z - 42 z
42 z - 48 z
Figure 5. Average maximum temperature error in dry season (oC)
28
JOURNAL OF CLIMATE CHANGE SCIENCE
NO. 23 - SEP. 2022
Figure 6 presents the forecast of the
minimum temperature in the dry season
months. ME error is negative, which means
that the forecast is lower than the actual
measurement. The average MAE error value
is 1.23oC and the average RMSE error value is
1.43oC. December has the lowest RMSE error
and March has the highest RMSE error.
Figure 6. Chart of average minimum temperature error in dry season (oC)
Figure 7. Error chart of average rainfall in dry season months (mm)
The precipitation forecast for the dry season
months (Figure 7) gives a negative ME error
(except for February), which means that the
forecast model is mostly lower than the actual
measurement. The average MAE error value is
10.55 mm and the average RMSE error value is
13.98 mm. January has the lowest RMSE error
and April has the highest RMSE error up to
43.35 mm.
3.2. Meteorological forecast 48 hours in rainy
season
Example of meteorological forecast for the
rainy season: 48 hour temperature forecast
results (forecast time - 00 z on July 14, 2021)
for the Southern region are shown in Figure 8
and rainfall forecast results 48 hours is shown in
Figure 9.
JOURNAL OF CLIMATE CHANGE SCIENCE
NO. 23 - SEP. 2022
29
00 z
12 z
24 z
Figure 8. Temperature field at
the forecast time on 14/7/2021
36 z
48 z
00 z - 06 z
06 z -12 z
12 z - 18 z
18 z - 24 z
24 z - 30 z
30 z - 36 z
Figure 9. Accumulated rainfall
field on 14/7/2021
36 z - 42 z
30
JOURNAL OF CLIMATE CHANGE SCIENCE
NO. 23 - SEP. 2022
42 z - 48 z
The 24-hour forecast on July 14, 2021, in the
Southeast region, the day temperature is 29.1 34.7oC, the night temperature is 22.3 - 27.1oC.
The station with the highest day temperature
is Tan Son Nhat, the station with the lowest
night temperature is Dong Phu. There is rain
in many places. The average humidity is about
72.7 - 82.05%. In the Southwest region, the day
temperature is 29.5 - 33.9oC, the night
temperature is 22.7 - 27.9oC. The station with
the highest day temperature is Moc Hoa, the
station with the lowest night temperature is
Cao Lanh. Heavy rain in Bac Lieu, Chau Doc, Soc
Trang and Moc Hoa have moderate rainfall, My
Tho, Cang Long experience insignificant rainfall,
while no rain at the remaining stations. The
average humidity is around 75.25 - 78.1%.
Forecast for the next 48 hours, on July 15,
2021, the Southeast region's daily temperature
is 28.7 - 34.9oC, night temperature is 23.5
- 26.8oC. The station with the highest day
temperature is Tan Son Nhat, the station with
the lowest night temperature is Dong Phu.
Heavy rainfall in Dong Phu and Tay Ninh, no rain
in Vung Tau and Con Dao , while the remaining
stations has moderate rainfall. The average
humidity is around 72.8-85.25%. In the
Southwest region, the daily temperature is
29.3 - 34.2oC. The night temperature is 23.5
- 27.2oC. The station with the highest day
temperature is Chau Doc, the station with the
lowest night temperature is Can Tho. Heavy
rainfall in Bac Lieu and Can Tho, no rain in Ca
Mau and Soc Trang, while the remaining
stations has moderate rainfall. The average
humidity is about 69 - 81%.
Evaluation of meteorological forecast results
in the rainy season (5/2021 - 11/2021):
Figure 10. Average maximum temperature error in rainy season (oC)
The maximum temperature forecast in the
rainy season (Figure 10) gives a negative ME error
(except for June and September), which means
that the forecast model is almost lower than the
actual measurement. The average MAE error
value is 0.49oC and the average RMSE error
value is 0.58oC. August has the lowest RMSE
error and June has the highest RMSE error.
Figure 11 indicates the forecast of the
minimum temperature in the rainy season
gives a negative ME error (except for July and
September), which means that the forecast
model is almost lower than the actual
measurement. The average MAE error value is
0.62oC and the mean RMSE error value is 0.74oC.
July has the lowest RMSE error and June has the
highest RMSE error.
Figure 12 shows that the rainfall forecast
in the rainy season gives a negative ME error
(except for May and June), which means the
forecast model is almost lower than the actual
measurement. The average MAE error value is
18.71 mm and the average RMSE error value
is 22.23 mm. November has the lowest RMSE
error and May has the highest RMSE error up to
31.21 mm.
JOURNAL OF CLIMATE CHANGE SCIENCE
NO. 23 - SEP. 2022
31
Figure 11. Chart of average minimum temperature error in rainy season (oC)
Figure 12. Error chart of average rainfall in rainy season months (mm)
4. Conclusion
In the dry season: WRF model predicts
maximum and minimum temperatures that are
lower than actual measurements. In the forecast
of the maximum temperature, the error value
MAE is 1.07oC and RMSE is 1.2oC. For the forecast
of the minimum temperature, the MAE error
value is 1.23oC and the RMSE error value is
1.43oC. Rainfall forecast in the dry season
months is mostly lower than the actual
measurement. The MAE error value is 10.55 mm
and the RMSE error value is 13.98 mm. April has
an RMSE error of up to 43.35 mm.
In the rainy season: WRF model predicts
the maximum temperature, the forecast value
is mostly lower than the actual measured. In
32
JOURNAL OF CLIMATE CHANGE SCIENCE
NO. 23 - SEP. 2022
the forecast of the maximum temperature, the
error value MAE is 0.49oC and RMSE is 0.58oC.
For the forecast of the lowest temperature,
the MAE error value is 0.62oC and the RMSE
error value is 0.74oC. Rainfall forecast in the dry
season months is mostly lower than the actual
measurement. The MAE error value is 18.71
mm and the RMSE error value is 22.23 mm. May
has an RMSE error of up to 31.21 mm.
Thus, the WRF model for predicting the
temperature is more reliable than the rain and
the temperature prediction error is lower than
the rain forecast. Rainy season rainfall forecast
gives higher error than dry season rainfall
forecast, conversely, rainy season temperature
forecast gives lower error than dry season
temperature forecast.
Acknowledgment: This study was completed within the framework of regular functional tasks in 2022.
Task 9: “Assess the trend of change of climate factors and review solutions to respond to climate change,
forecast waves, tides, saltwater intrusion in the Southern region”.
1.
2.
3.
4.
5.
References
Bao Thanh et al (2014), Research on integration of meteorological, hydrological and hydrographic
models in order to improve the quality of water level forecasting on the Dong Nai river system,
Ministry-level project.
Bui Minh Tang (2014), Research and develop technology to forecast heavy rain within 2-3 days for
early warning of floods in Central Viet Nam. State-level topics
Sub-Institute of Meteorology, Hydrology, and Climate Change (2021), Regular tasks by function
Evaluation of characteristics and developments of meteorological and hydrological factors in the
Southern region in 2021 and applicability of numerical methods in meteorological and hydrological
forecasting.
Truong Hoai Thanh, Nguyen Van Tin (2011), "Sensitivity survey of convective parameterization
schemes in WRF in rain forecast in Sai Gon - Dong Nai river basin", Viet Nam Journal of HydroMeteorology 6/2011.
Wee, T.-K., et al. (2012), "Two overlooked biases of the Advanced Research WRF (ARW) Model
in geopotential height and temperature". Mon. Wea. Rev., 140, 3907-3918, 10.1175/MWRD-12-00045.1.
JOURNAL OF CLIMATE CHANGE SCIENCE
NO. 23 - SEP. 2022
33