CHARACTERIZATION OF IMPURITIES AND DEGRADANTS USING MASS SPECTROMETRY pot
Bạn đang xem bản rút gọn của tài liệu. Xem và tải ngay bản đầy đủ của tài liệu tại đây (31.17 MB, 472 trang )
CHARACTERIZATION
OF IMPURITIES
AND DEGRADANTS USING
MASS SPECTROMETRY
WILEY SERIES ON PHARMACEUTICAL SCIENCE
AND BIOTECHNOLOGY: PRACTICES, APPLICATIONS,
AND METHODS
Series Editor:
Mike S. Lee
Milestone Development Services
Mike S. Lee ț Integrated Strategies for Drug Discovery Using Mass Spectrometry
Birendra Pramanik, Mike S. Lee, and Guodong Chen
ț Characterization of Impurities and
Degradants Using Mass Spectrometry
Mike S. Lee and Mingshe Zhu
ț Mass Spectrometry in Drug Metabolism and Disposition:
Basic Principles and Applications
pharmaceutical science-cp.qxd 12/8/2010 09:29 AM Page 1
CHARACTERIZATION
OF IMPURITIES
AND DEGRADANTS USING
MASS SPECTROMETRY
Edited by
Birendra N. Pramanik
Mike S. Lee
Guodong Chen
Copyright Ó 2011 by John Wiley & Sons. All rights reserved.
Published by John Wiley & Sons, Inc., Hoboken, New Jersey
Published simultaneously in Canada
No part of this publication may be reproduced, stored in a retrieval system, or transmitted in any form
or by any means, electronic, mechanical, photocopying, recording, scanning, or otherwise, except as
permitted under Section 107 or 108 of the 1976 United States Copyright Act, without either the prior
written permission of the Publisher, or authorization through payment of the appropriate per-copy fee
to the Copyright Clearance Center, Inc., 222 Rosewood Drive, Danvers, MA 01923, 978-750-8400,
fax 978-750-4470, oron the web at www.copyright.com. Requests to the Publisher for permissionshould be
addressed to the Permissions Department, John Wiley & Sons, Inc., 111 River Street, Hoboken, NJ 07030,
201-748-6011, fax 201-748-6008, or online at ttp://www.wiley.com/go/permission.
Limit of Liability/Disclaimer of Warranty: While the publisher and author have used their best efforts
in preparing this book, they make no representations or warranties with respect to the accuracy or
completeness of the contents of this book and specifically disclaim any implied warranties of mer-
chantability or fitness for a particular purpose. No warranty may be created or extended by sales
representatives or written sales materials. The advice and strategies contained hereinmay not be suitable for
your situation. You should consult with a professional where appropriate. Neither the publisher nor author
shall be liable for any loss of profit or any other commercial damages, including but not limited to special,
incidental, consequential, or other damages.
For general information on our other products and services or for technical support, please contact
our Customer Care Department within the United States at 877-762-2974, outside the United States
at 317-572-3993 or fax 317-572-4002.
Wiley also publishes its books in a variety of electronic formats. Some content that appears in print
may not be available in electronic formats. For more information about Wiley products, visit our web site
at www.wiley.com.
Library of Congress Cataloging-in-Publication Data:
Characterization of impurities and degradants using mass spectrometry /
edited by Birendra N. Pramanik, Mike S. Lee, Guodong Chen.
p. cm.
Includes index.
ISBN 978-0-470-38618-7 (cloth)
1. Drugs–Analysis. 2. Drugs–Spectra. 3. Mass spectrometry. 4.
Contamination (Technology) I. Pramanik, Birendra N., 1944- II. Lee, Mike
S., 1960- III. Chen, Guodong.
RS189.5.S65C53 2010
615’.l–dc22 2010023283
Printed in the United States of America
eBook ISBN: 978-0-470-92136-4
oBook ISBN: 978-0-470-92137-1
ePub ISBN: 978-0-470-92297-2
10987654321
CONTENTS
PREFACE xv
CONTRIBUTORS xvii
ACRONYMS xix
PART I METHODOLOGY
1. Introduction to Mass Spectrometry 3
Scott A. Smith, Ruth Waddell Smith, Yu Xia, and Zheng Ouyang
1.1. History 3
1.1.1. Atomic Physics 4
1.1.2. Early Applications 7
1.1.3. Organic Structural Analysis 7
1.1.4. The Biological Mass Spectrometry Revolution 8
1.2. Ionization Methods 9
1.3. Mass Spectrometer Types 10
1.3.1. Magnetic Sector Mass Spectrometers 10
1.3.2. Quadrupole Mass Filter and Quadrupole Ion Trap
Mass Spectrometers 14
1.3.3. Time-of-Flight Mass Spectrometers 19
1.3.4. Fourier Transform Ion Cyclotron Resonance
Mass Spectrometers 22
1.3.5. Orbitrap Mass Spectrometers 25
1.4. Tandem Mass Spectrometry 28
1.4.1. Ion Isolation 29
1.4.2. Ion-Molecule Collisions and Collision-Induced
Dissociation 30
1.4.3. Electron Capture Dissociation and Electron Transfer
Dissociation 32
1.5. Separation Techniques Couple d to Mass Spectrometry 35
1.5.1. Gas Chromatography–Mass Spectrometry 35
1.5.2. Liquid Chromatography–Ma ss Spectrometry 37
1.5.3. Capillary Electrophoresis–Mass Spectrometry 42
1.5.4. Ion Mobility Spectrometry–Mass Spectrometry 45
v
1.6. Prospects for Mass Spectromet ry 48
References 51
2. LC Method Development and Strategies 59
Gang Xue and Yining Zhao
2.1. Introduction 59
2.2. Column, pH, and Solvent Screening 60
2.2.1. Resolution: Goal of Separation 60
2.2.2. Screening: Systematic Approach to
Seeking Selectivity 60
2.2.3. Screening Instrumentation and Controlling Software 67
2.3. Gradient and Temperature Optimization 69
2.4. Orthogonal Screening 70
2.4.1. Method Orthogonality 71
2.4.2. Selection of Orthogonal Meth ods 72
2.4.3. Impurity Orthogonal Screening 74
2.5. High-Efficiency Separation 76
2.6. Conclusions 78
References 78
3. Rapid Analysis of Drug-Related Substances using Desorption
Electrospray Ionization and Direct Analysis in Real Time
Ionization Mass Spectrometry 81
Hao Chen and Jiwen Li
3.1. Introduction 81
3.2. Ionization Apparatus, Mechanisms, and General Performance 83
3.2.1. Desorption Electrospray Ionization (DESI) 83
3.2.2. Direct Analysis in Real Time (DART) 85
3.3. Drug Analysis in Biological Matrices using DESI and DART 87
3.3.1. DESI Application 88
3.3.2. DART Application 89
3.4. High-Throughput Analysis 92
3.5. Chemical Imaging and Profiling 94
3.6. Future Perspectives 101
References 101
4. Orbitrap High-Resolution Applications 109
Robert J. Strife
4.1. Historical Anecdote 109
4.2. General Description of Orbitrap Operating Principles 110
4.3. The Orbitrap is a “Fourier Transform” Device 112
vi CONTENTS
4.4. Performing Experiments in Trapping Devices 113
4.4.1. “Raw” HPLC Data Look Like Infusion Data 114
4.4.2. How Much Mass Resolution Should Be
Used During HPLC 114
4.5. Determining Elemental Compositions of “Unknowns” Using
an Orbitrap 115
4.6. Orbitrap Figures of Merit in Mass Measurement 117
4.6.1. Accuracy 117
4.6.2. Precision 118
4.6.3. Discussion 118
4.7. HPLC Orbitrap MS: Accurate Mass Demonstration and
Differentiation of Small Molecule Formulas Very
Proximate in Mass/Charge Ratio Space 121
4.8. Determination of Trace Contaminant Compositions by
Simple Screening HPLC-MS and Infusion
Orbitrap MS 122
4.9. Determining Substructure s: Orbitrap Tandem Mass
Spectrometry (MS
n
) 124
4.10. Multianalyzer (Hybridized) System: The Linear Ion
Trap/Orbitrap for MS/MS and Higher-Order MS
n
, n > 2 127
4.11. Mass Mapping to Discover Impurities 129
4.12. The Current Practice of Orbitrap Mass Spectrometry 131
4.13. Conclusion 132
References 132
5. Structural Characterization of Impurities and Degradation
Products in Pharmaceuticals Using High-Resolution LC-MS
and Online Hydrogen/Deuterium Exchange Mass
Spectrometry 135
Guodong Chen and Birendra N. Pramanik
5.1. Introduction 135
5.2. Characterization of Impurities 137
5.2.1. Mometasone Furoate 137
5.2.2. Enol Tautomer Impurity in Hepatitis C
Virus (HCV) Protease Inhibitor 152
5.3. Characterization of Degradation Products 155
5.3.1. Everninomicin 156
5.3.2. Posaconazole 164
5.4. Conclusions 176
References 177
CONTENTS vii
6. Isotope Patten Recognition on Molecular Formula
Determination for Structural Identification of Impurities 183
Ming Gu
6.1. Introduction 183
6.2. Three Basic Approaches to Isotope Pattern Recognition 184
6.2.1. With Centriod Data 185
6.2.2. With Profile Data without Peak Shape Calibration 187
6.2.3. With Profile Data with Peak Shape Calibration 189
6.3. The Importance of Lineshape Calibration 190
6.3.1. Lineshape Calibration Using Standards 191
6.3.2. Lineshape Self-Calibration 193
6.4. Spectral Accuracy 194
6.5. Formula Determination with Quadrupole MS 194
6.5.1. Impurity Identification with LC-MS 195
6.5.2. Impurity Identification with GC-MS 200
6.5.3. Pros and Cons of Determination of Elemental
Decomposition (DEC) with Quadrupole MS 201
6.6. Formula Determination with High-Resolution MS 203
6.7. Conclusions and Future Directions 208
References 208
PART II APPLICATION
7. Practical Application of Very High-Pressure Liquid
Chromatography Across the Pha rmaceutical
Development–Manufacturing Continuum 215
Brent Kleintop and Qinggang Wang
7.1. Introduction 215
7.2. Theory and Benefits of VHPLC 217
7.3. VHPLC Method Development 220
7.3.1. Adapting Existing HPLC Methods to VHPLC 220
7.3.2. Developing New VHPLC Methods 224
7.4. Other Practical Considerations 226
7.5. VHPLC Method Validation 227
7.6. Summary 229
References 229
8. Impurity Identification for Drug Substanc es 231
David W. Berberich, Tao Jiang, Joseph McClurg, Frank Moser,
and R. Randy Wilhelm
8.1. Introduction 231
viii CONTENTS
8.2. Case Studies 232
8.2.1. Identification of Impurities in Each Synthetic
Step of Drug Substance during Process Development 232
8.2.2. Impurity ID by LC/MS during Exploratory
Chemistry: Evaluation of New Raw Materials 237
8.2.3. Impurity Identification during Accelerated
Stability Studies 243
8.3. Conclusions 249
References 250
9. Impurity Identification in Process Chemistry
by Mass Spectrometry 251
David Q. Liu, Mingjiang Sun, and Lianming Wu
9.1. Introduction 251
9.2. Experimentation 252
9.2.1. Liquid Chromatography Cond itions 252
9.2.2. LC-MS Systems 253
9.2.3. GC-MS System 253
9.2.4. Accurate Mass 253
9.2.5. Online H/D Exchange LC-MS 254
9.3. Applications 254
9.3.1. Identification of Reaction Byproducts
by Data-Dependent LC/MS
n
254
9.3.2. Online H/D Exchange Aids Structural Elucidation of
Process Impurities 257
9.3.3. LC-MS for Chemical Reaction Impurity Fate Mapping 260
9.3.4. GC-MS for Impurity Profiling of Small-Molecule
Starting Materials 262
9.3.5. Identification of a Process Impurity that Impacts
Downstream Formulation 265
9.3.6. Differential Fragmentation between Sodiated
and Protonated Molecules as a Means of Structural
Elucidation 267
9.4. Concluding Remarks 275
Acknowledgments 275
References 276
10. Structure Elucidation of Pharmaceutical Impurities
and Degradants in Drug Formulation Dev elopment 279
Changkang Pan, Frances Liu, and Michael Motto
10.1. Importance of Drug Degradation Studies in Drug Development 279
10.2. Drug Degradation Studies in Formulation Development 281
CONTENTS ix
10.2.1. Drug Substance–Excipient Interaction 281
10.2.2. Small Unknown Peaks (0.1%) (Low-Dose Drugs
<1 mg per Dose) 282
10.2.3. “Busy” LC Chromatogram with Multiple Peaks
(Combination Drug Products) 282
10.2.4. Modification of Non-MS-Compatible LC Methods 282
10.2.5. Uncontrollable Multiple Chemical Reactions in
Stability Samples 283
10.2.6. Separation Interference and Contamination
Induced by Excipients 283
10.2.7. Peak Isolation and NMR Confirmation for
Late-Phase Projects 284
10.3. Complexity of Impurity Identification in Drug Development 284
10.3.1. Drug Substance (DS) Degradation 284
10.3.2. DS–Excipient Interaction 285
10.3.3. DS–Residual Solvent Interaction 287
10.3.4. DS–Solvent Impurity Interaction 287
10.3.5. Metal Ion–Catalyzed Reaction 289
10.3.6. DS–Excipient Impurity Interaction 289
10.3.7. DS–Salt Interaction 291
10.3.8. DS–Preservative Interaction 291
10.3.9. Preservative–Excipient Interaction 292
10.3.10. Excipient Degradation 292
10.3.11. Leachables and Extractables 293
10.4. Strategy for Structure Elucidation of Unknowns 295
10.4.1. Non-MS-Compatible Method versus MS-Compatible
Method 295
10.4.2. Selection of Ionization Mode (ESI or APCI,
Positive or Negative) 298
10.4.3. Multiple Approaches for Structure Elucidation 298
10.4.4. Structure Confirmation 299
10.5. Hyphenated Analytical Techniques Used in Drug Development 300
10.5.1. LC-MS/MS for Fragmentation Pathways 302
10.5.2. High-Resolution MS for Chemical Formula/Elemental
Composition 302
10.5.3. SEC/CLND or HPLC/CLND: Nitrogen-Specific
Detection 304
10.5.4. GC-MS with EI-CI Combination 305
10.5.5. Headspace GC-MS: Volatile Compounds 305
10.5.6. NMR and LC-NMR 306
10.5.7. TD-GC/MS: Chemical Reactions Attributing
to Weight Loss in TGA 307
10.6. Case Studies 307
x CONTENTS
10.6.1. LC-MS, GC-MS, and LC-NMR Studies of a Drug
Degradation Product 307
10.6.1.1. LC-MS Analysis 308
10.6.1.2. GC-MS Analysis 308
10.6.1.3. LC-NMR Analysis 308
10.6.2. Strategy for Identification of Leachables in
Packaged Liquid Formulation 313
10.6.3. Characterization of Methionine Oxidation in
Parathyroid Hormone Formulation 316
10.6.3.1. Oxidation, Isolation, and Digestion
of PTH1-34 316
10.6.3.2. Mass Assignment of PTH1-34 Oxidized
Variants 317
10.6.3.3. Mass Assignment of CNBr Digested
Peptide Fragments 318
10.6.3.4. LC-MS/MS Studies of Ion Fragments
from Oxidized Peptides 322
Acknowledgment 326
References 326
11. Investigation of Degradation Products and Extractables
in Developing Topical OTC (Over the Count er) and NCE
(New Chemical Entity) Consumer Healthcare
Medication Products 337
Fa Zhang
11.1. Introduction 337
11.2. Oxidatively Induced Coupling of Miconazole Nitrate
with Butylated Hydroxytoluene in a Topical Ointment 338
11.2.1. HPLC-MS Screening 339
11.2.2. Organic Synthesis 341
11.2.3. Degradation Mechanism 344
11.3. Extractables from Rubber Closures of a Prefilled
Semisolid Drug Applicator 347
11.3.1. Isolation of the Extractables 348
11.3.2. Structural Identification of Extractables 5 and 6 348
11.3.3. Structural Identification of Extractables 7 and 8 349
11.3.4. Structural Identification of Extractable 9 351
11.4. New Degradation Products and Pathways of Vitamin D and
Its Analogs 352
11.4.1. Thermal Isomerization of Vitamin D
3
in DMSO 355
11.4.2. Autoxidation of Isotachysterol 356
CONTENTS xi
11.4.2.1. Mechanism of Isotachysterol
Autoxidation 362
11.4.3. Thermal Degradation of Ecalcidene 364
11.4.4. Acid-Induced Degradation of Ecalcidene 368
11.4.5. Iodine-Induced Degradation of Ecalcidene 370
11.4.5.1. cis/trans-Isomerization of Ecalcidene 371
11.4.5.2. cis/trans-Isomerization of Previtamin
D3–Type Isomer 24 372
11.5. Reductive Degradation of a 1,2,4-Thiadiazolium
Derivative 376
11.6. Conclusions 382
References 383
12. Characterization of Impurities and Degradants in
Protein Therapeutics by Mass Spectrometry 391
Li Tao, Michael Ackerman, Wei Wu, Peiran Liu, and Reb Russell
12.1. Introduction to Therapeutic Proteins 391
12.2. Recent Advances in Mass Spectrometry 392
12.3. Impurities 393
12.3.1. Endotoxin 394
12.3.2. Residual DNA 394
12.3.3. Residual HCP 395
12.4. Degradation Products 395
12.4.1. Chemical Degradation 396
12.4.1.1. Deamidation/Isomerization 396
12.4.1.2. Protein Fragmentation 400
12.4.1.3. Oxidation 401
12.4.2. Variants Caused by Posttranslational Modification 404
12.4.2.1. Case Study: Characterizat ion of
S-Thiolation on Secreted Proteins from
E. coli 406
12.4.2.2. TM307 408
12.4.2.3. TM485 408
12.4.2.4. TM358 and TM687 410
12.5. Conclusions 413
References 413
13. Identification and Quantification of Degradants
and Impurities in Antibodies 427
David M. Hambly and Himanshu S. Gadgil
13.1. Introduction to Antibodies and Protein Drugs 427
xii CONTENTS
13.1.1. Antibody Classification and Subtypes 427
13.1.2. Antibody Structure 428
13.1.3. Antibody-Domain Structure 429
13.1.4. Recombinant Antibody Production 429
13.1.5. Methods for Characterizing Antibody Degradation
and Impurity 430
13.2. Overview of Degradations and Impurities
in Protein Drugs and Antibodies 431
13.2.1. Chemical Degradations and Impurities 431
13.2.1.1. Methionine Oxidation 431
13.2.1.2. Disulfide Bonds or Reduced Cysteine 432
13.2.1.3. Deamidation of Asparagine and
Glutamine 432
13.2.1.4. Isomerization of Aspartic Acid and
Glutamic Acid 433
13.2.1.5. Amide Backbone Hydrolysis Reactions 433
13.2.1.6. Glycation of Lysine Residues 433
13.2.1.7. C-Terminal Lysine Variants 434
13.2.1.8. Carbohydrate Variants 434
13.3. Methods Used to Identify and Quantitate Degradations and
Impurities 435
13.3.1. Whole-Protein Mass Analysis Methods 435
13.3.1.1. Carbohydrate Variation 435
13.3.1.2. Detection of Lysine C-terminal Variants
and Glycated Lysine 437
13.3.1.3. Detection of Disulfide Bond Variants
in IgG2 Antibodies 437
13.3.2. Methods for Evaluating the Mass of Protein
Fragments 438
13.3.2.1. Limited Digestion Method for Antibodies 438
13.3.2.2. Limited and Reduced Method for
Antibodies 440
13.3.2.3. Reduced Protein Mass Analysis 441
13.3.3. Methods for Evaluating Peptides for Impurities
and Degradations 443
13.3.3.1. Reduced and Alkylated Peptide Mapping 443
13.4. Conclusions 450
Appendix 450
References 453
INDEX 461
CONTENTS xiii
PREFACE
During the past decade, new formats for automated, high-throughput sample genera-
tion combined with a faster pace of drug development led to a shift in sample analysis
requirements from a relatively pure sample type to a trace mixture. Mass spectrome-
try–based technologies played a significant role in this transition and assumed a
critical role in pharmaceutical analysis throughout each stage of drug development
ranging from drug discovery to manufacturing. A critical part of the development and
support of a marketed product is the analysis of impurities and degradation products.
Structural information on drug impurities can serve to accelerate the drug discovery–
development cycle. The use of chromatographic methods such as high-performance
liquid chromatography (HPLC) has long been a hallmark of impurity and degradant
analysis. HPLC is often used to profile and classify molecules and work in concert
with mass spectrometry to assist with the elucidation of structure. Identification of
resulting impurities is based on direct comparison of the mass spectrometric
fragmentation of the impurity with the parent drug tandem mass spectrometry
(MS/MS) fragmentation patterns. The use of rapid and systematic strategies based
on hyphenated analytical techniques such as liquid chromatography–mass spectrom-
etry (LC-MS) profiling and liquid chromatography–tandem mass spectrometry
(LC-MS/MS) substructural techniques has become a standard analytical platform
for impurity identification activities. We are delighted to highlight current analytical
approaches, industry practices, and modern strategies for the identification of
impurities and degradants in drug development of both small-molecule pharmaceu-
ticals and protein therapeutics. We provide an ensemble of analytical applications that
require the combination of separation techniques and mass spectrometry methods that
reflect achievements in impurity and degradant analysis.
We would like to acknowledge the special efforts of all the authors who have made
significant contributions to this book. Special thanks go to the acquisitions and
production editors at John Wiley & Sons, Inc. for their assistance.
B
IRENDRA N. PRAMANIK
MIKE S. LEE
GUODONG CHEN
xv
CONTRIBUTORS
Michael Ackerman, Bristol-Myers Squibb Company, Pennington, NJ
David W. Berberich, Covidien, St. Louis, MO
Guodong Chen, Bristol-Myers Squibb Company, Princeton, NJ
Hao Chen, Department of Chemistry and Biochemistry, Ohio University, Athens, OH
Himanshu S. Gadgil, Amgen Inc., Seattle, WA
Ming Gu, Cerno Bioscience, Danbury, CT
David M. Hambly, Amgen Inc., Seattle, WA
Tao Jiang, Covidien, St. Louis, MO
Brent Kleintop, Bristol-Myers Squibb Company, New Brunswick, NJ
Mike S. Lee, Milestone Development Services, Newtown, PA
Jiwen Li, Department of Chemistry and Biochemistry, Ohio University, Athens, OH
David Q. Liu, GlaxoSmithKline, King of Prussia, PA
Frances Liu, Novartis, East Hanover, NJ
Peiran Liu, Bristol-Myers Squibb Company, Pennington, NJ
Joseph McClurg, Covidien, St. Louis, MO
Frank Moser, Covidien, St. Louis, MO
Michael Motto, Novartis, East Hanover, NJ
Zheng Ouyang, Department of Biomedical Engineering, Purdue University, West
Lafayette, IN
Changkang Pan, Novartis, East Hanover, NJ
Birendra N. Pramanik, Merck and Co., Kenilworth, NJ
Reb Russell, Bristol-Myers Squibb Company, Pennington, NJ
Ruth Waddell Smith, Department of Chemistry, Michigan State University, East
Lansing, MI
xvii
Scott A. Smith, Department of Chemistry, Michigan State University, East Lansing,
MI
Robert J. Strife, Procter & Gamble, Mason, OH
Mingjiang Sun, GlaxoSmithKline, King of Prussia, PA
Li Tao, Bristol-Myers Squibb Company, Pennington, NJ
Qinggang Wang, Bristol-Myers Squibb Company, New Brunswick, NJ
R. Randy Wilhelm, Covidien, St. Louis, MO
Lianming Wu, GlaxoSmithKline, King of Prussia, PA
Wei Wu, Bristol-Myers Squibb Company, Pennington, NJ
Yu Xia, Department of Chemistry, Purdue University, West Lafayette, IN
Gang Xue, Pfizer Inc., Groton, CT
Fa Zhang, Johnson & Johnson, Skillman, NJ
Yining Zhao, Pfizer Inc., Groton, CT
xviii CONTRIBUTORS
ACRONYMS*
ADCC antibody-dependent cell-mediated cytotoxicity
ADME adsorption, distribution, metabolism, excretion
AGC automatic gain control
AGE advanced glycation endproduct
AHOT axial harmonic orbital trapping
ANDA abbreviated new-drug application
APCI atmospheric-pressure chemical ionization (DAPCI—desorption
APCI)
API atmospheric-pressure ionization
APTDI atmospheric-pressure thermal desorption/ionization
ASAP atmospheric solid analysis probe
AUC analytical ultracentrifugation
CDC complement-dependent cytotoxicity
CDR complementarity-determining region
CE capillary electrophoresis
Cf continuous flow
CHO Chinese hamster ovary
CI chemical ionization; chemical impact
CID collision-induced dissociation
CIT cylindrical ion trap
CLND chemiluminescent nitrogen detector
COM center of mass
COSY correlation spectroscopy
CV coefficient of variation
CZE capillary-zone electrophor esis
DAD diode array detection
DAPPI desorption atmospheric-pressure photoionization
DART direct analysis in real time
DBDI dielectric barrier discharge ionization
DE delayed extraction
DEC determination of elemental (de)composition
DEPT distortionless enhancement by pola rization transfer
*
Partial list only; common terms (IR, HLC, GC, NMR, RF, etc.), proper names (FDA, NIST, etc.), and
chemical compounds (SDS, TCA, etc.) omitted here.
xix
DESI desorption electrospray ionization (FD-DESI—fused-droplet
DESI; MALDESI—matrix-assisted laser DESI)
DeSSI desorption sonic spray ionization
DLI direct liquid introduction
DOE design of experiment(s)
DS drug substance
ECD electron capture dissociation
EESI extractive electrospray ionization (ND-EESI—neutral
desorption EESI)
EI electron impact
EIC electrospray ionization chromatography
ELDI electrospray-assisted desorption/ionization
ESSI electrosonic spray ionization
ETD electron transfer dissociation
EU enzyme unit
FAB fast-atom bombardment
FFF field flow fractionation
FIDI field-induced droplet ionization
HAPGDI helium atmospheric-pressure glow discharge ionization
HC/LC heavy chain/light chain
HCD higher-energy C-trap (or collision-induced) dissociation
HCP host cell protein
HCV hepatitis C virus
HF/LF high field/low field
HIC hydrophobic interaction chromatography
HMBC heteronuclear multibond coherence
HTS high-throughput screening
IAA isotope abundance analysis
ICP inductively coupled plasma
ICR ion cyclotron resonance
IE/KE internal energy/kinetic energy
IEC ion exchange chromatography
IEF isoelectric focusing
ILA immunoligand assay
IMS ion mobility spectrometry
JeDI jet desorption ionization
LAESI laser ablation electrospray ionization
LAL limulus amebocyte lysate
LMC liquid microjunction chromatography
LOD limit of detection
LSIMS liquid secondary ionization mass spectrometry
LTP low-temperature plasma
LTQ linear trap quadrupole
mAb monoclonal antibody
MAGIC monodisperse aerosol generation interface for chromatography
xx ACRONYMS
MALDI matrix-assisted laser desorption/ionization
MCP microchannel plate
MDD maximum daily dose
MP model protein
MPD multiphoton dissociation
MPPSIRD mass peak profiling from selected ion recording data
MSD mass spectrometry detector
NCE new chemical entity
NDA new-drug application
NI/PI negative ion/positive ion
NMP next maximum projection
NOE nuclear Overhauser effect
NOESY nuclear Overhauser enhancement spectroscopy
OT open tubular
OVAT one variable at a time
PADI plasma-assisted desorption/ionization
PAGE polyacry lamide gel electrophoresis
PB particle beam
PCA principal-components analysis
PDAD photodiode array detection
PDM pharmaceutical development–manufacturing
PDMS plasma desorption mass spectrometry
PET positron emission tomography
PGM profile generation model
PPC practical peak capacity
PPIPPN pulsed positive ion–pulsed negative ion
PTM posttranslational modification
QIT quadrupole ion trap
QMF quadrupole mass filter
rFC recombinant factor C
RIC reconstructed ion chromatogram
RIT rectilinear ion trap
RP reversed phase
RRT relative retention time
RSD relative standard deviation
RT retention time
SA spectral accuracy
SEC size exclusion chromatography
SFC supercritical fluid chromatography
SID surface-induced dissociation
SIMS secondary-ion mass spectrometry
SMB supersonic molecular beam
SPE solid-phase extraction
SSP surface sampling probe
SWIFT stored waveform inverse Fourier transform
ACRONYMS xxi
TDC time-to-digital converter
TGA thermogravimetric analysis
TIC total-ion chromatogram
TOF time of flight (oaTOF—orthogonal acceleration TOF;
reTOF—reflectron TOF)
VOC volatile organic compound
WBA whole-body autoradiography
xxii ACRONYMS
PART I
METHODOLOGY
CHAPTER 1
Introduction to Mass Spectrometry
SCOTT A. SMITH
Department of Chemistry, Michigan State University, East Lansing, MI 48824
RUTH WADDELL SMITH
Forensic Science Program, School of Criminal Justice, Michigan State University,
East Lansing, MI 48824
YU XIA
Department of Chemistry, Purdue University, West Lafayette, IN 47907
ZHENG OUYANG
Weldon School of Biomedical Engineering, Purdue University, West Lafayette, IN 47907
1.1 HISTORY
Although mass spectrometry (MS) has aged by about one century, it has never ceased
to evolve into an increasingly powerful and important technique for chemical
analysis. The development of mass spectrometry can be folded into a few periods,
where the capabilities of a particular discipline of science were advanced significantly
and steadily due to the introduction of MS into that field. Those periods are,
approximately, physics (1890s–1945), chemistry (1945–1975), materials science
(1955–1990), and biology/medicine (1990–present) [1]. The history of MS shows
that the technique has facilitated many significant scientific achievements, from the
discovery of isotopes [2], to purifying the material for the first atomic bombs [3], to
space exploration [4,5], to the mass analysis of whole red blood cells each weighing
several tens of picograms [6]. The following is a short account of some of the notable
feats that have transpired in this field.
Characterization of Impurities and Degradants Using Mass Spectrometry, First Edition.
Edited by Birendra N. Pramanik, Mike S. Lee, and Guodong Chen.
Ó 2011 John Wiley & Sons, Inc. Published 2011 by John Wiley & Sons, Inc.
3
1.1.1 Atomic Physics
The technique now known as MS has its roots in atomic physics at the beginning of
the twentieth century, when it was originally applied by physicists toward answering
questions on the nature of atoms. Throughout much of the 1800s, the prevailing
wisdom held that atoms were indivisible, that all atoms of a given element had the
same mass, and that the masses of all elements were multiples of the mass of
hydrogen [7–9]. Despite these beliefs, the interrogation of bulk elements through
chemical means (gravimetric analyses) demonstrated that some atomic masses were,
in fact, not unit integers of that of hydrogen (e.g., chlorine). Furthermore, for much of
the century, relatively little was known of the nature and origins of electricity.
Hence, the explanations for these phenomena awaited the discovery of electrons
and isotopes through physical investigations.
Toward the end of the 1800s, many physicists were interested in unraveling the
underlying principles of electricity. To study the properties of electric currents, they
would create a potential difference between two electrodes in partially evacuated
discharge tubes made of glass and containing various types of gas. Evidence for
cathode rays (electron beams) was first observed by Pl
€
ucker in 1859 when he
noticed a green p hosphorescence occurring on his discharge chamber at a position
adjacent to the cathode [10]. In time, the investigations of other physicists led to an
accumulation of clues about the nature of cathode rays, including observations
that (1) they are directional, moving from the cathode to the anode, (2) they are
energetic, as determined by observing platinum foil becoming white-hot when
placed in their path, (3) they conduct negative charge, as determined by measure-
ment with electrometer s, (4) they are particles rather than waves, (5) their energy is
proportional to the acceleration potential to which they are subjected, (6) they have
dimensions that are smaller than those of atomic gases, as determined by consider-
ing their penetration d epth through media of varying density, and (7) they may be
derived from any atom through various means, including heat, X rays, or electr ical
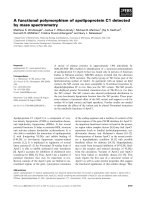
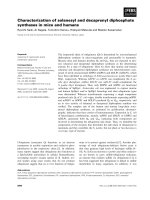
disch arge [10]. Thomson went on to develop the means for measuring electron mass
in a discharge chamber evacuated to low pressure (see Figure 1.1) [11]. By applying
amagneticfield(B ) and an electric field (E), both at right angles to each other as well
as to the direction of electron propagation, they could det ermine the e lectron
velocity (v) by canceling out the deflections of the magnetic and electric forces (i.e.,
|Bev ÀEe| ¼0) such that the electrons travel in a straight line, yielding v ¼E/B. The
ratio of electron m ass to el ectr on ch arge (m
e
/z) could also be arrived at from
experimental measurements as ðm
e
=eÞ¼ðB
2
l=EqÞ,wherel is the distance traveled
by an electron thr ough a un iform elect ric field and q is the angle through which
electrons are deflected as they exit the electric field [11]. From this and other
experiments, Thomson demonstrated that the mass of electrons are about
1
1000
th(0.001%) that of the proton (the mas s of protons, the ionized form of the
smallest known particles at the time, was by then known from electrolysis
research) [11]. Thomson was awarded the 1906 Nobel Prize in Physics “in
recognition of his theoretical and experimental investigations on the conduction
of electricity by gases” [12].
4 INTRODUCTION TO MASS SPECTROMETRY
While progressing toward an understanding of electrons, physicists also became
interested in understanding the positively charged particles (cations) that were present
in discharges [13]. During studies of the effects of weak magnetic fields on cathode
rays in 1886, Goldstein discovered positively charged anode rays that traveled in the
opposite direction of electrons; unlike cathode rays, these anode rays were not
susceptible to deflection by the weak magnetic fields used in Goldstein’s experi-
ments [14]. However, in 1898, Wein determined that anode rays in fact could be
influenced by the presence of magnetic fields, provided the fields were relat ively
strong; with this knowledge, he determined that their masses were on the order of
atoms rather than the substance of which cathode rays were composed [14]. Building
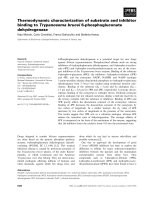
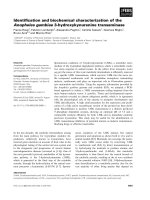
on such early observations, Thomson created a device called the parabolic mass
spectrograph (see Figure 1.2), in which he exposed anode rays to parallel magnetic
and electric fields in such a way that, while propagating through the field region the
rays were influenced vertically by the electric field and horizontally by the magnetic
field, with the result that the ions impinged on a photographic plate positioned
transverse to the direction of particle propagation [14]. The images on the plate were
of parabolas, in which each particular parabola was specific for mass-to-charge ratio
(m/z) and the occurrence of parabolic lines was attributed to distributions in kinetic
energy [14]. Thomson’s device was capable of identifying the presence of ionized
gases, and he demonstrated its capabilities by acquiring a mass spectrograph of the
mixture of gases constituting the atmosphere [14]. Notably, Thomson’s atmospheric
data showed the first instance of the rare isotope
22
Ne (neon-22) adjacent to the
predominant
20
Ne; since he believed that stable elements could have only a single
mass (a then widely held belief), he assumed that what was conventionally considered
neon was actually a mixtu re of two elements, with that at mass 22 being previously
unknown [2,14]. Shortly before this time, Rutherford and Soddy discovered nuclear
transmutation, whereby fission products from radioactive elements produce as
products chemically distinguishable elements of abnormal mass (i.e., isotopes) [15];
however, given the unusual nature of radioactive matter at the time of Thomson’s
observation, the link was not obvious that neon atoms could occur as distributions
FIGURE 1.1 Thomson’s apparatus for measuring electron mass-to-charge ratio (m/z).
Components are as follows: (A, B) anodes with pinhole apertures to guide and narrow
the beam; (C) cathode; (P, P
0
) electric field deflection electrodes; (S) detection screen. The
magnetic field, when applied, was directed orthogonally to both the electron beam and
the electric field (indicated by the tickmarks x). (Reprinted from Ref. 10, with permission
of John Wiley & Sons, Inc.)
HISTORY 5
of varying mass. It wasn’t until 1919, when Aston built an improved mass spectro-
graph and discovered the isotopes of dozens of elements, that isotope theory became
widely accepted by the scientific community [16]. When he published the results of
the measurements of the first 18 elements that he investigated, Aston demonstrated
that they all were within
1
1000
th of whole-number units, with the exception of hydrogen,
which has a very slight deviation from the whole-number trend [16]. For his efforts
toward proving the existence of isotopes, Aston won the 1922 Nobel Prize in
Chemistry.
The first breakthroughs in MS were made using equipment that required manual
measurements of mass based on visual observation or the interpretation of photo-
graphic records that were prone to indicating disproportionate signal intensities based
on the species analyzed [13]. These issues were resolved with the development of the
first mass spectrometer, by Thomson, in 1912 [13,17]. Rather than detecting on an
image plane under conditions of constant field strength (as in the mass spectrograph),
in Thomson’s mass spectrometer the field strengths to which the ions were exposed
could be systematically varied while the ion intensities were acquired as electric
current using an electrometer positioned behind a plate containing a parabolic slit [13].
This modification also removed a mass dependence on detection intensity, as a signal
intensity bias existed on the photographic plates of the spectrograph that favored ions
of lower mass, a feature that would be critically detrimental to accurate measurements
of relative abundance [13].
As time passed, other physicists made improved mass spectrometers. In 1918,
Dempster built a mass spectrometer featuring electronic detection and a 180
magnet
capable of resolution values of around 100 (for atomic-range masses) [17]. Aston
FIGURE 1.2 Ion separations on Thomson’s parabolic mass spectrograph. Components are
as follows: (I) insulator; (M, N) magnet poles; (P, P
0
) electric field deflection electrodes; (S)
detection screen. The position of ion impact (shown here for two species labeled m
1
and m
2
)on
the screen was dependent on ion charge and kinetic energy, the electric and magnetic field
strengths, and the dimensions of L and D. (Reprinted from Ref. 10, with permission of John
Wiley & Sons, Inc.)
6
INTRODUCTION TO MASS SPECTROMETRY