Báo cáo "A GRAPHICAL EDITOR FOR THE STATECHARTS LANGUAGE " doc
Bạn đang xem bản rút gọn của tài liệu. Xem và tải ngay bản đầy đủ của tài liệu tại đây (386.28 KB, 9 trang )
VNU. JOURNAL OF SCIENCE, Mathematics - Physics, T.xXI, n
0
3, 2005
1
A GRAPHICAL EDITOR FOR THE STATECHARTS LANGUAGE
Tran Vu Viet Anh
Research and Development Division, VietSoftware Inc., Hanoi
Nguyen Viet Ha
Faculty of Information Technology, College of Technology, VNU
Abstract. Statecharts is a specification language which is derived from finite–
state machines and it is a powerful visual formalism for specifying discrete
event systems. Statechart diagrams capture the behaviour of entities by
specifying the responses to possible event instances. Statecharts language has
also a lot of features for diagram structure. Until now, some tools and software
are developed to construct Statechart diagrams, however, they are neither
complicated nor difficult. This paper presents a new graphical editor for the
Statecharts graphical language with hierarchy, flexibility, and simplicity.
1. Introduction
Statechart [3, 4] is a powerful visual formalism for specifying discrete event
systems. It retains the visual and intuitive appeal inherent for state transition
systems and extends these systems in three ways: Hierarchy, Orthogonal
(concurrency), and Broadcast communication. Statechart diagrams capture the
behaviour of entities by specifying the responses to possible event instances.
Statechart descriptions can be readily simulated and translated into other
programming languages.
As a good role of Statecharts for a hardware specification language and
discrete event systems, there are many approaches to build a tool/software that
make use of Statecharts. However, produced tools are someway inconvenient like:
cannot handle a large diagram, quite old or no longer support, typical costly…
In order to make our project of mapping Statecharts into Verilog [11 - 13], we
have built a Statecharts editor with three main purposes:
• First, of course is for editing Statecharts diagrams. The editor should be
convenient to use and easy to draw. It should also allow other components
of Statecharts diagram to be drawn.
• Second, it should also be easy to export textual representation of
Statecharts. This is used by the mapping algorithm which converts
Statecharts to abstract Verilog.
• Third, it should be easy to save the Statecharts to other graphical formats
(like bmp, jpg, ps, eps, etc). This is important for portability and
documentation.
Tran Vu Viet Anh, Nguyen Viet Ha
2
From these requirements, we built Statechart_E as an add–on/embedded
stencil in Microsoft Visio. We make use of MS. Visio because Visio is a very
powerful graphical editor tool for drawing diagrams. Visio also supports many
graphical formats for exporting our diagrams. Moreover, using Visio, we can not
draw only Statecharts components but also other shapes from suitable drawing
types or stencils.
In the next section we will brief by introduce the Statecharts language and its
components. Then we introduce our tool to draw Statecharts diagram and its
features. In the last two sections we discuss some related works and give conclusion.
2. Statecharts
2.1. Statecharts
Statecharts is a specification language derived from finite–state machines.
The language is rather rich in features including state hierarchy and concurrency.
Transitions can perform nontrivial computations unlike finite–state machines from
which where they contain at most input/output pairs. In this section, we will
describe Statecharts presented by David Harel [3, 4].
Statechart diagrams capture the behaviour of entities capable of dynamic
behaviour by specifying their responses to the event occurrences. Typically, it is
used for describing the behaviour of classes, but Statecharts may also describe the
behaviour of other model entities such as use cases, actors, subsystems, operations,
or methods.
As already mentioned, Statecharts is extensible by hierarchy, orthogonality or
broadcast communication. In this paper, we use the formal syntax of Statechart
from [4]. The syntax of Statecharts formula is defined as follows:
S : a set of names used to denote Statecharts. This is expected to be large
enough to prevent name conflicts.
e
Π
: a set of all abstract events (signals). We also introduce another set to
denote the set of negated counterparts of events in
e
Π
, i.e.
}|{
edfe
ΠeeΠ
∈
=
,
where
e
denotes the negated counterpart of event
e
, and we assume
ee
=
.
a
Π
: a set of all assignment actions of the form
exp
=
v
.
ValVar
→
:
σ
is the valuation function for variables, where
Var
is the set of
all variables,
Val is the set of all possible values for variables. A snapshot for
variables
v
is
)(v
σ
.
T
: a set of transitions.
A term–based syntax of Statecharts was introduced in [8, 9, 11]. We re–
introduce it here for the benefit of the reader. The set SC is a set of Statecharts
terms that is constructed by the following inductively defined functions.
A graphical edior for the statecharts language
3
[]
[]
[] []
{} {}
df
1lnl df 1lnl
SC
1ndf 1n
Basic : SC
Basic(s) s
Or : SC T SC
Or(s, p , , p , , p , p , T) s : p , , p , , p , p
,T
And : 2 SC
And(s, p , , p ) s : p , , p
→
=
××→
=
×→
=
S
S
S
Note that:
-
(
)
sBasic
: denotes a basic Statechart named s.
-
[
]
(
)
Tpppps
inl
,,, ,, ,,Or
1
: represents an Or–Statechart with a set of sub–
states
{
}
n
pp , ,
1
, where p
1
is the default sub–state, p
i
is the current active sub–
state, T is composed of all possible transitions among immediate sub–states of s.
-
{
}
(
)
n
pps , ,,And
1
: is an And–Statechart named s, which contains a set of
orthogonal (concurrent) sub–states
{
}
n
pp , ,
1
.
Two main components of a Statechart are State and Transition. A state is a
condition during the life of an object or an interaction during which it satisfies some
conditions, performs actions, or waits for some events. A composite Statechart is a
state that, in contrast to a simple state, can be decompounded into smaller
Statecharts. Conceptually, an object remains in a state for an interval of time.
However, the semantics allow for modelling to “flow–through” states in an
instantaneous manner, as well as transitions that are not instantaneous.
A simple transition is a relationship between two states indicating that an
object in the first state (source state) will enter the second state (target state).
Furthermore, it will perform specific actions when the event occurs provided that
certain specified conditions are satisfied. During such a change of state, the
transition is said to “fire.” The trigger for a transition is the occurrence of the event
labelling for the transition. The event may have parameters, which are accessible
by the actions specified on the transition as well as in the corresponding exit and
entry actions associated with the source and target states respectively. Events are
processed once at a time. If an event does not trigger any transition, it is discarded.
If it can trigger more than one transition within the same sequential region (i.e.,
not in different concurrent regions), only one will be fired. Only if these conflicting
transitions are of the same priority, an arbitrary one is selected and triggered.
Hierarchy: A Statechart contains some sub–states, and these sub–states may
be other Statecharts (contain states inside). In this case, we have a hierarchical
Statechart. Hierarchical Statecharts are very common in real systems. It can
handle more complex system and also contain concurrent states. With a more
sophisticated Statechart, the source and target states of transitions must not be at
the same level (same parent state).
Tran Vu Viet Anh, Nguyen Viet Ha
4
Concurrency: Statecharts have constructs to express concurrency. A composite
state (or called an
And–state) is decomposed into two or more orthogonal sub–
states. And each orthogonal sub–state may have an initial and a final state. A
transition to this
And–state represents a transition into all initial states.
In this paper, we use sub–state interchangeable as children term of
Or–state.
Correspondingly, we use children and region of
And–state interchangeably.
2.2. Example
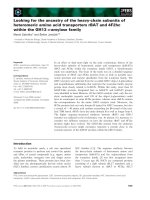
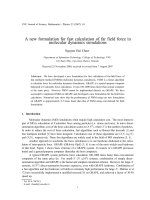
Figure 1: shows an example of a Statechart with a root state is an
And–state
and two regions. Each region is an
Or–state. In this Statecharts, P1a, P1b, P2a,
P2b, and P2c are Basic-states. P1 and P2 are Or-states and they are two children
of And-state P0. At the beginning, the control will reach P0, and then go to P1 and
P2 at the same time (concurrently). When P1 is reached, it will pass the control to
the default child, it is P1a. The same in state P2, P2a is a default child and the
control will be given to it. The control in both P1 and P2 will run concurrently
through their transitions. If event a occurs, the transition t1 will be hired and the
control in P1 will jump from P1a to P1b. The same in P2, if two events b then c
occur in the right order, two transitions t2 & t3 will be hired and the control will go
to P2c.
Figure 1. Example of a Statechart.
2.3. Textual representation
Textual representation of Statecharts is a format of a Statechart follow the
syntax of states and transitions presented in previous sub–section. The syntax of a
transition is:
Name = 〈 source state, event signature, action–expression, condition, target state 〉
The textual representation of Statechart diagram in Figure 1: will be shown
below. Where, the first part is representation of States. P1a, P1b, P2a, P2b, and P2c
are Basic-states so they are represented with name only. P1 and P2 are Or-states
so they are represented with their children and transitions. The root, P0, is And-
state then P0 will be represented with its two children (P1 and P2).
A graphical edior for the statecharts language
5
The second part is representation of transitions. Following the syntax above,
transitions t1, t2, and t3 are represented with their target and source states,
events, actions, conditions.
Details of the representation are:
//States
P0 = |[ S1: { P1, P2 } ]|
P1 = |[ S2: [ P1a, P1b ], P1a, { t1 } ]|
P2 = |[ S3: [ P2a, P2b, P2c ], P2a, t2, t3 } ]|
P1a = |[ S4 ]|
P1b = |[ S5 ]|
P2a = |[ S6 ]|
P2b = |[ S7 ]|
P2c = |[ S8 ]|
//Transitions
t1 = < P1a, { a }, { }, true, P1b >
t2 = < P2a, { b }, { }, true, P2b >
t3 = < P2b, { c }, { }, true, P2c >
3. Statechart_E
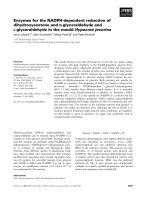
Figure 2: shows the interface of Statechart_E and its stencil. The left hand
side of the figure is a group of masters to draw Statechart components. The sub-
section 3.1 will discuss about these components in detail. The right hand side is an
example of a Statechart diagram under construction.
Figure 2. Statechart_E interface.
Tran Vu Viet Anh, Nguyen Viet Ha
6
We also see that there is a menu named Statecharts, which is added to perform
new functions of Statechart_E. Sub-section 3.2 will discuss about this menu.
3.1. Statechart_E’s components
Statechart_E allows users draw all Statechart’s components with very easy
way. To draw a new component, users just click the corresponding master from the
stencil (the left hand side) and drop it in the editing area (the right hand side). For
a state, users use State master to create a new state. Click mouse on State master,
move the mouse point (while the left mouse button is pressed) to the place will
construct a new state, and then release the mouse button. Users can also easy to
change its shape and format of the master like side, type of border, etc.
Statechart_E stencil has 8 types of the transition. Users have their flexibility
to draw a transition with these masters. These transition masters will be very
helpful with a large and complex Statechart. The stencil also has two vertical and
horizontal separators to create
And–state. Another master is default–state, which
is used to change a sub–state be a default sub–state of the Statechart. All these
masters are built as the standard of Visio, hence users can change its properties as
normal.
Each master of the Statechart_E is accompanied by a short program. These
codes are written in Visual Basic for Application (VBA) to check data, events and
perform actions of each master. Some masters are linked to a dialog window to
allow user input or change master’s data (like name, condition etc). These programs
also partially check the supplied data, such as duplicate name, etc.
3.2. Statechart_E’s menu
We also added a menu named Statecharts to the menu bar of Visio as
illustrated in Figure 2. This menu contains two fully implemented functions,
namely: Generate Statecharts and Add New Statecharts Page. The first function is
used to export the textual representation (presented in sub–section 2.3) of the
current Statechart to a textual representation file. The name of output file will be
asked in the save dialog box. This file may use for other purpose, for example, an
input of a program which translates to other languages.
As already mentioned in previous subsection, Add New Statecharts Page
function in menu Statecharts will help users add a new page to draw the
hierarchical Statecharts. The number of page that users can use is depended on the
Visio configuration. Note that Generate Statecharts function will read all
components in all pages of the Statechart. More detail of this function will be
discussed in bellow sub-section.
There are two more functions; Statecharts Verification and Statecharts
Simulation. These two functions are implementing, which help users check the
correctness of the drawing Statecharts and may do a pre-simulation of the
Statecharts.
The last function is a form shows the contact information.
A graphical edior for the statecharts language
7
3.3. The hierarchical feature
Statechart_E is built to construct the hierarchical Statecharts. It means that
users can easily extend their Statecharts. A function in the Statecharts menu will
help users add a new page, and then users can continue to draw the current
Statechart in a hierarchical manner. For example, users may draw the sub–states
of P1 and P2 of Figure 2: in two new pages. Suppose the P1a is a sub-state of P1,
then users can continue to draw the sub-statechart P1a in other new page.
This is a very good feature of Statechart_E. It will help users construct a large
Statechart with complex transitions and states. Furthermore, users can easily
divide their Statecharts into several parts to conquer. Each part can be drawn in a
single page, and then users can collect them as a set of sub-pages with a main page.
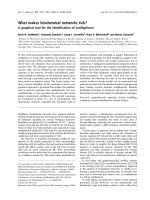
Example, Figure 3: shows a dialog to input new page name when users add a new
page. And Figure 4: shows a Statecharts with a main page and three more sub-
pages to describe the sub-Statecharts.
Figure 3. Dialog to input new page name.
Figure 4. Example of Statecharts with more than one page.
3.4. Statechart_E’s activation
Users need to first open stencil and enable its macro to use the functions of
Statechart_E. The usage of Statechart_E stencil and its masters is almost the same
as other stencils in Visio. However, the Statechart_E functions will not work with
Visio native components.
4. Related works
There are several works and related software, like Rhapsody, AnyStates.
However, these are expensive commercial products. There are some free graphical
Some more pages to
draw Statecharts
Tran Vu Viet Anh, Nguyen Viet Ha
8
tools to edit Statechart, like Diagen, DOME. Some of these tools have both GUI and
code generation. We shall describe these tools briefly in the following.
Some works are very old and no longer supported, for example, work of
Paulisch [10] and Lucas [7]. Their idea is to create a graphical interface to edit
concurrent, hierarchical, finite state machines (CHSMs). Both systems are written
in C++ in X–Windows environment. Another work almost at the same time is the
work of Edwards [2] based on tcl package. These old tools are typically unable to
handle larger Statecharts.
Two more free tools are Diagen [1], and Jgraphpad [6]. Diagen (The Diagram
Editor Generator) is a system for easy development of powerful diagram editors. It
includes a graphical front–end, and a powerful back–end language for generating
code, analysis and documentation. JGraphpad is a powerful diagram editor for
Swing that offers XML, drag and drop, zoom, automatic layout, print support, and
much more. JGraphpad, can be used to create flow charts, maps, UML diagrams,
and networks with thousands of nodes. However, these two tools are not user–
friendly, they are difficult to use.
Commercial software are typical costly, such as Rhapsody [5], Rhapsody
reverses the traditional design process, allowing you to find problems as they occur,
versus waiting until the very end when they are far more costly to correct. Another
product is that of XJ Technologies, called AnyStates™ [14], for state analysis. This
aims at developing software components based on Statecharts (state machines).
Some key features of Anystates are: state–of–the–art graphical Statechart editor,
synchronous graphical and textual views on a Statechart, and on–the–fly code
generation.
5. Conclusion
In this paper, we present the Statechart_E tool, which is used to draw
Statechart diagrams. We also discuss some other techniques that are used in the
Statechart_E implementation. We designed and built the Statechart_E to cover all
features of Statecharts language, it is our first purpose. Then, it is help users to
draw Statecharts diagrams easily. Moreover, users can draw large diagrams with
the hierarchical feature of Statechart_E. Users can export the edited Statecharts to
some graphical formats for portability and for documentation. Users can also check
the correctness of the edited Statechart and export it to the textual representation.
From all these good features and a user–friendly interface of the Statechart_E,
Statechart_E is a very good editor for the Statechart diagrams and can be used for
hardware designer.
In the future plan, we will verify the improvements of the Statecharts editor
and the correctness of states and transitions. We will also discuss the simulation
function in another research.
A graphical edior for the statecharts language
9
Reference:
1. DiaGen, The Diagram Editor Generator, Available at:
–erlangen.de/DiaGen/
2. Stephen Edwards, An Interactive Editor for the Statecharts Graphical
Language, Available at:
3. D. Harel, Statecharts: A Visual Formalism for Complex Systems, Sci. Comp.
Prog., vol. 8(1987) pp. 231–274,.
4. D. Harel, On Visual Formalisms, Communications of the ACM, Vol. 31,
No.5(1988) pp. 541–530.
5. I–LOGIX Inc, Rhapsody
®
, available at:
6. Jgraphpad, available at:
7. P. J. Lucas, A Graphical Editor Proposal for Developing Concurrent,
Hierarchical, Finite State Machines, Technical Report: UIUCDCS–R–93–1799,
Urbana, Illinois.
8. G. Lüttgen, M. von der Beeck, and R. Cleaveland, A Compositional Approach
to Statecharts Semantics, NASA/CR–2000–210086, ICASE Report No. 2000–
12, March 2000.
9. Maggiolo–Schettini, A. Peron, and S. Tini, Equivalences of Statecharts, In 7
th
International Conference on Concurrency Theory (CONCUR'96), Pisa, Italy,
August 1996, LNCS 1119, pp. 687–702, Springer–Verlag.
10. F. N. Paulisch, The Design of an Extendible Graph Editor, PhD Dissertation,
Karlsruhe University, Jan. 1992.
11. Viet-Anh Vu Tran, Shengchao Qin, and Wei-Ngan Chin, Automatic Mapping
from Statecharts to Verilog, First International Colloquium on Theoretical
Aspects of Computing (ICTAC04), Guiyang, China, Sep. 2004. Lecture Notes
in Computer Science 3407, pp. 188-203, Springer-Verlag.
12. Viet-Anh Vu Tran and Viet-Ha Nguyen, A Bridge of Statecharts to Low-Level
Language, In the Proceeding of Ninth Biennial Vietnam Conference on Radio
& Electronics (REV 2004), pp. 291-295, Hanoi, Vietnam.
13. Viet-Anh Vu Tran, Viet-Ha Nguyen and Wei-Ngan Chin, Working with Low-
Level System Design from High Level-Language, In the 3
rd
International
Conference in Computer Science, Research, Innovation & Vision of the Future
(RIVF’05), Can Tho, Vietnam, Feb. 2005.
14. XJ Technologies, AnyStates™, available at: