Population structure attributable to reproductive time: isolation by time and adaptation by time docx
Bạn đang xem bản rút gọn của tài liệu. Xem và tải ngay bản đầy đủ của tài liệu tại đây (304.78 KB, 16 trang )
Molecular Ecology (2005)
14
, 901–916 doi: 10.1111/j.1365-294X.2005.02480.x
© 2005 Blackwell Publishing Ltd
Blackwell Publishing, Ltd.
INVITED REVIEW
Population structure attributable to reproductive time:
isolation by time and adaptation by time
ANDREW P. HENDRY
*
and TROY DAY
†
*
Redpath Museum and Department of Biology, McGill University, 859 Sherbrooke St. W., Montréal, Québec H3A 2K6 Canada
†
Department of Mathematics and Department of Biology, Queen’s University, Kingston, Ontario K7L 3 N6 Canada
Abstract
Many populations are composed of a mixture of individuals that reproduce at different
times, and these times are often heritable. Under these conditions, gene flow should be
limited between early and late reproducers, even within populations having a unimodal
temporal distribution of reproductive activity. This temporal restriction on gene flow
might be called ‘isolation by time’ (IBT) to acknowledge its analogy with isolation by
distance (IBD). IBD and IBT are not exactly equivalent, however, owing to differences
between dispersal in space and dispersal in time. We review empirical studies of natural
populations that provide evidence for IBT based on heritabilities of reproductive time and
on molecular genetic differences associated with reproductive time. When IBT is present,
variation in selection through the reproductive season may lead to adaptive temporal varia-
tion in phenotypic traits [adaptation by time (ABT)]. We introduce a novel theoretical model
that shows how ABT increases as (i) selection on the trait increases; (ii) environmental
influences on reproductive time decrease; (iii) the heritability of reproductive time
increases; and (iv) the temporal distribution of reproductive activity becomes increasingly
uniform. We then review empirical studies of natural populations that provide evidence
for ABT by documenting adaptive temporal clines in phenotypic traits. The best evidence for
IBT and ABT currently comes from salmonid fishes and flowering plants, but we expect that
future work will show these processes are more widespread.
Keywords
: assortative mating, breeding time, gene flow, migration, phenology, temporal isolation
Received 12 August 2004; revision received 6 January 2005; accepted 6 January 2005
Introduction
Many populations are composed of a mixture of indi-
viduals that reproduce at different times within a particular
season and location. Within such populations, phenotypic
traits often covary with reproductive time: for example,
clutch size with egg laying date in birds (e.g. Meijer
et al
.
1990; Rowe
et al
. 1994; Winkler
et al
. 2002), body size with
metamorphosis date in insects (e.g. Vannote & Sweeney
1980; Forrest 1987; Rowe & Ludwig 1991), reproductive
lifespan with breeding date in salmonid fishes (e.g.
McPhee & Quinn 1998; Morbey & Ydenberg 2003; Hendry
et al
. 2004), and flower number with flowering date in
plants (e.g. Dieringer 1991; Lyons & Mully 1992; Andersson
1996). Several explanations have been advanced for these
temporal phenotypic clines, and our goal is to provide
theoretical and empirical support for one of them.
One class of explanations assumes that reproductive
times are individually flexible, rather than strongly herit-
able. Temporal phenotypic clines might then arise if repro-
ductive time is influenced by phenotypic traits, such as
body size or energy stores. These influences might reflect
constraints (individuals can only reproduce when they
surpass a particular threshold) or adaptive tactics (indi-
viduals reproduce at times for which their traits are best
suited). Temporal phenotypic clines might also arise when
cause and effect are reversed, such that trait expression is
influenced by the conditions experienced at the chosen
reproductive time. This might occur if traits are directly
influenced by the environment or by the condition of
Correspondence: Andrew P. Hendry, Fax: (514) 398–3185; E-mail:
Troy Day, Fax: (613) 533–2964; E-mail:
902
A. P. HENDRY and T. D AY
© 2005 Blackwell Publishing Ltd,
Molecular Ecology
, 14, 901–916
individuals at a particular reproductive time, or if indi-
viduals alter their trait expression to suit their chosen time
(i.e. adaptive tactics).
A second class of explanations assumes that reproduc-
tive times are strongly heritable, rather than individually
flexible. Temporal phenotypic clines might then arise for
several reasons. First, trait expression might be directly
influenced by the environment or by the condition of
individuals that reproduce at a particular time (as previously
noted). Second, trait expression might reflect adaptive
tactics by individuals reproducing at a particular time
(also as previously noted). In either of these scenarios, an
individual with a heritable tendency to reproduce early
that instead reproduced late might express traits typical of
late reproducers. Third, limited gene flow through the
reproductive season (owing to heritable reproductive times)
might allow adaptation to environmental conditions typi-
cally experienced at particular reproductive times. In this
scenario, an individual with a heritable tendency to repro-
duce early that instead reproduced late might express traits
typical of early reproducers. This adaptation to heritable
reproductive times is the mechanism we here explore in
detail.
The previous explanations are not mutually exclusive.
That is, reproductive times may be influenced by a combi-
nation of heritable variation, random environmental effects,
and individual choice. Moreover, phenotypic traits may
both influence and be influenced by reproductive time
owing to a combination of constraints, direct environ-
mental influences, adaptive tactics, and adaptation to
particular times. Disentangling this complexity, must
await the demonstration that each mechanism can work on
its own. To advance this initial goal, we first outline theoret-
ical considerations and empirical evidence for temporal
restrictions on gene flow that result from heritable repro-
ductive times (i.e. ‘isolation by time’). We then outline theo-
retical considerations and empirical evidence for adaptive
temporal clines in phenotypic traits (i.e. ‘adaptation by
time’). Our empirical examples focus mainly on the taxa in
which these ideas have been developed in greatest detail:
salmonid fishes and flowering plants.
Isolation by time
Consider a seasonally reproducing population composed
of individuals with different reproductive times, some
reproducing early in the season, some late, and some at
intermediate times. In such a population, individuals
reproducing at similar times will be more likely to mate
with each other than will those reproducing at different times
(i.e. temporal assortative mating). If some of this timing
variation is heritable, the probability that two individuals
will mate should be inversely related to the difference in
the heritable component of their reproductive times (Fox
2003; Weis & Kossler 2004). If this heritable component has
an additive genetic basis, which often seems to be the case
(Table 1), the probability that two individuals will mate
should be inversely related to the difference in their breed-
ing values for reproductive time. [Breeding values are the
phenotypic trait value of an individual, expressed as the
expected phenotypic trait value of its offspring (Roff 1997;
p. 27)]. As a result, individuals with a heritable tendency
to reproduce at a particular time will generate offspring
of a similar proclivity. The net result will be genetic
mixing within the population that decreases with increasing
differences in reproductive time. We call this phenomenon
isolation by time (Hendry
et al
. 1998, 1999, 2001, 2004).
Theoretical considerations
The term isolation by time (IBT) acknowledges a conceptual
analogy with ‘isolation by distance’ (IBD), wherein limited
dispersal in space leads to increasing genetic differences
with increasing spatial distances (Wright 1943, 1946; Kimura
& Weiss 1964; Slatkin 1993; Rousset 1997, 2000). IBD
predictions may apply in a qualitative fashion to IBT, but
they certainly differ quantitatively owing to fundamental
differences between dispersal in space and ‘dispersal’ in
time. In IBD, organisms reproducing at a particular location
(e.g. points on the horizontal lines in Fig. 1) generate
offspring that disperse according to a symmetrical
probability distribution centred at that location (e.g.
a
in
Fig. 1A). Offspring that disperse to new locations will then
generate their own offspring that disperse according to a
similar probability distribution centred at the new
locations (e.g.
b
and
c
in Fig. 1A).
In IBT for
asexual
organisms, an individual having a
breeding value for a particular reproductive time (
a
in
Fig. 1B) will produce offspring that may ‘disperse’ because
of environmental effects to reproduce at other times (e.g.
b
and
c
in Fig. 1B). We suggest that this temporal dispersal
might follow a probability distribution with a width
inversely related to the heritability of reproductive time.
Now we come to the critical difference between IBT and
IBD: an individual whose actual reproductive time differs
from that specified by its breeding value will nevertheless
produce offspring whose expected reproductive time is the
same as the original breeding value (
d
in Fig. 1B). In short,
dispersers in time produce offspring that return to disperse
from the expected reproductive time of their ancestors.
In IBT for
sexual
organisms, parents reproducing at a
particular time will generate offspring that carry a mixture
of breeding values and therefore disperse to other repro-
ductive times owing to both genetic and environmental
effects. To understand how this might work, consider two
groups of individuals having different breeding values for
reproductive time (
a
and
b
in Fig. 2A). Owing to environ-
mental effects, some of these individuals will disperse to
ISOLATION BY TIME AND ADAPTATION BY TIME
903
© 2005 Blackwell Publishing Ltd,
Molecular Ecology
, 14, 901–916
Table 1
Narrow-sense heritabilities for reproductive timing traits in a variety of taxa. Timing traits include breeding site arrival (arrival),
maturation (maturation), egg laying (laying), egg hatching (hatching), parturition (parturition), eclosion (eclosion), and flowering
(flowering). Multiple values are reported when studies provided separate estimates for sexes, populations, years, or estimation methods.
Estimation methods include sibling relationships (sibs), the sire component based on sibling relationships (sibs–sire), restricted maximum
likelihood (REML), responses to selection (realized), and parent–offspring regressions (parent–offspring). See original studies for full
scientific names and significance levels
Species Trait Treatment Heritability Estimation method
Fish
O. tshawytscha
1
Maturation Wild/Hatchery 0.82, 1.06, 1.28 Sibs–sire
O
. gorbuscha
2
Arrival Wild 0.18, 0.39 Sibs–sire
O. mykiss
3
Maturation Hatchery 0.50, 0.84, 0.87 REML
O. mykiss
4
Maturation Hatchery 0.53, 0.55 Realized
O. mykiss
5
Maturation Hatchery 0.50, 0.50 REML
O. kisutch
6
Maturation Farm 0.24 REML
Birds
T. bicolor
7
Laying Wild 1.44 Parent–offspring
H. rustica
8
Arrival Wild 0.54 Parent–offspring
F. albicollis
9
Laying Wild 0.41 Parent–offspring
F. albicollis
10
Laying Wild 0.19 REML
F. hypoleuca
11
Arrival Wild 0.34 Parent–offspring
P. caeruleus
12
Laying Wild 0.44 Parent–offspring
P. major
13
Laying Wild
−
0.18, 0.04, 0.13, 0.16 Parent-offspring
P. major
13
Laying Wild
−
0.14, 0.00, 0.13, 0.16 Parent–offspring
P. major
14
Laying Wild 0.21, 0.24 Parent–offspring
A. caerulescens
15
Laying Wild 0.02 Parent–offspring
F. atra
16
Hatching Wild 0.44 Parent–offspring
Mammals
T. hudsonicus
17
Parturition Wild 0.16 REML
Lizards
U. stansburiana
18
Laying Wild 0.10 Parent–offspring
Insects
E. autumnata
19
Eclosion Laboratory 0.61 Sibs–sire
Plants
P. congesta
20
Flowering Greenhouse 0.60, 0.72, 0.75, 0.77 Parent–offspring/Realized
P. brachystemon
20
Flowering Greenhouse 0.42, 0.49 Parent–offspring/Realized
R. raphanistrum
21
Flowering Greenhouse 0.06, 0.12, 0.97, 1.41 Sibs
R. raphanistrum
22
Flowering Greenhouse 0.63 Sibs–sire
B. campestris
23
Flowering Greenhouse 0.68 Parent–offspring
R. sativus
24
Flowering Garden 0.35, 0.50, 0.10 Sibs
C. fasciculata
25
Flowering Greenhouse 0.04, 0.32 Sibs
P. centranthifolius
26
Flowering Greenhouse 0.26 Sibs
G. hybrida
27
Flowering Greenhouse 0.54 REML
S. integrifolius
28
Flowering Greenhouse 0.44, 0.47, 0.93, 1.26 Sibs–sire
M. guttatus
29
Flowering Greenhouse 0.37, 0.63 Parent–offspring
S. granulata
30
Flowering Garden 0.24, 0.41 Sibs–sire
L. salicaria
31
Flowering Garden 0.09, 0.09, 0.10 Parent–offspring
B. rapa
32
Flowering Greenhouse 0.71 Parent–offspring
Notes:
1
Quinn
et al
. (2000): females in two populations, one with two estimates (hatchery and wild).
2
Smoker
et al
. (1998): females and males.
3
Su
et al
. (1997, 1999): females.
4
Siitonen & Gall (1989): two year classes of females.
5
Wilson
et al
. (2003): females at two ages.
6
Gall & Neira (2004):
females.
7
Wiggins (1991): females.
8
Møller (2001): males.
9
Merilä & Sheldon (2000): females.
10
Sheldon
et al
. (2003): females.
11
Potti (1998):
males.
12
Svensson (1997): females.
13
Van Noordwijk
et al
. (1981): first row gives mother–daughter regressions for four populations and the
second row gives father–son regressions for four populations.
14
Van der Jeugd & McCleery (2002): males and females, correction for spatial
autocorrelation yielded an estimate of 0.16.
15
Perdeck & Cavé (1992): females corrected for season and age.
16
Findlay & Cooke (1982):
females.
17
Réale
et al
. (2003): females.
18
Sinervo & Doughty (1996): females.
19
Tammaru
et al
. (1999): length of the pupal period.
20
Carey
(1983): the four values for
Phyllostachys congesta
are based on realized heritabilities and parent–offspring regressions for outcrossed and
selfed plants. The two values for
Plectritis brachystemon
are based on realized heritabilities and parent–offspring regressions for selfed plants.
21
Mazer (1987): sire and dam components in two crosses.
22
Conner & Via (1993).
23
Dorn & Mitchell-Olds (1991).
24
Mazer & Schick (1991):
low, medium, and high densities.
25
Kelly (1993): sire and dam components.
26
Mitchell & Shaw (1993): heritability based on clones was 0.06.
27
Yu
et al
. (1993).
28
Widén & Andersson (1993): two populations in two years.
29
Carr & Fenster (1994): two populations.
30
Andersson (1996):
two years.
31
O’Neil (1997): dam, sire, and mid-parent regressions.
32
Weis & Kossler (2004).
904
A. P. HENDRY and T. D AY
© 2005 Blackwell Publishing Ltd,
Molecular Ecology
, 14, 901–916
reproduce at other times, perhaps encountering each other.
Mating between individuals from these two groups will
then produce offspring having an average breeding value
that is intermediate between the two parental breeding
values (
c
in Fig. 2A). The offspring from this mating will then
disperse from this new time, both as a result of environmental
effects and because the offspring in a brood generated by
sexual reproduction have a range of breeding values.
Temporal variation in the intensity of reproductive
activity further complicates dispersal in time. Consider
first a uniform temporal distribution of reproductive
activity with identical dispersal distributions at each time
(Fig. 2B). In this case, a group of individuals reproducing at
a particular time (e.g.
a
in Fig. 2B) will carry a mixture of
breeding values. This mixture might follow a symmetrical
density distribution centred at the parental reproductive
time (
a
in Fig. 2B). As a result, parents reproducing at a
particular time will generate offspring that have a similar
average
reproductive time (
b
in Fig. 2B). Now, consider a
situation where reproductive activity or dispersal is not
uniform through time. In this case, a group of individuals
reproducing at a particular time will carry an uneven
mixture of breeding values that is skewed toward times
of higher activity or higher dispersal. As a result, they will
produce offspring that have an
average
reproductive
time that is biased toward earlier or later times. This
scenario is qualitatively illustrated in Fig. 2(C) for the
simple case of breeding values for only two times.
In summary, dispersal in time acts differently than dis-
persal in space. Although IBT theory has yet to be developed,
consideration of the above properties allows at least quali-
tative predictions. In particular, we expect that decreasing
heritabilities of reproductive time will increase temporal
dispersal, which will increase temporal gene flow, which will
lead to a weaker relationship between genetic differences
and time differences (Fig. 3). We further suggest that IBD
relationships may ultimately allow the estimation of tem-
poral gene flow and the heritability of reproductive time.
This would be analogous to the use of IBD relationships to
infer spatial gene flow (Slatkin 1993) and dispersal (Rous-
set 1997, 2000).
Empirical evidence
How might IBT be detected and quantified in natural
populations? A number of individual-based methods seem
possible. One is to determine the reproductive times of
parents and their offspring, with a positive correlation
implying IBT. This method parallels the use of parent/
offspring regressions to infer the heritability of reproductive
time (Table 1; Weis & Kossler 2004). Although heritable
reproductive times should indeed cause IBT, they do not
actually demonstrate its presence. Another approach might
be to use genetic ‘assignment methods’ (Hansen
et al
. 2001;
Berry
et al
. 2004) to identify individuals that disperse from
their parents’ reproductive time, as well as any offspring
they generate. A third possible approach is to plot relatedness
between individuals against their difference in repro-
ductive time, analogous to suggested approaches for IBD
(Rousset 2000). As none of these individual-based methods
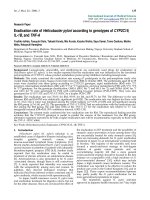
Fig. 1 Illustrations of dispersal under isolation by distance (IBD) (panel A) and isolation by time (IBT) in the case of asexual reproductio
n
(panel B). The different horizontal lines represent reproduction in successive generations and the points on each line represent locations i
n
space (panel A) or time (panel B). In panel A, the solid vertical lines represent the relationship between an individual’s reproductive locatio
n
and the average reproductive location of its offspring. In panel (B), the solid vertical lines represent the relationship between an individual’s
b
reeding value for reproductive time and the average reproductive time of its offspring. The curves represent probability distributions fo
r
the dispersal of offspring from their parent’s reproductive location (panel A) or their parent’s breeding value for reproductive time (Pane
l
B). In panel B, the broken lines indicate that individuals of a common breeding value that reproduce at different times, owing to
environmental effects, still produce offspring having the original parental breeding value. These offspring therefore disperse anew fro
m
the original time. Parent/offspring relationships are only shown for a few representative locations or times, but similar relationships are
assumed for the other locations and times. The lower case letters refer to specific events discussed in the text.
ISOLATION BY TIME AND ADAPTATION BY TIME
905
© 2005 Blackwell Publishing Ltd,
Molecular Ecology
, 14, 901–916
has yet been applied to IBT, the following treatment focuses
on the more common approach of estimating historical
gene flow between groups that reproduce at different times.
If two samples are collected from a single, randomly
mating (panmictic) group, they should not genetically differ
apart from sampling error. If, however, the samples are
from groups between which mating is not random, they may
differ genetically owing to mutation, drift, or selection.
Heritable reproductive times cause nonrandom mating
(Fox 2003; Weis & Kossler 2004) and should therefore lead
to genetic differences associated with reproductive time.
Such differences should be stable across generations, such
that samples from multiple reproductive times in multi-
ple years cluster genetically by time rather than by year.
Although consistent genetic differences at any locus or
trait might reflect IBT, we focus on presumed neutral loci
because these are more useful for inferring gene flow.
Two-sample approaches (e.g. early vs. late) are most
common, and they can be used to confirm genetic differences
Fig. 2 Illustrations of dispersal under IBT in the case of sexual reproduction. All symbols and conventions follow those in Fig. 1 except for
the following. In panel A, the solid vertical lines represent the relationship between a particular breeding value for reproductive time and
the average reproductive time of individuals carrying that breeding value. The corresponding curves represent dispersal of offspring from
that time owing to environmental effects. The broken line then represents the relationship between the average breeding value of a mating
pair and of their offspring. The corresponding curve represents dispersal of these offspring owing to both environmental effects and the
variation in breeding values that result from sexual reproduction. In panels B and C, the solid lines represent the average breeding value
of all individuals reproducing at a particular time and of their offspring. The curves represent the dispersal of all offspring produced by
matings at a particular time in the population, with the different heights in panel C indicating different numbers of offspring produced.
The broken lines then show the average reproductive time of all the offspring produced by all the matings at a particular time.
Fig. 3 Qualitative predictions for isolation by time, shown as
expected relationships between pairwise genetic differences [F
ST
/
(1 − F
ST
)] and pairwise time differences. A decrease in the heritabilit
y
of reproductive time should lead to an increase in temporal gene
flow and a weaker IBT relationship. These predictions are mean
t
to parallel those generated by Rousset’s (1997) IBD model.
906 A. P. HENDRY and T. D AY
© 2005 Blackwell Publishing Ltd, Molecular Ecology, 14, 901–916
associated with reproductive time. Other possible approaches
include tests for heterozygote deficits (Wahlund effect)
and linkage disequilibrium when temporal samples are
pooled. None of these two-sample approaches, however,
is ideal for demonstrating IBT as a continuous process.
For this, one might sample individuals from multiple
reproductive times and test for temporal clines in allele
frequencies, or for correlations between pairwise genetic
differences and pairwise time differences. The latter
approach is analogous to IBD methods (e.g. Slatkin 1993;
Rousset 1997), but may have lower statistical power in
the temporal context because breeding usually varies
more in space than in time. In the following sections, we
review studies using these and other approaches to infer
IBT in salmonid fishes and flowering plants.
Salmonid fishes. Salmonids would seem particularly
likely to manifest IBT owing to their highly heritable
breeding times (Table 1). Accordingly, many studies have
shown that populations with different breeding times are
significantly, and sometimes substantially, differentiated
at presumed neutral loci (Table 2). Moreover, studies
sampling early and late breeders from multiple years
typically reveal clustering by reproductive time rather
than by year (e.g. Fillatre et al. 2003; Ramstad et al. 2003).
Unfortunately, temporal and spatial separation may be
partially confounded in these studies, making it difficult
to evaluate the relative importance of each isolating
barrier.
Two studies minimized confounding spatial effects by
comparing early with late breeders from a single location.
First, Woody et al. (2000) sampled mature sockeye salmon
(Oncorhynchus nerka) 13–15 d apart in each of two Alaskan
streams (Nikolai and Glacier Flats). Genetic differences at
microsatellites were small between times within both
streams, but highly significant for Nikolai Creek (Table 2).
Furthermore, genetic differences between the streams
(20 km apart) were nonexistent for samples taken at the same
time but highly significant for samples taken at different
times. Second, Hendry et al. (2004) sampled sockeye salmon
Table 2 Molecular genetic differentiation associated with reproductive timing in salmonid fishes of the genus Oncorhynchus
Species Population(s) Genetic differentiation
O. nerka
1
Tustumena Lake, AK Statistically significant microsatellite differences (F
ST
= 0.006) between salmon
entering Nikolai Creek 21–25 d apart. Smaller, nonsignificant differences (F
ST
= 0.003)
between salmon entering a Glacier Flats Creek 13–15 d apart.
O. nerka
2
Klukshu River, Yukon Statistically significant and consistent (across years) microsatellite differences
(F
ST
= 0.018–0.041) between salmon entering the river about 2 months apart.
O. nerka
3
Bear Lake, AK Statistically significant and consistent (across years) microsatellite differences
(F
ST
= 0.017) between salmon entering the lake about 1 month apart.
O. nerka
4
Pick Creek, AK Limited gene flow at microsatellites (N
e
m = 2.59, m = 0.00023) between salmon
breeding 29 d apart at the same location in a small creek.
O. gorbuscha
5
Auke Creek, AK Statistically significant allozyme differences (F
ST
= 0.004) between salmon entering the
creek about 1 month apart.
O. gorbuscha
6
Sakhalin Island, Russia Statistically significant mtDNA differences (Φ
ST
= 0.020–0.025) among four samples
collected at two-week intervals in each of two creeks. No differences were found in a
second year.
O. gorbuscha
7
Dungeness River, WA Statistically significant microsatellite and allozyme differences (F
ST
= 0.020) between
salmon breeding about 1 month apart. The two groups also breed at different
locations in the river.
O. keta
8
Bush Creek, BC Low gene flow (m = 0.004) into the lower reaches of Bush Creek from fish breeding
about 1 month later in the upper reaches of Bush Creek and in nearby Walker Creek.
O. mykiss
9
Eagle and Arlee, MT Statistically significant allozyme differences among trout maturing at different times
within a hatchery population. Temporal clines were evident in the frequencies of
some alleles.
O. mykiss
10
Nine hatcheries, ON Statistically significant mtDNA and allozyme differences among trout maturing
in different seasons within hatchery populations.
O. mykiss
11
Two hatcheries, ON Statistically significant mtDNA differences among trout maturing in different seasons
within a population where maturation time is under selection (Goosen) but not within
a population where maturation time is not under selection (Ganaraska).
O. mykiss
12
Rainbow Springs Hatchery, Statistically significant microsatellite differences among trout artificially selected to
mature in different seasons.ON
Notes:
1
Woody et al. (2000).
2
Fillatre et al. (2003).
3
Ramstad et al. (2003).
4
Hendry et al. (2004).
5
McGregor et al. (1998).
6
Brykov et al. (1999).
7
Olsen
et al. (2000).
8
Tallman & Healey (1994).
9
Leary et al. (1989).
10
Ferguson et al. (1993).
11
Danzmann et al. (1994).
12
Fishback et al. (2000).
ISOLATION BY TIME AND ADAPTATION BY TIME 907
© 2005 Blackwell Publishing Ltd, Molecular Ecology, 14, 901–916
breeding 29 days apart at the same location in a very
small (< 2 km long) Alaskan stream (Pick Creek). Genetic
differences at microsatellites were small between times,
but nevertheless indicative of limited gene flow (Table 2).
Although slight spatial separation might confound temporal
isolation in Nikolai Creek (Woody et al. 2000), it does not in
Pick Creek.
Temporal clines in allele frequencies have not been
examined in natural populations but they appear pre-
valent in hatchery populations, as revealed by allozymes
(Leary et al. 1989), mitochondrial DNA (mtDNA) (Ferguson
et al. 1993; Danzmann et al. 1994), and microsatellites (Fishback
et al. 2000). These clines might reflect genetic drift under
limited gene flow or physical linkage between neutral
marker loci and loci under selection. The latter explanation
seems plausible for these hatchery populations because
they have been under artificial selection to increase the
range of breeding times. Moreover, some of the micros-
atellite loci are linked to quantitative trait loci (QTL) that
influence breeding time (Sakamoto et al. 1999; O’Malley
et al. 2002). Temporal clines caused by physical linkage
with selected loci reveal genetic variation associated with
breeding time, but they should not be used to infer the
strength of IBT.
No studies of IBT have yet employed the pairwise
approach so often used for IBD, although some studies
had the opportunity to do so. For example, Brykov et al. (1999)
collected pink salmon (Oncorhynchus gorbuscha) at four dif-
ferent times in each of two rivers. They found significant
mtDNA differences associated with breeding time, but did
not analyse their data in a pairwise fashion. Lacking a
precedent, we sampled mature sockeye salmon at two-
week intervals in the Cedar River, Washington: 6 October,
20 October, 3 November, 20 November, and 3 December
(A. Hendry, P. Bentzen, I. Spies and K. Fresh, unpub-
lished). We genotyped 45–53 fish from each sample at
six microsatellite loci: One1, One2, One8, One11, One14,
and Ots103 (Scribner et al. 1996; Nelson & Beacham 1999).
We then calculated F
ST
/(1−F
ST
) between all pairs of sam-
ples (as suggested for IBD by Rousset 1997), plotted these
genetic differences against the corresponding time dif-
ferences, and evaluated statistical significance with Man-
tel (1967) tests.
When males and females were pooled, we found a non-
significant (P = 0.435) association between genetic differ-
ences and time differences (Fig. 4A). However, the temporal
dispersal of adults within a breeding season should be
greater for males than for females (Fleming & Reynolds
2004). Because we are more interested in long-term gene
flow than in contemporary dispersal, we repeated our
analysis for females only. Finding a much stronger corre-
lation (Fig. 4B; P = 0.051), we conclude that IBT is likely
present and may be detectable using the pairwise approach.
As in other studies, temporal and spatial separation might
be partly confounded in the Cedar River. One option for
future work would be to quantify differences in both time
and space between paired genetic samples. Partial Mantel
tests (Smouse et al. 1986; Castellano & Balletto 2002; but see
Rousset 2002) might then be used to estimate the effects of
time while controlling for space (for an analogous approach
see Stanton et al. 1997).
Flowering plants. Flowering plants are another group likely
to manifest IBT because of their highly heritable flowering
times (Table 1): mean h
2
= 0.40 based on 139 estimates
compiled by Geber & Griffen (2003). Moreover, a number
of genome regions and candidate genes have been
identified that strongly influence flowering time (reviews for
Arabidopsis: Koornneef et al. 1998; McKay et al. 2003). These
properties should promote IBT, and indeed a number of
studies have found substantial genetic differences between
distinct early- and late-flowering morphs (e.g. Soliva &
Widmer 1999; Gustafsson & Lönn 2003). Few studies,
Fig. 4 IBT based on breeding Cedar River sockeye salmon
collected at two-week intervals (N = 5 collections). Points represen
t
genetic differences vs. time differences for all possible pairs o
f
collections. Panel A was obtained by pooling males and females
in each collection, whereas panel B was obtained by excludin
g
males.
908 A. P. HENDRY and T. D AY
© 2005 Blackwell Publishing Ltd, Molecular Ecology, 14, 901–916
however, have tested for genetic differences between early-
and late-flowering plants within a single population. In
perhaps the only example, Stanton et al. (1997) used
allozymes to examine gene flow along a steep (< 200 m)
gradient in snow melt times. Flowering times were deter-
mined by snow melt times, but gene flow was not limited
between early- and late-melting sites. At face value, this
result argues against IBT, but then, IBT would not be
expected in this system because the variation in flowering
time does not have a genetic basis (Stanton et al. 1997).
We are not aware of any studies of adult plants in natural
populations that have tested for temporal clines in allele
frequencies, or used the pairwise approach. A number
of studies have, however, documented temporal shifts in
allele frequencies in the pollen pool (e.g. Fripp et al. 1987;
Sampson et al. 1990). These shifts imply genetic differences
among plants flowering at different times, but they do not
confirm IBT because individual plants can contribute dis-
proportionately to the pollen pool. We encourage more
studies of neutral genetic variation in relation to flowering
time, particularly for single populations where temporal
differences are not confounded by spatial differences.
Several additional methods provide indirect evidence
of IBT in flowering plants. First, detailed information on
flowering schedules can be used to predict the strength
of temporal assortative mating. Studies adopting this
approach have concluded that IBT should be very common
and strong (Fox 2003; Weis & Kossler 2004). Second,
comparisons can be made between mid-parent/offspring
and single-parent/offspring regressions for flowering
time, with the former (but not the latter) biased by temporal
assortative mating. Weis & Kossler (2004) used this method
to infer IBT in an artificial population. Third, experimental
populations can be created wherein flowering times are
linked to specific genetic markers. After open pollination,
the seeds can be screened to determine paternal genotype.
Studies adopting this approach have found that flowering
times cause major departures from random mating
(Gutierrez & Sprague 1959; Ennos & Dodson 1987). All of
these indirect approaches suggest that IBT should be
common in flowering plants, but they cannot reveal the
strength of IBT in natural populations.
In summary, IBT receives diverse support from studies of
salmonid fishes and flowering plants. Nevertheless, conclu-
sions regarding the strength and consistency of IBT in nature
require more studies specifically designed to test for tem-
poral restrictions on gene flow. Such studies would benefit
greatly from the development of theoretical models of IBT, as
was the case for IBD (e.g. Slatkin 1993; Rousset 1997, 2000).
Adaptation by time
Adaptive divergence occurs when gene flow is limited
between groups exposed to different selective environments
(Schluter 2000). Studies of this process usually focus on
selection that varies in space, but selection can also vary
through the reproductive season. When it does, we logically
expect adaptive divergence between groups that reproduce
at different times. Adaptive divergence in space can occur
between discrete populations in different environments
or within a population that is distributed across an
ecological gradient (reviews: Endler 1977; Lenormand
2002). By extension, we expect adaptive temporal clines in
heritable phenotypic traits when selection varies through
the reproductive season and gene flow is limited. We call
this phenomenon ‘adaptation by time’ (ABT) (Hendry et al.
1998, 1999, 2001, 2004).
Theoretical considerations
Several theoretical models have examined the evolution
of a quantitative trait along an ecological gradient (e.g.
Slatkin 1978; Pease et al. 1989; García-Ramos & Kirkpatrick
1997; Kirkpatrick & Barton 1997; Day 2000). The predictions
of these spatial models probably apply in a qualitative sense
to ABT (Fig. 5). Specifically, heritable phenotypic traits
should show temporal clines when selection varies in time
and IBT is present. Observed trait clines should become
steeper as the optimal trait cline becomes steeper and as
stabilizing selection around the optimum becomes stronger.
The degree of mismatch between the observed trait cline
and the optimal trait cline should increase as (i) the
heritability of reproductive time decreases (because IBT is
weaker); (ii) the heritability of the trait decreases (because
the response to selection is weaker); and (iii) reproductive
activity becomes less uniform through time (because
maladaptive gene flow becomes directionally biased).
Quantitative predictions for ABT, however, are unlikely
to match those from spatial models. One reason is the
aforementioned difference between dispersal in space and
dispersal in time. A second reason is that ABT will depend
on the evolution of genetic covariance between the selected
trait and reproductive time. To explore these complexities
we here develop a novel theoretical model that examines
adaptation across temporal clines. Our model represents a
first step toward ABT theory and is intended primarily to
derive simple analytical results for comparison with
spatial theory. The model, detailed in the online supple-
mentary materials, tracks the evolution of the joint breed-
ing value distribution for two quantitative traits: the date
when an individual reproduces (x, ‘reproductive date’)
and a trait (z) subject to a temporal cline in selection. For
ease of presentation, we refer to this selected trait as ‘body
size’, but the model is general to any trait.
The model assumes a population with discrete, non-
overlapping generations that has the following life cycle.
First, reproduction is initiated by distributing individuals
to different reproductive dates according to their breeding
ISOLATION BY TIME AND ADAPTATION BY TIME 909
© 2005 Blackwell Publishing Ltd, Molecular Ecology, 14, 901–916
value for reproductive date as well as any environmental
effects. Second, selection acts on body size according to a
linear temporal cline in the optimal trait value, with stabiliz-
ing selection around the optimum at each time. Third, actual
reproduction takes place, which we assume to be asexual
(e.g. Figure 1B). Finally, offspring are mixed back into the
population during the nonreproductive period. Here, we
assume that the contribution of offspring from a given
reproductive date is described by a Gaussian (normal) dis-
tribution with respect to time. Our temporal model is thus
directly equivalent to the spatial model of García-Ramos &
Kirkpatrick (1997), with the important exception of breed-
ing values for reproductive time.
Detailed results for the general model are presented in
the online supplementary materials. Here, we provide an
intuitive solution by further assuming that stabilizing
selection is weak and that body size is perfectly heritable,
with an optimum of zero on the date of maximum repro-
ductive activity (also set at zero). With these simplifications
(for details see the online supplementary materials), the
following equilibrium equation gives the mean body size
as a function of reproductive date:
(eqn 1)
where z(y) is the mean body size on date y, h
2
is the
heritability of reproductive date (i.e. ),
is the additive genetic variance for reproductive date,
is the environmental variance for reproductive date, β is
the slope of the temporal cline in optimal body size, and ω
x
is the variance in reproductive activity with respect to date
(i.e. width of the temporal density function).
This equation (see also Fig. 6) reveals that precise adap-
tation is facilitated by small environmental effects (small )
and uniform reproductive activity (large ω
x
). These results
are equivalent to the spatial context, where adaptation is
more precise with low dispersal and uniform densities.
The difference is that temporal clines show an additional
decrease in adaptation with a decrease in the heritability of
reproductive date (Fig. 6). This heritability determines the
consistency of selection across generations owing to the
sorting of individuals among dates within generations. As
this heritability decreases, groups having specific breeding
values for reproductive date will reproduce on increasingly
different dates across generations and therefore experi-
ence inconsistent selection.
Our simple model reveals some aspects of ABT, but a
more complete treatment would include several additional
Fig. 5 Qualitative predictions for ABT (panel A) when reproductiv
e
activity follows a normal density distribution in time (panel B). In
panel A, the solid diagonal line represents optimal trait values
and the broken lines represent observed mean trait values. The
observed mean trait value is expected to match the optimal trait
value at the temporal peak of reproductive activity, regardless o
f
the amount of gene flow. Mean trait values should then increasin
g
deviate from the optimum (i) for times farther from the peak o
f
activity; (ii) as dispersal increases (heritability of reproductive
time decreases); and (iv) as the trait heritability decreases. These
predictions are meant to parallel those generated by García-Ramos
& Kirkpatrick’s (1997) spatial model.
z()
yh
y
v
x
=
+
2
2
1
β
ω
φ
Fig. 6 Effects of the heritability of reproductive date (h
2
) and the
width of the reproductive activity density function (ω
x
) on the
degree of adaptation by time. The optimal trait cline is set at β = −1
and the environmental component of variance in reproductive
date is = 0.5. The observed trait cline matches the optimal trait
cline only when the heritability of the reproductive date is high
and reproductive activity is uniform (wide density function). Trai
t
clines do not develop if reproductive date is not heritable or i
f
reproductive activity decreases very rapidly from a central
maximum (narrow density function).
v
φ
2
hvvv
xx
2222
/(
)
=+
φ
v
x
2
v
φ
2
v
φ
2
910 A. P. HENDRY and T. D AY
© 2005 Blackwell Publishing Ltd, Molecular Ecology, 14, 901–916
effects. First, a lower heritability for the selected trait
should decrease adaptation. Second, sexual reproduction
would add additional complexities owing to the mixing of
breeding values from different reproductive dates (Fig. 2).
A sexual model will likely yield similar qualitative results,
but quantitative results may differ. Third, allowing the
temporal distribution of reproductive activity to evolve
might indicate whether temporal clines in selection can
limit the range of a species’ reproductive times, just as spatial
clines in selection can limit species’ geographical ranges
(Kirkpatrick & Barton 1997). Fourth, it remains to be deter-
mined whether ABT might be a special case of the joint
evolution of ‘habitat preference’ (here, heritability of repro-
ductive date) and a trait determining adaptation to habitat
type (here habitat type is the selective environment on a
given date). One difference may lie in the continuous nature
of reproductive date as opposed to the discrete nature of
alternative habitats in existing models of habitat preference
(e.g. Kisdi 2002; Ravigne et al. 2004).
Empirical evidence
We suggest that a robust demonstration of ABT in natural
populations would satisfy the following criteria. First, gene
flow should be temporally restricted through the repro-
ductive season (i.e. IBT). Second, a phenotypic trait should
vary through the reproductive season, although the lack of
such variation does not in itself refute ABT. Third, temporal
variation in the phenotypic trait should have a genetic
basis. Fourth, temporal variation in the phenotypic trait
should be adaptive, although it need not be perfectly so. In
the following sections, we review how salmonid fishes and
flowering plants provide evidence of ABT by satisfying at
least some of these criteria. We also ask whether ABT might
contribute to temporal phenotypic clines in insects and birds,
systems where other explanations are usually invoked.
Salmonid fishes. Salmonid fishes exhibit IBT (see previ-
ous discussions), and should therefore exhibit ABT when
selection varies with time. Indeed, populations breeding
at a single location often show temporal trends in pheno-
typic traits thought to be under selection, particularly adult
body size, energy allocation, reproductive lifespan, and
embryo development rate (Table 3). We consider the last
two of these in detail as they have been examined most
closely with respect to ABT.
Reproductive lifespan in semelparous Pacific salmon is
the length of time from the start of breeding by an individual
until its death. The length of this period varies widely but
is consistently longer for early breeders than for late
breeders (Fig. 7). The adaptive significance of this temporal
variation has been elucidated through field observations,
experimental manipulations, estimates of selection, and
game theory models (Hendry et al. 1999; Morbey &
Ydenberg 2003; Hendry et al. 2004; Morbey & Abrams
2004). For females, selection favours long life in early
breeders to defend their nests against disturbance by late
breeders, which would cause severe mortality of the
incubating eggs. For males, selection favours long life in
early breeders to allow them access to both early- and
late-breeding females. These same selective pressures do
not, however, favour long life in late females (because few
females will arrive later to threaten their nests) or in late
males (because nearly all females have already finished
breeding). Late breeders thus evolve shorter reproduc-
tive lifespans because they need not reserve as much
energy for prolonging life and can instead invest more into
other components of fitness, such as egg production (females)
or secondary sexual traits (males). What remains unknown
is the genetic basis for reproductive lifespan in salmon.
Genetically based differences in ‘intrinsic’ development
rate can be revealed by raising embryos at common labor-
atory temperatures. When this is done, the embryos of late
breeders typically develop faster than the embryos of early
breeders. This pattern has been documented for Bush
Creek chum salmon, Oncorhynchus keta (Tallman 1986),
Cultus Lake sockeye salmon (Brannon 1987), Cedar River
sockeye salmon (Hendry et al. 1998), and Auke Creek pink
salmon (Hebert et al. 1998). [Note that these systems
Fig. 7 Empirical data illustrating a possible example of ABT. Each
line is the predicted ordinary-least-squares relationship from a
study examining the correlation between relative breeding date
(the date an individual starts breeding, relative to the first indi-
vidual) and reproductive lifespan (the length of time from the star
t
of breeding by an individual until its death). Data are for female
(lines 1 and 2) and male (lines 3 and 4) sockeye salmon in Pick Cree
k
in each of 2 years (Hendry et al. 1999), female pink salmon in
Himmel Ceek (line 5; Dickerson et al. 2002), sockeye salmon
in Hansen Creek (line 6; McPhee & Quinn 1998), chinook salmon
in the Morice River (line 7, Neilson & Geen 1981), chinook salmon i
n
the Nechako River (line 8, Neilson & Banford 1983), and female
kokanee in Meadow Creek in each of two years (lines 9 and 10;
Morbey & Ydenberg 2003).
ISOLATION BY TIME AND ADAPTATION BY TIME 911
© 2005 Blackwell Publishing Ltd, Molecular Ecology, 14, 901–916
include those with genetic evidence for IBT: Bush Creek
(Tallman & Healey 1994), Cedar River (Fig. 4), and Auke
Creek (McGregor et al. 1998).] The faster intrinsic develop-
ment rate of late embryos appears adaptive because it
advances their otherwise late emergence from the gravel.
Late emergence would be disadvantageous because juve-
niles will be smaller at any given time and they will have
less time to grow before winter (Brannon 1987). Indeed,
several experiments have found evidence of selection
against late emerging embryos (Taylor 1980; Einum &
Fleming 2000).
Flowering plants. Flowering plants appear to show IBT
(see previous discussions) and should therefore show ABT
when selection varies through the flowering season (Fox
2003). Several complementary lines of evidence can be
advanced in support of this prediction. First, a number of
phenotypic traits covary with flowering time (Table 3).
Perhaps the most repeatable of these correlations is
the decrease in flower number at later flowering dates
(Table 3). Second, flower number can be significantly
heritable (e.g. h
2
= 0.30, Mitchell & Shaw 1993; h
2
= 0.11,
Andersson 1996). Third, several studies have tested for
Table 3 Examples of phenotypic correlations between reproductive time and phenotypic traits. Multiple table entries are made whe
n
studies obtained conflicting results in different populations, years, or treatments
Trait
Correlation with
reproductive time Examples
Animals
Reproductive lifespan Negative Fish: O. nerka
1,2,3,4,5
, O. gorbuscha
6
, O. tshawytscha
7,8
, O. kisutch
9
Adult size Negative Fish: O. nerka
2
, D. petenense
10
, N. baileyi
11
, M. salmoides
12
, M. dolomieui
13
,
M. minimus
14
, C. h. membras
15
Birds: A. phoeniceus
16
. Insects: E. dorothea
17
,
S. acletus
18
, S. viscinus
18
, C. s. xanthostoma
19
None Fish: O. nerka
2
, C. h. membras
15
. Insects: C. virgo
20
Age Negative Fish: D. petenense
10
, M. dolomieui
21
, G. minutus
22
Birds: 16 of 20 species
23
None Birds: 4 of 20 species
23
Energy/lipid/condition Negative Fish: O. nerka
2
, M. minimus
14
Ovary mass Negative Fish: C. h. membras
15
None (or variable) Fish: C. h. membras
15
Egg size Negative Birds: 20 of 75 studies
24
None Fish: C. h. membras
25
Birds: 49 of 75 studies
24
Positive Fish: O. nerka
2
Birds: 6 of 75 studies
24
Fecundity/clutch size Negative Birds: M. melodia
26
, 10 species
27
, T. bicolor
28
None Fish: C. h. membras
25
Positive Fish: G. minutus
22
Development rate Positive Fish: O. nerka
29,30,31
Plants
Plant size Negative R. raphanistrum
32
, A. strictifolia
33
, N. alata
34
, S. granulata
35
None L. androsaceus
36
Positive B. campestris
37
Flowering duration Negative A. strictifolia
33
, N. alata
34
, L. salicaria
38
None D. toumatou
39
, L. scoparium
39
, S. canadensis
40
Flower number Negative R. raphanistrum
32
, A. strictifolia
33
, N. alata
34
, S. granulata
35
, L. salicaria
38
,
C. virginica
41
, C. fasciculata
42
, P. centranthifolius
43
, S. alba
44
, S. latifolia
45
None L. androsaceus
36
, D. toumatou
39
, L. scoparium
39
Fruit number Negative R. raphanistrum
32
, A. strictifolia
33
Fruiting time Positive C. fasciculata
42
Leaf size Negative S. granulata
35
, R. raphanistrum
46
Notes:
1
McPhee & Quinn (1998).
2
Hendry et al. (1999).
3
Hendry et al. (2001).
4
Morbey & Ydenberg (2003).
5
Hendry et al. (2004).
6
Dickerson et al.
(2002).
7
Neilson & Geen (1981).
8
Neilson & Banford (1983).
9
Willis (1954).
10
Johnson (1971).
11
Mathur & Ramsey (1974).
12
Miranda & Muncy
(1987).
13
Ridgway et al. (1991).
14
Schultz et al. (1991).
15
Rajasilta et al. (2001).
16
Langston et al. (1990).
17
Vannote & Sweeney (1980).
18
Forrest
(1987).
19
Plaistow & Siva-Jothy (1999).
20
Rantala et al. (2001).
21
Wiegmann et al. (1997).
22
Healey (1971).
23
Perdeck & Cavé (1992).
24
Christians
(2002).
25
Laine & Rajasilta (1998).
26
Hochachka (1990).
27
Meijer et al. (1990).
28
Winkler et al. (2002).
29
Tallman (1986).
30
Brannon (1987).
31
Hendry et al. (1998).
32
Mazer (1987).
33
Dieringer (1991).
34
Lyons & Mully (1992).
35
Andersson (1996).
36
Schmitt (1983).
37
Dorn & Mitchell-
Olds (1991).
38
O’Neil (1997).
39
Primack (1980).
40
Pors & Werner (1989).
41
Schemske (1977).
42
(Kelly 1993).
43
Mitchell & Shaw (1993).
44
Biere
& Antonovics (1996).
45
Purrington & Schmitt (1998).
46
Conner & Via (1993).
912 A. P. HENDRY and T. D AY
© 2005 Blackwell Publishing Ltd, Molecular Ecology, 14, 901–916
genetic correlations between flower number and flowering
time, which should be negative if the phenotypic trend
has a genetic basis. Here the results are mixed: 0 (paternal)
and 0.35 (maternal) in Chamaecrista fasciculata (Kelly
1993), –0.35 in Saxifraga granulata (Andersson 1996), and –
0.52 in Penstemon centranthifolius (Mitchell & Shaw
1993). More work is obviously needed, but the results are
encouraging in that the nonmaternal correlations tend to
be negative.
Is the temporal trend in flower number adaptive? All
else being equal, more flowers should improve fitness, so
why do later plants have fewer flowers? The answer may
lie in a trade-off between flower number and some other
component of fitness, with time-specific selection favour-
ing different positions on this trade-off. As an example,
late-emerging Silene latifolia have fewer flowers and flower
late, but have higher survival as seedlings (Purrington
& Schmitt 1998). As another example, late flowering
and fewer flowers in Silene alba reduce infection by Ustilago
violacea, a fungal disease florally transmitted by insect
vectors (Thrall & Jarosz 1994; Biere & Antonovics 1996).
In either case, selection might favour a different balance
between these fitness components for early vs. late
reproducers. We encourage explicit work on the possible
adaptive significance of temporal variation in flower
number.
Several other phenotypic traits are genetically correlated
with flowering time (Conner & Via 1993; Mitchell & Shaw
1993; Carr & Fenster 1994; Andersson 1996; O’Neil 1997),
suggesting that these too might be candidates for ABT. For
example, water use efficiency is higher for late-flowering
than for early-flowering plants (Geber & Dawson 1990;
McKay et al. 2003). Early flowering and high water use effi-
ciency are both drought adaptations, a redundancy that
implies selection for water use efficiency should be weaker
in early-flowering plants. If water use efficiency trades-off
with some other aspect of fitness, the temporal trend might
well reflect ABT. A possible alternative to adaptation is
constraint. For example, McKay et al. (2003) have shown
that the genetic correlation between flowering time and
water use efficiency is influenced by pleiotropy: mutations
at the same gene influence both traits. Conclusively
determining whether or not the temporal trend in water
use efficiency is adaptive requires further work.
Insects and birds
The decline in body size with metamorphosis date in
insects and in clutch size with breeding date in birds
(Table 3) are usually interpreted not as ABT but as
condition-dependent optimization in a seasonal environment.
This latter theory has been mathematically formalized for
insect metamorphosis by Rowe & Ludwig (1991) and for
avian clutch size by Rowe et al. (1994). The clutch size
model, for example, assumes a trade-off between the benefits
of breeding early (offspring have higher survival) and the
benefits of breeding late (more energy can be acquired by
adults). The optimal breeding time for an individual is
then determined by its condition and by proximity to the
end of the season. The model predicts that high-condition
individuals should reproduce early and have large clutches,
whereas low-condition individuals should reproduce late
and have small clutches (Rowe et al. 1994; Bêty et al. 2003).
Both ABT and condition-dependent optimization invoke
adaptive explanations for temporal trends, but they differ
in that the former emphasizes heritable reproductive times,
whereas the later emphasizes flexible reproductive times.
As both mechanisms might act in any given population,
it seems worthwhile to ask whether ABT might be import-
ant for birds and insects. ABT does seem less likely for
birds than for salmonids or plants, simply because birds
have lower heritabilities for reproductive time (Table 1),
and yet reproductive time in at least some bird populations
is heritable (Table 1). Moreover, clutch sizes are often herit-
able (e.g. h
2
= 0.34, van der Jeugd & McCleery 2002; h
2
=
0.29, Sheldon et al. 2003), can show negative genetic cor-
relations with breeding time (−0.41, Sheldon et al. 2003),
and could reasonably be under selection that varies
through the breeding season. Less work has been done on
insects, but the length of the pupal period (closely related
to eclosion time) can be highly heritable (h
2
= 0.61, Tam-
maru et al. 1999). We suggest that ABT is a viable alter-
native hypothesis warranting explicit testing in these and
other systems.
Conclusions
Heritable reproductive times should lead to temporal
limitations on gene flow even within a single population.
This ‘isolation by time’ (IBT) appears present in both
salmonid fishes and flowering plants. IBT should allow the
evolution of adaptive temporal clines in phenotypic traits
when selection varies through the reproductive season
[‘adaptation by time’ (ABT)]. Our theoretical model confirms
this logic, but more advanced models will be necessary to
fully explore the nuances. The demonstration of ABT in
nature would ideally include evidence that (i) gene flow is
restricted in time; (ii) phenotypic traits vary through the
reproductive season; (iii) the temporal variation has a
genetic basis; and (iv) the temporal variation is adaptive.
Few studies have explicitly considered ABT, and none has
yet tested all of these criteria. Nevertheless, ABT receives
diverse support from several natural systems, most notably
salmonid fishes and flowering plants. We suspect that IBT
and ABT are relatively common in nature, simply because
reproductive times are often heritable and selection often
varies through the reproductive season. We also suggest
the interesting possibility that IBT and ABT within popu-
ISOLATION BY TIME AND ADAPTATION BY TIME 913
© 2005 Blackwell Publishing Ltd, Molecular Ecology, 14, 901–916
lations could initiate sympatric speciation by temporal
isolation (e.g. Monteiro & Furness 1998; Després & Cherif
2004).
Acknowledgements
K. Fresh, P. Bentzen, and I. Spies collected the unpublished data
shown in Fig. 4. M. Geber calculated average flowering time her-
itabilities based on Geber & Griffen (2003). Comments on the man-
uscript were provided by P. Bentzen, L. Bernatchez, E. Crispo, A.
Gharrett, M. Kinnison, M. Kirkpatrick, Y. Morbey, T. Quinn, F.
Rousset, D. Ruzzante, and anonymous reviewers. Additional
advice on relevant literature was provided by J. McKay, L. Riese-
berg, L. Rowe, R. Shaw, and B. Sinervo. A. Hendry and T. Day are
supported by the Natural Sciences and Engineering Research
Council of Canada.
Supplementary material
The supplementary material is available from
/>suppmat/MEC/MEC2480/MEC2480sm.htm
References
Andersson S (1996) Floral variation in Saxifraga granulata: pheno-
typic selection, quantitative genetics and predicted response to
selection. Heredity, 77, 217–223.
Berry O, Tocher MD, Sarre SD (2004) Can assignment tests measure
dispersal? Molecular Ecology, 13, 551–561.
Bêty J, Gauthier G, Giroux J-F (2003) Body condition, migration,
and timing of reproduction in snow geese: a test of the condition-
dependent model of optimal clutch size. American Naturalist,
162, 110–121.
Biere A, Antonovics J (1996) Sex-specific costs of resistance to the
fungal pathogen Ustilago violacea (Microbotryum violaceum) in
Silene alba. Evolution, 50, 1098–1110.
Brannon EL (1987) Mechanisms stabilizing salmonid fry emer-
gence timing. Canadian Special Publication of Fisheries and Aquatic
Sciences, 96, 120–124.
Brykov VA, Polyakova N, Skurikhina LA et al. (1999) Analysis of
mitochondrial DNA (mtDNA) indicates weak temporal genetic
heterogeneity in pink salmon runs in two rivers on Sakhalin
Island. Journal of Fish Biology, 55, 617–635.
Carey K (1983) Breeding system, genetic variability, and response to
selection in Plectritis (Valerianacea). Evolution, 37, 947–956.
Carr DE, Fenster CB (1994) Levels of genetic variation and covari-
ation for Mimulus (Scrophulariaceae) floral traits. Heredity, 72,
606–618.
Castellano S, Balletto E (2002) Is the partial Mantel test adequate?
Evolution, 56, 1871–1873.
Christians JK (2002) Avian egg size: variation within species and
inflexibility within individuals. Biological Reviews, 77, 1–26.
Conner J, Via S (1993) Patterns of phenotypic and genetic correla-
tions among morphological and life-history traits in wild radish,
Raphanus raphanistrum. Evolution, 47, 704–711.
Danzmann RG, Ferguson MM, Heculuck DM (1994) Heterogene-
ity in the distribution of mitochondrial DNA haplotypes in
female rainbow trout spawning in different seasons. Canadian
Journal of Fisheries and Aquatic Sciences, 51 (Suppl. 1), 284–289.
Day T (2000) Sexual selection and the evolution of costly female
preferences: spatial effects. Evolution, 54, 715–730.
Després L, Cherif M (2004) The role of competition in adaptive
radiation: a field study on sequentially ovipositing host-specific
seed predators. Journal of Animal Ecology, 73, 109–116.
Dickerson BR, Quinn TP, Willson MF (2002) Body size, arrival
date, and reproductive success of pink salmon, Oncorhynchus
gorbuscha. Ethology, Ecology and Evolution, 14, 29–44.
Dieringer G (1991) Variation in individual flowering time and
reproductive success of Agalinis strictifolia (Scrophulariaceae).
American Journal of Botany, 78, 497–503.
Dorn LA, Mitchell-Olds T (1991) Genetics of Brassica campestris. 1.
Genetic constraints on evolution of life-history characters.
Evolution, 45, 371–379.
Einum S, Fleming IA (2000) Selection against late emergence and
small offspring in Atlantic salmon (Salmo salar). Evolution, 54,
628–639.
Endler JA (1977) Geographic Variation, Speciation, and Clines. Princeton
University Press, Princeton, New Jersey.
Ennos RA, Dodson RK (1987) Pollen success, functional gender
and assortative mating in an experimental plant population.
Heredity, 58, 119–126.
Ferguson MM, Danzmann RG, Arndt SKA (1993) Mitochondrial
DNA and allozyme variation in Ontario cultured rainbow trout
spawning in different seasons. Aquaculture, 117, 237–259.
Fillatre EK, Etherton P, Heath DD (2003) Bimodal run distribution
in a northern population of sockeye salmon (Oncorhynchus
nerka): life history and genetic analysis on a temporal scale.
Molecular Ecology, 12, 1793–1805.
Findlay CS, Cooke F (1982) Breeding synchrony in the lesser snow
goose (Anser caerulescens caerulescens). I. Genetic and environ-
mental components of hatch date variability and their effects on
hatch synchrony. Evolution, 36, 342–351.
Fishback AG, Danzmann RG, Ferguson MM (2000) Microsatellite
allelic heterogeneity among hatchery rainbow trout maturing in
different seasons. Journal of Fish Biology, 57, 1367–1380.
Fleming IA, Reynolds JD (2004) Salmonid breeding systems. In:
Evolution Illuminated: Salmon and Their Relatives (eds Hendry AP,
Stearns SC), pp. 264–294. Oxford University Press, Oxford.
Forrest TG (1987) Insect size tactics and developmental strategies.
Oecologia, 73, 178–184.
Fox GA (2003) Assortative mating and plant phenology: evolutionary
and practical consequences. Evolutionary Ecology Research, 5, 1–18.
Fripp YJ, Griffin AR, Moran GF (1987) Variation in allele frequen-
cies in the outcross pollen pool of Eucalyptus regans F. Muell.
throughout a flowering season. Heredity, 59, 161–171.
Gall GAE, Neira R (2004) Genetic analysis of female reproduction
traits of farmed coho salmon (Oncorhynchus kisutch). Aquaculture,
234, 143–154.
García-Ramos G, Kirkpatrick M (1997) Genetic models of adapta-
tion and gene flow in peripheral populations. Evolution, 51, 21–
28.
Geber MA, Dawson TE (1990) Genetic variation in and covaria-
tion between leaf gas exchange, morphology, and development
in Polygonum arenastrum, an annual plant. Oecologia, 85, 153–
158.
Geber MA, Griffen LR (2003) Inheritance and natural selection on
functional traits. International Journal of Plant Science, 164 (3
Suppl.), S21–S42.
Gustafsson S, Lönn M (2003) Genetic differentiation and habitat
preference of flowering-time variants within Gymnadenia conopsea.
Heredity, 91, 284–292.
914 A. P. HENDRY and T. D AY
© 2005 Blackwell Publishing Ltd, Molecular Ecology, 14, 901–916
Gutierrez MG, Sprague GF (1959) Randomness of mating in isolated
polycross plantings of maize. Genetics, 44, 1075–1082.
Hansen MM, Kenchington E, Nielsen EE (2001) Assigning indi-
vidual fish to populations using microsatellite DNA markers.
Fish and Fisheries, 2, 93–112.
Healey MC (1971) Gonad development and fecundity of the sand
goby, Gobius minutus Pallas. Transactions of the American Fisheries
Society, 100, 520–526.
Hebert KP, Goddard PL, Smoker WW, Gharrett AJ (1998) Quanti-
tative genetic variation and genotype by environment inter-
action of embryo development rate in pink salmon (Oncorhynchus
gorbuscha). Canadian Journal of Fisheries and Aquatic Sciences, 55,
2048–2057.
Hendry AP, Berg OK, Quinn TP (1999) Condition dependence and
adaptation-by-time: breeding date, life history, and energy
allocation within a population of salmon. Oikos, 85, 499–514.
Hendry AP, Berg OK, Quinn TP (2001) Breeding location choice in
salmon: causes (habitat, competition, body size, energy stores)
and consequences (lifespan, energy stores). Oikos, 93, 407–418.
Hendry AP, Hensleigh JE, Reisenbichler RR (1998) Incubation
temperature, developmental biology, and the divergence of
sockeye salmon (Oncorhynchus nerka) within Lake Washington.
Canadian Journal of Fisheries and Aquatic Sciences, 55, 1387–
1394.
Hendry AP, Morbey YE, Berg OK, Wenburg JK (2004) Adaptive
variation in senescence: reproductive lifespan in a wild salmon
population. Proceedings of the Royal Society of London. Series B,
Biological Sciences, 271, 259–266.
Hochachka W (1990) Seasonal decline in reproductive performance
of song sparrows. Ecology, 71, 1279–1288.
Johnson JE (1971) Maturity and fecundity of the threadfin shad,
Dorosoma petenense (Günther), in central Arizona reservoirs.
Transactions of the American Fisheries Society, 100, 74–85.
Kelly CA (1993) Quantitative genetics of size and phenology of
life-history traits in Chamaecrista fasciculata. Evolution, 47, 88–97.
Kimura M, Weiss GH (1964) The stepping stone model of popula-
tion structure and the decrease of genetic correlation with
distance. Genetics, 49, 561–576.
Kirkpatrick M, Barton NH (1997) Evolution of a species’ range.
American Naturalist, 150, 1–23.
Kisdi É (2002) Dispersal: risk spreading versus local adaptation.
American Naturalist, 159, 579–596.
Koornneef M, Alonso-Blanco C, Peeters AJM, Soppe W (1998)
Genetic control of flowering time in Arabidopsis. Annual Review
of Plant Physiology and Plant Molecular Biology, 49, 345–370.
Laine P, Rajasilta M (1998) Changes in the reproductive properties
of Baltic herring females during the spawning season. Fisheries
Research, 36, 67–73.
Langston NE, Freeman S, Rohwer S, Gori D (1990) The evolution
of female body size in red-winged blackbirds: the effects of tim-
ing of breeding, social competition, and reproductive energetics.
Evolution, 44, 1764–1779.
Leary RF, Allendorf FW, Knudsen KL (1989) Genetic differences
among rainbow trout spawned on different days within a single
season. Progressive Fish-Culturist, 51, 10–19.
Lenormand T (2002) Gene flow and the limits to natural selection.
Trends in Ecology and Evolution, 17, 183–189.
Lyons EE, Mully TW (1992) Density effects on flowering phenology
and mating potential in Nicotiana alata. Oecologia, 91, 93–100.
Mantel N (1967) The detection of disease clustering and a general-
ized regression approach. Cancer Research, 27, 209–220.
Mathur D, Ramsey JS (1974) Reproductive biology of the rough
shiner, Notropis baileyi, in Halawakee Creek, Alabama. Trans-
actions of the American Fisheries Society, 103, 88–93.
Mazer SJ (1987) The quantitative genetics of life history and fitness
components in Raphanus raphanistrum L. (Brassicaceae): ecolog-
ical and evolutionary consequences of seed-weight variation.
American Naturalist, 130, 891–914.
Mazer SJ, Schick CT (1991) Constancy of population parameters
for life history and floral traits in Raphanus sativus L. II. Effects
of planting density on phenotype and heritability estimates.
Evolution, 45, 1888–1907.
McGregor AJ, Lane S, Thomason MA et al. (1998) Migration tim-
ing, a life history trait important in the genetic structure of pink
salmon. North Pacific Anadromous Fish Commission Bulletin, 1,
262–273.
McKay JK, Richards JH, Mitchell-Olds T (2003) Genetics of
drought adaptation in Arabidopsis thaliana. I. Pleiotropy contributes
to genetic correlations among ecological traits. Molecular
Ecology, 12, 1137–1151.
McPhee MV, Quinn TP (1998) Factors affecting the duration of
nest defence and reproductive lifespan of female sockeye
salmon, Oncorhynchus nerka. Environmental Biology of Fishes, 51,
369–375.
Meijer T, Daan S, Hall M (1990) Family planning in the kestrel
(Falco tinnunculus): the proximate control of covariation of laying
date and clutch size. Behaviour, 114, 117–136.
Merilä J, Sheldon BC (2000) Lifetime reproductive success and
heritability in nature. American Naturalist, 155, 301–310.
Miranda LE, Muncy RJ (1987) Recruitment of young-of-year large-
mouth bass in relation to size structure of parental stock. North
American Journal of Fisheries Management, 7, 131–137.
Mitchell RJ, Shaw RG (1993) Heritability of floral traits for the
perennial wild flower Penstemon centranthifolius (Scrophular-
iaceae): clones and crosses. Heredity, 71, 185–192.
Møller AP (2001) Heritability of arrival date in a migratory bird.
Proceedings of the Royal Society of London. Series B, Biological Sci-
ences, 268, 203–206.
Monteiro LR, Furness RW (1998) Speciation through temporal
segregation of Madeiran storm petrel (Oceanodroma castro) popu-
lations in the Azores? Philosophical Transactions of the Royal
Society of London. Series B, Biological Sciences, 353, 945–953.
Morbey YE, Abrams PA (2004) The interaction between reproduc-
tive lifespan and protandry in seasonal breeders. Journal of
Evolutionary Biology, 17, 768–778.
Morbey YE, Ydenberg RC (2003) Timing games in the reproduc-
tive phenology of female Pacific salmon (Oncorhynchus spp.).
American Naturalist, 161, 284–298.
Neilson JD, Banford CE (1983) Chinook salmon (Oncorhynchus
tshawytscha) spawner characteristics in relation to redd physical
features. Canadian Journal of Zoology, 61, 1524–1531.
Neilson JD, Geen GH (1981) Enumeration of spawning salmon
from spawner residence time and aerial counts. Transactions of
the American Fisheries Society, 110, 554–556.
Nelson RJ, Beacham TD (1999) Isolation and cross species ampli-
fication of microsatellite loci useful for study of Pacific salmon.
Animal Genetics, 30, 228.
O’Malley KG, Sakamoto T, Danzmann RG, Ferguson MM (2002)
Quantitative trait loci for spawning date and body weight in
rainbow trout: testing for conserved effects across ancestrally
duplicated chromosomes. Journal of Heredity, 94, 273–284.
O’Neil P (1997) Natural selection on genetically correlated pheno-
logical characters in Lythrum salicaria L. (Lythraceae). Evolution,
51, 267–274.
ISOLATION BY TIME AND ADAPTATION BY TIME 915
© 2005 Blackwell Publishing Ltd, Molecular Ecology, 14, 901–916
Olsen JB, Bentzen P, Banks MA, Shaklee JB, Young S (2000) Micro-
satellites reveal population identity of individual pink salmon
to allow supportive breeding of a population at risk of extinc-
tion. Transactions of the American Fisheries Society, 129, 232–242.
Pease CM, Lande R, Bull JJ (1989) A model of population growth,
dispersal and evolution in a changing environment. Ecology, 70,
1657–1664.
Perdeck AC, Cavé AJ (1992) Laying date in the coot: effects of age
and mate choice. Journal of Animal Ecology, 61, 13–19.
Plaistow S, Siva-Jothy MT (1999) The ontogenetic switch between
odonate life history stages: effects on fitness when time and food
are limited. Animal Behaviour, 58, 659–667.
Pors B, Werner PA (1989) Individual flowering time in a golden-
rod (Solidago canadensis): field experiment shows genotype more
important than environment. American Journal of Botany, 76,
1681–1688.
Potti J (1998) Arrival time from spring migration in male pied
flycatchers: individual consistency and familial resemblance.
Condor, 100, 702–708.
Primack RB (1980) Variation in the phenology of natural popula-
tions of montane shrubs in New Zealand. Journal of Ecology, 68,
849–862.
Purrington CB, Schmitt J (1998) Consequences of sexual dimorphic
timing of emergence and flowering in Silene latifolia. Journal of
Ecology, 86, 397–404.
Quinn TP, Unwin MJ, Kinnison MT (2000) Evolution of temporal
isolation in the wild: genetic divergence in timing of migration
and breeding by introduced chinook salmon populations.
Evolution, 54, 1372–1385.
Rajasilta M, Laine P, Hänninen J (2001) Ovarian weight of the
Baltic herring (Clupea harengus membras) in relation to spawning
time in the Archipelago Sea, northern Baltic. ICES Journal of
Marine Science, 58, 106–113.
Ramstad KM, Foote CJ, Olsen JB, Rogers D (2003) Genetic and
phenotypic evidence of reproductive isolation between seasonal
runs of sockeye salmon in Bear Lake, Alaska. Transactions of the
American Fisheries Society, 132, 997–1013.
Rantala MJ, Hovi M, Korkeamäki E, Suhonen J (2001) No trade-off
between the size and timing of emergence in the damselfly,
Calopteryx virgo L. Annales Zoologici Fennici, 38, 117–122.
Ravigne V, Olivieri O, Dieckmann U (2004) Implications of habitat
choice for protected polymorphisms. Evolutionary Ecology
Research, 6, 125–145.
Réale D, Berteaux D, McAdam AJ, Boutin S (2003) Lifetime selec-
tion on heritable life-history traits in a natural population of red
squirrels. Evolution, 57, 2416–2423.
Ridgway MS, Shuter BJ, Post EE (1991) The relative influence of
body size and territorial behaviour on nesting asynchrony in
male smallmouth bass, Micropterus dolomieui (Pisces: Centrarchidae).
Journal of Animal Ecology, 60, 665–681.
Roff DA (1997) Evolutionary Quantitative Genetics. Chapman &
Hall, New York.
Rousset F (1997) Genetic differentiation and estimation of gene
flow from F-statistics under isolation by distance. Genetics, 145,
1219–1228.
Rousset F (2000) Genetic differentiation between individuals.
Journal of Evolutionary Biology, 13, 58–62.
Rousset F (2002) Partial Mantel tests: reply to Castellano and
Balletto. Evolution, 56, 1874–1875.
Rowe L, Ludwig D (1991) Size and timing of metamorphosis in
complex life cycles: time constraints and variation. Ecology, 72,
413–427.
Rowe L, Ludwig D, Schluter D (1994) Time, condition, and the
seasonal decline of avian clutch size. American Naturalist, 143,
698–722.
Sakamoto T, Danzmann RG, Okamoto N, Ferguson MM, Ihssen
PE (1999) Linkage analysis of quantitative trait loci associated
with spawning time in rainbow trout (Oncorhynchus mykiss).
Aquaculture, 173, 33–43.
Sampson JF, Hopper SD, James SH (1990) Temporal variation in
allele frequencies in the pollen pool of Eucalyptus rhodantha.
Heredity, 65, 189–199.
Schemske DW (1977) Flowering phenology and seed set in Clayto-
nia virginica (Portulacaceae). Bulletin of the Torrey Botanical Club,
104, 254–263.
Schluter D (2000) The Ecology of Adaptive Radiation. Oxford Univer-
sity Press, Oxford.
Schmitt J (1983) Individual flowering phenology, plant size, and
reproductive success in Linanthus androsaceus, a California
annual. Oecologia, 59, 135–140.
Schultz ET, Clifton LM, Warner RR (1991) Energetic constraints
and size-based tactics: the adaptive significance of breeding-
schedule variation in a marine fish (Embiotocidae: Micrometrus
minimus). American Naturalist, 138, 1408–1430.
Scribner KT, Gust JR, Fields RL (1996) Isolation and characterization
of novel salmon microsatellite loci: cross-species amplification
and population genetic applications. Canadian Journal of Fisheries
and Aquatic Sciences, 53, 833–841.
Sheldon BC, Kruuk LEB, Merilä J (2003) Natural selection and
inheritance of breeding time and clutch size in the collared
flycatcher. Evolution, 57, 406–420.
Siitonen L, Gall GAE (1989) Response to selection for early
spawn date in rainbow trout, Salmo gairdneri. Aquaculture, 78,
153–161.
Sinervo B, Doughty P (1996) Interactive effects of offspring size
and timing of reproduction on offspring reproduction: experi-
mental, maternal, and quantitative genetic aspects. Evolution,
50, 1314–1327.
Slatkin M (1978) Spatial patterns in the distributions of polygenic
characters. Journal of Theoretical Biology, 70, 213–228.
Slatkin M (1993) Isolation by distance in equilibrium and non-
equilibrium populations. Evolution, 47, 264–279.
Smoker WW, Gharrett AJ, Stekoll MS (1998) Genetic variation of
return date in a population of pink salmon: a consequence of
fluctuating environment and dispersive selection? Alaska
Fishery Research Bulletin, 5, 46–54.
Smouse PE, Long JC, Sokal RR (1986) Multiple regression and cor-
relation extensions of the Mantel test of matrix correspondence.
Systematic Zoology, 35, 627–632.
Soliva M, Widmer A (1999) Genetic and floral divergence among
sympatric populations of Gymnadenia conopsea S.L. (Orchideaceae)
with different flowering phenology. International Journal of Plant
Sciences, 160, 897–905.
Stanton ML, Galen C, Shore J (1997) Population structure along a
steep environmental gradient: consequences of flowering time
and habitat variation in the snow buttercup, Ranunculus adoneus.
Evolution, 51, 79–94.
Su G-S, Liljedahl L-E, Gall GAE (1997) Genetic and environmental
variation of female reproductive traits in rainbow trout
(Oncorhynchus mykiss). Aquaculture, 154, 115–124.
Su G-S, Liljedahl L-E, Gall GAE (1999) Estimates of phenotypic
and genetic parameters for within-season date and age at
spawning of female rainbow trout. Aquaculture, 171, 209–
220.
916 A. P. HENDRY and T. D AY
© 2005 Blackwell Publishing Ltd, Molecular Ecology, 14, 901–916
Svensson E (1997) Natural selection on avian breeding time:
causality, fecundity-dependent, and fecundity-independent
selection. Evolution, 51, 1276–1283.
Tallman RF (1986) Genetic differentiation among seasonally dis-
tinct spawning populations of chum salmon, Oncorhynchus keta.
Aquaculture, 57, 211–217.
Tallman RF, Healey MC (1994) Homing, straying, and gene flow
among seasonally separated populations of chum salmon,
Oncorhynchus keta. Canadian Journal of Fisheries and Aquatic
Sciences, 51, 577–588.
Tammaru T, Ruohomäki K, Saloniemi I (1999) Within-season vari-
ability of pupal period in the autumnal moth: a bet-hedging
strategy? Ecology, 80, 1666–1677.
Taylor SG (1980) Marine survival of pink salmon fry from early
and late spawners. Transactions of the American Fisheries Society,
109, 79–82.
Thrall PH, Jarosz AM (1994) Host-pathogen dynamics in experi-
mental populations of Silene alba and Ustilago violacea. I. Ecological
and genetic determinants of disease spread. Journal of Ecology,
82, 549–559.
Van der Jeugd HP, McCleery R (2002) Effects of spatial auto-
correlation, natal philopatry and phenotypic plasticity on the
heritability of laying date. Journal of Evolutionary Biology, 15,
380–387.
Vannote RL, Sweeney BW (1980) Geographic analysis of thermal
equilibria: a conceptual model for evaluating the effect of natural
and modified thermal regimes on aquatic insect communities.
American Naturalist, 115, 667–695.
Van Noordwijk AJ, Van Balen JH, Scharloo W (1981) Genetic varia-
tion in the timing of reproduction in the great tit. Oecologia, 49,
158–166.
Weis AE, Kossler TM (2004) Genetic variation in flowering time
induces phenological assortative mating: quantitative genetic
methods applied to Brassica rapa. American Journal of Botany, 91,
825–836.
Widén B, Andersson S (1993) Quantitative genetics of life-history
and morphology in a rare plant, Senecio integrifolius. Heredity, 70,
503–514.
Wiegmann DD, Baylis JR, Hoff MH (1997) Male fitness, body size
and timing of reproduction in smallmouth bass, Micropterus
dolomieui. Ecology, 78, 111–128.
Wiggins DA (1991) Natural selection on body size and laying date
in the tree swallow. Evolution, 45, 1169–1174.
Willis RA (1954) The length of time that silver salmon spent before
death on the spawning grounds at spring creek, Wilson River,
in 1951–52. Fish Commission of Oregon Research Briefs, 5, 1–5.
Wilson AJ, McDonald G, Moghadam HK, Herbinger CM,
Ferguson MM (2003) Marker-assisted estimation of quantitative
genetic parameters in rainbow trout, Oncorhynchus mykiss.
Genetical Research, Cambridge, 81, 145–156.
Winkler DW, Dunn PO, McCulloch CE (2002) Predicting the
effects of climate change on avian life history traits. Proceedings
of the National Academy of Sciences of the United States of America,
99, 13595–13599.
Woody CA, Olsen J, Reynolds J, Bentzen P (2000) Temporal vari-
ation in phenotypic and genotypic traits in two sockeye salmon
populations, Tustumena Lake, Alaska. Transactions of the
American Fisheries Society, 129, 1031–1043.
Wright S (1943) Isolation by distance. Genetics, 28, 114–138.
Wright S (1946) Isolation by distance under diverse systems of
mating. Genetics, 31, 39–59.
Yu Y, Harding J, Byrne T, Famula T (1993) Estimation of components
of genetic variance and heritability for flowering time and yield
in gerbera using derivative-free restricted maximum likelihood
(DFRML). Theoretical and Applied Genetics, 86, 234–236.
Andrew Hendry studies the evolution of biological diversity,
particularly with respect to interactions between natural selection,
gene flow, adaptation and the evolution of reproductive isolation.
His primary empirical systems are salmonid fishes, threespine
sticklebacks, Trinidadian guppies and Darwin’s finches. Troy
Day is a theoretical evolutionary biologist who studies the
evolutionary dynamics of intraspecific and interspecific inter-
actions. He is particularly interested in social evolution, host-
parasite coevolution, and the evolutionary dynamics of other
conflicts at various scales of biological organization.