Ebook Behavioral interactions, markets, and economic dynamics: Topics in behavioral economics - Part 2
Bạn đang xem bản rút gọn của tài liệu. Xem và tải ngay bản đầy đủ của tài liệu tại đây (4.45 MB, 326 trang )
Part IV
Bubbles and Crash
Chapter 12
Why Did the Nikkei Crash? Expanding
the Scope of Expectations Data Collection
Robert J. Shiller, Fumiko Kon-Ya, and Yoshiro Tsutsui
Abstract Why did the Japanese stock market lose most of its value between 1989
and 1992? To help us answer this and related questions, we have collected parallel
time series data from market participants in both Japan and the United States
1989–1994 on their expectations, attitudes, and theories. Substantial variability
within countries through time in these data and, notably, dramatic differences across
countries in expectations were found. While no unambiguous explanation of the
Japanese crash emerges from the results, we do find a clear relation of the crash to
changes in Japanese price expectations and speculative strategies.
Keywords Bubble crash • Nikkei • Investor behavior
JEL Classification Codes G02
1 Introduction
The Nikkei stock price average in Japan, after rising dramatically through the 1980s,
fell from 38915.9 on December 29, 1989 to 14309.4 on August 18, 1992, a decline
of 63.2 % (see Fig. 12.1). In real terms, using the Japanese consumer price index
The original article first appeared in The Review of Economics and Statistics, 78(1): 156–164,
1996. A newly written addendum has been added to this book chapter.
R.J. Shiller
Sterling Professor of Economics, Yale University, 30 Hillhouse Avenue,
New Haven, CT 06520, USA
e-mail:
F. Kon-Ya
Y. Tsutsui ( )
Faculty of Economics, Konan University, 8-9-1 Okamoto, Hyogo,
Kobe 658-8501, Japan
e-mail:
© Springer Japan 2016
S. Ikeda et al. (eds.), Behavioral Interactions, Markets, and Economic Dynamics,
DOI 10.1007/978-4-431-55501-8_12
335
336
R.J. Shiller et al.
Fig. 12.1 Nikkei 225 stock price average, end of months, Sept. 1979 to June 1994 (Source: Nikkei
Shinbun)
to correct for inflation, the decline between these two dates was 65.8 %. This stock
market crash was not worldwide; in the United States over the same interval of time
stock prices rose. Despite the magnitude and importance of the drop in the Nikkei,
we know nothing solid about the origins of this event. Data about fundamentals
of the Japanese economy provide no unambiguous reason for the crash. Thus, the
Nikkei crash must have taken the form of a change in expectations or attitudes, about
which there is little concrete to say beyond the fact that the Nikkei dropped.
The Nikkei crash is examined here as a study for the development of research
methods that can give us a better understanding of such events. We report here on our
collection of detailed time series data in Japan and the United States on expectations
and understanding of speculative markets, before, during and after the crash of
the Nikkei. We began our study before the crash partly because of a conjecture
(expressed by some observers of the Tokyo market) that a crash might happen there.
The questions for which we produced time series data on answers are unusual, and,
we think, suggest some new methodology for studying financial markets. Some of
our questions are intended to produce detailed accounts of expectations, over various
horizons including long-term horizons. Other questions posed to our respondents
in the surveys are of a rather more interpretive nature than are questions in most
surveys, for example, questions about their speculative motives for holding stocks
or their expectations about what would happen in the market if something else
happened. All data are collected on a consistent basis about these expectations
through time and across countries.
Time series data, data collected on a consistent basis at regular intervals for an
extended period of time, are of fundamental importance to statistical analysis. Any
12 Why Did the Nikkei Crash? Expanding the Scope of Expectations Data Collection
337
such long systematic time series can be analyzed in connection with all other time
series that are available over the same period. Experience with time series data, and
a consensus on their meaning, develops gradually as the data series are extended.1
We do not expect to be able to offer a good understanding of the sources of the
Nikkei crash from an analysis of the short (less than 5-year’s span) time series we
have produced for Japan and the United States. Our primary objective here is to
establish that various expectations and attitudinal variables were changing over the
time, and that the Japanese variables departed substantially from the corresponding
variables measured in the United States, where the stock market behavior was quite
different. We will also, however, offer some tentative interpretation of the Nikkei
crash with the benefit of our data.
2 A Preliminary on Fundamentals in Japan
The crash in the Nikkei was followed by a sharp drop in the earnings of the
constituent companies in Japan, so that the price-earnings ratio based on results rose,
despite decline at the time of the crash in the Nikkei, in 1994 well above pre-crash
levels: see Fig. 12.2. It is natural to hypothesize, then, that the crash in the Nikkei
was due to new information about the outlook for earnings, information hitting the
market before the actual drop in earnings. This simple hypothesis, however, may
not be entirely satisfactory. The price-earnings ratio based on expected earnings
(see also Fig. 12.2) declined about as much as the price-earnings ratio based on
results between the peak and trough of the market.2 There was virtually no decline
between the end of 1989 and the end of 1990, a time interval during which most of
the decline in the Nikkei occurred in 1-year-ahead forecasted earnings in Japan as
compiled by I/B/E/S Inc.3
From publicly available data, we do not know whether market participants were
reacting to information in 1990 about a less encouraging long-run outlook for
earnings. We also do not know whether market participants were thinking in 1991
and 1992 that the decline in earnings since the crash is expected to be reversed,
and that it was a temporary business-cycle-related decline that may not last more
than a few years. If this was their expectation at the time, then the earnings decline
would not appear adequate to explain a major crash in prices. Note that the sharp
earnings declines reported in Japan near the end of our sample resulted in the sharp
run up of price-earnings ratios in 1994, rather than yet another large drop in prices.
1
In contrast, the post-event studies of stock market crashes that are typically conducted after the
fact have relatively little power to discover what was changing importantly at the time of the crash.
2
The Nikkei Shinbun price-earnings ratio based on expected earnings is an average across firms
of price-earnings ratios, where the denominator of the ratio for each firm is expected earnings as
reported by the firm itself. The horizon of these expectations differs across firms.
3
See Wall Street Journal, March 17, 1994.
338
R.J. Shiller et al.
Fig. 12.2 Price-earnings ratio of Tokyo Stock Exchange 225 stocks, based on results (solid line)
and based on expectations (dashed line), monthly, Sept. 1978 to June 1994 (Source: Nikkei
Shinbun)
Movements in the stock markets of the world are not tightly related to earnings
movements.
Of course, we do not deny that fundamentals play an important role in forming
the level of the Nikkei. It is easy to count up facts that are consistent with the
movement of the Nikkei for a limited period. It is hard, however, to find those which
are consistent throughout a long period.
For example, the rise of Japanese long-term interest rates from July 1989 to
September 1990 may be pointed out as a suspect in the crash. The rise is reflected
in the consecutive increases in the discount rate from 2.5 % in May 1989 to 6 % at
the end of August 1990. Thus, one might argue that the change in the attitude of the
Bank of Japan toward a tight monetary policy is a cause of the crash.4 However, the
fact does not explain why the Nikkei continued rising sharply during 1989 despite
the rapid rise of the interest rates, and why the crash began at the beginning of
1990. Historically, stock markets do not show any consistent behavior in response to
sudden tightening of monetary policy; note for example, that the sudden tightening
in monetary policy in the United States in 1994, roughly comparable in magnitude
to the tightening in Japan in 1989–1990, produced no overall U.S. stock market
decline.
4
Ueda (1992) expresses this view.
12 Why Did the Nikkei Crash? Expanding the Scope of Expectations Data Collection
339
3 Existing Time Series Data for the Japanese and United
States Stock Markets
Few time series data are collected regarding stock market expectations. Governments are the main provider of high- quality time series data on an uninterrupted and
inter-temporally consistent basis. Yet the Japanese and U.S. governments apparently
collect no such series on expectations in the financial markets. In the industry, there
are some attempts to collect time series data on stock market expectations, but none
of these attempts matches the scope of our study.
In Japan, there appears to be only one published price expectations survey.
The Nikkei Financial Daily reports every Saturday the results of a survey of five
securities companies, three banks, seven institutional investors and three foreign
companies, in which are given the number of respondents who expect that the
markets will be more bullish, more bearish, or neutral compared with the current
week. This is their only published expectations question, the number of respondents
is quite small, and their time series goes back only to October, 1987. The Quick
Research Corporation has been sending a questionnaire to about 300 securities
companies and institutional investors in Japan every month since April 1994; they
ask about 1-, 3- and 6-month ahead expectations for the Nikkei average. Their
results are reported to subscribers by fax, but have not been published yet.
For the United States, there is the very long time series data, extending back to
1952, of Livingston, which is analyzed by De Bondt (1991). Livingston asked his
panel of about 40 economists to forecast the Standard and Poor Index at horizons of
7 and 13 months. From the early 1980s and until its bankruptcy, Drexel, Burnham
Lambert tabulated the results of a few expectations questions about the stock market
under the direction of Richard Hoey. For the past 6 years, Money Market Services,
Inc. of New York has collected 1-week and 1-month expectations for the Dow Jones
Industrial Average and for the Standard and Poor Composite Index. All of these
are surveys of experts only, not intended to be surveys of market participants. The
American Association of Individual Investors has been sending out for the past
few years weekly postcard questionnaires to their members, inquiring about their
opinion as to the outlook for the market. As far as we have been able to determine,
existing surveys ask only a few questions about the market, and do not try to devise
batteries of questions that get at the reasons for market behavioral patterns.
4 Our Surveys
We tabulate here responses in both Japan and the United States in a number of
mail surveys we conducted from 1989 to 1994. We created a biannual series of
answers; questionnaires were mailed roughly every 6 months. For the Japanese
sample, we mailed to almost all of the major Japanese financial institutions, which
consist of 165 banks, 46 insurance companies, 113 securities companies, and 45
340
R.J. Shiller et al.
investment trust companies.5 No non-financial corporations are included in the
sample. The U.S. institutional investors were selected at random each time from
the section “Investment Managers” from the Money Market Directory of Pension
Funds and their Investment Managers (McGraw Hill). In each mailing, about 400
questionnaires were sent, yielding responses from about a third. Mailing dates in
Japan were July 3, 1989 (1989-II), November 9, 1989 (end 1989), March 6, 1990
(1990-I), August 10, 1990, February 2, 1991, September 9, 1991, March 27, 1992,
September 11, 1992, March 19, 1993, August 4, 1993 and February 28, 1994. First
mailing dates in the United States were July 5, 1989, January 17, 1990, July 27,
1990, January 31, 1991, August 20, 1991, January 31, 1992, August 20, 1992,
February 12, 1993, August 6, 1993, and February 28, 1994. In the United States,
a second questionnaire and letter were sent out three weeks after the first mailing to
those who had not responded yet.
In all but the 1989-II and 1990-I questionnaires the first portions of the
questionnaires, which included the questions reported here, were nearly identical
both through time and across the two countries, except, of course, for translation
into English or Japanese. The responses thus enable us to make accurate comparison
across countries and through time.
4.1 Questions About Expectations
We asked respondents to give forecasted changes in the Nikkei 225 (Nikkei Dow)
and the Dow Jones Industrial Average for horizons of 3 months, 6 months, 12
months, and 10 years. The question on the questionnaires was
I-1,2 “How much of a change in percentage terms do you expect in the following
(use C before your number to indicate an expected increase, a - to indicate an expected
decrease, leave blanks where you do not know): [FILL IN ONE NUMBER FOR EACH]”
After this question there were spaces to fill in the expectations for the various
horizons and the two countries. The mean answers for the 1-year horizon are shown
in Table 12.1; expectations in both countries for both countries are presented. The
results confirm that the expectations do change through time both for the United
States and Japan; the F-statistics (Table 12.1) for the null hypothesis of constancy
through time of expectations are all highly significant.
We also see in the answers to the Table 12.1 questions confirmation that there
are striking differences between U.S. and Japanese expectations, even for the
same markets. The Japanese were uniformly more optimistic in their short-run
expectations for the Japanese market than were the Americans. At a horizon of 1
year, there was usually a spread on the order of 20 % points between the Japanese
and U.S. forecasts for the Japanese market; the spread was never less than 10 %
5
These numbers vary slightly over time; the numbers given are for 1989-II and 1992-I surveys.
12 Why Did the Nikkei Crash? Expanding the Scope of Expectations Data Collection
341
Table 12.1 Expectations questions
A. Expectations for Japanese economy
I–1
Japanese
Nikkei 225
expected 1-year
index at time
growth in Nikkei
Date
of survey
index (%)
1989-II
33631
9.49
1989 end 35894
13.02
1990-I
32616
10.84
1990-II
26490
8.22
1991-I
24935
19.33
1991-II
23332
18.36
1992-I
18436
20.85
1992-II
18066
27.69
1993-I
19048
14.08
1993-II
20322
15.85
1994-I
20091
16.27
Test of time constancy:
F(10,1237)D10.82
pD
8.29 10 18
B. Expectations for United States economy
I–1
Dow Jones
Japanese
Industrial
expected 1-year
Average at
growth in DJIA
Time of
Date
Survey (DJIA) (%)
1989-II
2554
8.48
1989 end 2553
12.57
1990-I
2716
4.28
1990-II
2902
11.26
1991-I
3043
8.55
1991-II
3245
3.41
1992-I
3257
0.89
1992-II
3343
0.35
1993-I
3579
0.83
1993-II
3831
0.88
1994-I
2554
8.48
Test of time constancy:
F(9,961)D14.53
pD
0.00
I–2
U.S. expected
1-year growth in
Nikkei index
(%)
7.67
–
9.14
8.76
0.94
2.52
0.33
6.47
3.22
1.02
1.34
F(9,687)D9.19
1.06 10 13
I–3
Japanese 10-year
expected Japanese
corporate earnings
(annual rate) (%)
5.02
–
–
5.01
4.68
4.25
3.95
4.65
4.76
3.64
3.70
F(8,1045)D6.19
7.87 10 8
I–2
I–3
U.S. 10-year
expected growth in
U.S. corporate
earnings (annual
rate) (%)
5.57
5.16
4.63
5.02
5.52
5.68
2.50
5.50
4.98
5.56
5.57
F(9,1315)D13.36
1.19 10 20
U.S. expected
1-year growth in
DJIA (%)
3.49
0.26
1.65
6.17
7.82
6.51
4.49
2.01
0.56
2.75
3.49
F(9,1154)D4.65
4.53 10 6
Note: Index values are for close of first market day 10 or more days after first mailing date for
questionnaire. F-statistics test null hypothesis that values are constant through time
342
R.J. Shiller et al.
points.6 There is a strong correlation between the U.S. and Japanese forecasts for
the Nikkei, the correlation coefficient between the average answers for questions I-1
and I-2 for the Nikkei as shown in Table 12.1 is 0.83. Respondents in both countries
became relatively optimistic or pessimistic at about the same time, but there was
always the enormous spread between their expectations.
What can we make of the stunning differences between the expectations in the
two countries for the Nikkei? Investors on both sides of the Pacific Ocean have
access to much of the same information, and they can talk to each other, they can
listen to each others’ pundits. Why should their expectations differ depending on
which country is their home? Perhaps the difference has something to do with
personal daily talk among investors or with some irrationality related to patriotism
or wishful thinking; see Shiller (1995).
These remarkable differences in expectations between U.S. and Japanese respondents have some potential use in explaining other puzzles. Consider, for example,
the puzzle posed by French and Poterba (1990), that there is very little crossborder stocks investment between the United States and Japan. Our results suggest a
possibly simple explanation: investors in each country are relatively more optimistic
about the stock market in their own country. For another example, consider the
Feldstein-Horioka (1980) puzzle that aggregate investment in each country tends
to be highly correlated with aggregate savings in that country; that people may
be optimistic about their own country certainly must be relevant to understanding
that puzzle. More research could be done to establish the potential validity of such
notions, if longer time series become available.
We also asked for expected long-term earnings growth rates. The question was:
I-3 “What do you think the rate of growth of real (inflation adjusted) corporate earnings will
be on average in the US over the next 10 years?
Annual percentage rate: ______%”
The 10-year horizon was chosen as a proxy for the kind of long-term expectations
for earnings growth that are thought to influence price-earnings ratios. Asking
directly for long-term expectations represents a significant new departure. In
studying the reasons for high Japanese price-earnings ratios, French and Poterba
(1991), lacking our data, used forecasted 10-year growth rates for Japanese gross
national product provided by a single forecasting company; our survey data are a
much more direct measure of the relevant expectations.
We see a fairly steady decline since 1989-II in these long-run expected growth
rates in Japan (Table 12.1). Such a gradual decline, other things equal, might be
expected to have produced a correspondingly gradual decline in price-earnings
ratios in Japan.
6
At a horizon of ten years, on the other hand, there was much less discrepancy between the Japanese
and U.S. forecast for the Nikkei and in the most recent survey it was the U.S. respondents who were
more optimistic about this long-run outlook for the Nikkei.
12 Why Did the Nikkei Crash? Expanding the Scope of Expectations Data Collection
343
It should be noted that many researchers feel that the expectations data collected
by surveys such as these are by necessity inferior to expectations inferred or derived
from market prices. Consider, for example, the expectations for future stock price
index changes that can be inferred from prices in the stock index options markets. It
is possible to infer from options prices not only implied variances of price changes
but also implied skewness of subjective distributions of price changes. There are
thus, in market prices, implicit expectations of the probabilities of a market decline.
Thus, for example, Bates (1991) was able to analyze whether the stock market
crash of 1987 was expected. One might think that these probabilities or market
expectations are inherently better than probabilities or expectations that people write
down on survey forms. People who will go so far as to take a position in an options
market are likely to think more carefully about the probability of a crash; their
judgment is considered rather than hasty. Moreover, the sample size, the number of
people whose expectations have an impact on the implied volatility, is enormously
greater with the implied volatilities than with the survey data. When dealing with an
entire options market, then, the results may in fact be considered not a sample at all,
but the universe for that market.
In fact, however, these arguments that the implied volatilities or other marketderived expectations data are the final word on actual public expectations disregard
the fundamental sociological fact that the expectations that are relevant for market
behavior diffuse across different subpopulations of the investing public at different
rates, and that attention of certain subpopulations shifts from one market to others.
Surely, the prices in the options markets reflect the considered opinions of all people
who are currently trading in these markets, but these people are hardly, by any
stretch of the imagination, a random sample of all people who might sell stocks at
the time of crash. Suppose we are interested in a theory of a crash wherein a small
price drop acts as a trigger for a stock market crash, so that people, fearing a crash,
thereby produce the very crash they feared. With such a theory, we would generally
expect that most of these people may never have given careful consideration to the
probability of a crash, are not closely involved with options markets and many may
even have inconsistent or wrong theories of these markets. We will not know what
they are thinking unless we ask, and the opportunity is lost forever if we wait beyond
the length of people’s short-term memories, or until after a major event that changes
their patterns of thinking.
4.2 Qualitative and Scenario Questions
Our qualitative and scenario questions were questions aimed to be more in the mode
of thinking of individual market participants, worded in everyday language. The
hope was to pose questions in such a way that the questions represent categories
of thought already in many respondents’ thinking, not questions that would be
difficult to answer. Katona (1975) argued, based on years of survey research, that
most people do not have expectations for economic variables, and are forced to
344
R.J. Shiller et al.
construct the expectations when surveyors ask for their expectations. Asking for
their expectations may be a useful exercise, but it may sometimes fail to reveal
people’s concerns and understandings. We want now to know how our respondents
interpret market phenomena, not to try to construct forecasts for us. We are applying
here to economics the basic concepts of interpretative social science (Rabinow
and Sullivan 1979), that stresses the importance in explaining human behavior of
people’s own interpretations of events.7
We asked, in questions II-1 and II-2, whether the market is overpriced, that is,
high relative to fundamental value.
II-1. “Stock prices in Japan, when compared with measures of true fundamental value or
sensible investment value are: 1. Too low. 2. Too high. 3. About right. 4. Do not know.”
II-2. “Stock prices in the United States, when compared with measures of true fundamental
value or sensible investment value, are: 1. Too low. 2. Too high. 3. About right. 4. Do not
know.”
These questions were included because we learned that the concept of an
overpriced market was very much on people’s minds at the time of the stock market
crash of October 1987. At the time of this crash, when investors in the United States
and Japan were asked in a questionnaire survey to explain the cause of the crash in
their own words, and the responses coded, the most important theme in their answers
was that the market was overpriced (Shiller 1989; Shiller et al. 1991).
Table 12.2 gives the proportion of respondents choosing answer 2 (too high) in
each survey. We see here that the U.S. investors were consistently more likely to
think that the market prices are too high, and were dramatically more likely to think
this about the Japanese market. In 1989-II, 73.5 % of U.S. respondents thought
the Japanese market was overpriced, while only 26.6 % of the Japanese did. Most
Japanese became temporarily of the opinion that their market was too high right
after the Japanese market had its spectacular 4.5 % drop on February 26, 1990:
the 1990-I survey of Japanese investors (before most of the dramatic downturn in
the Nikkei had occurred) shows that 61.1 % of them felt that the Japanese market
was overpriced. But in 1990-II, a comparison of the United States and Japanese
responses after most of the enormous decline in the Tokyo stock market and after
the Iraqi oil crisis shows a return to nearly the same pattern as in 1989-II, with
Americans strongly tending to think that the Japanese market is overpriced and the
Japanese respondents again dramatically less likely to think so.
A common element in the popular notion of a speculative bubble is that during
the expansion phase, or bull market, increasing numbers of investors are buying
stocks because they think that prices will go up for a while longer, and hope to exit
before the bubble bursts. Conversely, a bear market may be caused by increasing
7
This is the first step that Sternberg (1987), in his proposed methodology for implicit theories
research, called “behavioral listings.” He, of course, expects his method to be applied to subjects
in a psychology laboratory, not to the world financial markets; it is easier for psychologists to
obtain large enough quantities of data to make a rapid transition to his second step of “prototypical
analysis,” where the popular theories and models are fleshed out.
Stock
Stock prices
price
too high
Date
index
Japan (%)
A. Answers from Japanese respondents
1989-II
33631
26.6
1989 end
35894
32.1
1990-I
32616
61.1
1990-lI
26490
21.3
1991-I
24935
16.8
1991-II
23332
13.9
1992-I
18436
22.5
1992-II
18066
11.7
1993-I
19048
33.3
1993-II
20322
38.5
1994-I
20091
30.4
2
Test time constancy:
(10) D 118.2
pD
1.16 10 20
II-1 (2)
39.1
–
–
7.3
9.8
14.0
7.0
11.2
15.5
17.6
19.3
2
(8) D 73.5
9.96 10 13
Stock prices
too high
U.S. (%)
0.0
9.4
0.8
11.1
10.4
19.2
36.6
32.4
31.0
33.9
33.5
2
(10) D 167.8
7.75 10 13
II-3 (1)
Advise
stocks now
despite
expected
drop (%)
II-2 (2)
Table 12.2 Qualitative and scenario questions
23.7
–
–
55.3
35.8
23.1
62.0
39.4
23.6
18.4
20.3
2
(8) D 112.8
1.01 10 20
II-4 (1)
Advise
against
stocks
despite
expected
rise (%)
37.2
–
–
41.3
34.4
23.7
28.7
25.0
41.9
30.0
27.7
2
(8) D 21.7
5.41 10 3
See
excitement
about
stocks (%)
II-5 (1)
14.9
–
–
38.2
26.4
25.4
22.5
33.3
24.3
16.9
14.6
2
(8) D 40.13
3.02 10 6
Trend last 6
months was
speculative
(%)
II-6 (2)
42.8
–
–
29.1
28.1
39.7
20.8
22.5
39.1
37.2
33.8
2
(8) D 26.19
9.75 10 4
II-7 (1)
If prices
dropped
3 % would
expect rise
next day
(%)
(continued)
14.6
13.7
–
31.7
18.6
19.7
28.1
27.9
20.1
17.4
15.8
F(9,1322) D 8.35
3.38 10 12
Probability of
crash next 6
months (%)
II-8
12 Why Did the Nikkei Crash? Expanding the Scope of Expectations Data Collection
345
II-1 (2)
II-2 (2)
Stock
Stock prices
Stock prices
price
too high
too high
Date
index
Japan (%)
U.S. (%)
B. Answers from United States respondents
1989-II
2554
73.5
18.7
1990-I
2553
81.0
37.9
1990-II
2716
82.6
39.2
1991-I
2902
67.2
35.4
1991-II
3043
71.0
47.1
3245
65.9
46.6
1992-I
1992-II
3257
54.8
44.4
1993-I
3343
55.7
42.1
1993-II
3579
55.2
42.5
1994-I
3831
55.9
42.4
1994-I
20091
30.4
33.5
2
2
Test time constancy:
(9) D 61.59
(9) D 38.33
10
pD
6.61 10
1.52 10 5
Table 12.2 (continued)
II-4 (1)
Advise
against
stocks
despite
expected
rise (%)
24.6
86.3
53.7
34.7
38.4
32.3
44.9
32.8
22.0
42.7
20.3
2
(9) D 170.14
5.76 10 7
Advise
stocks now
despite
expected
drop (%)
34.4
16.0
11.1
26.4
17.6
19.2
12.3
27.5
30.7
19.2
19.3
2
(9) D 45.35
7.95 10 7
II-3 (1)
55.5
41.1
43.5
54.8
44.1
48.3
45.9
54.1
45.2
50.8
27.7
2
(9) D 13.37
0.15
See
excitement
about
stocks (%)
II-5 (1)
19.1
41.2
36.9
36.9
21.1
14.8
18.1
18.8
13.2
21.0
14.6
2
(9) D 72.06
6.00 10 12
Trend last 6
months was
speculative
(%)
II-6 (2)
33.3
34.8
18.6
22.9
36.2
37.9
31.4
29.5
37.0
33.6
33.8
2
(9) D 23.14
5.90 10 3
II-7 (1)
If prices
dropped
3 % would
expect rise
next day
(%)
14.9
22.0
23.7
17.3
14.4
19.6
19.7
20.3
20.8
16.2
15.8
F(9,1393) D 3.38
4.14 10 4
Probability of
crash next 6
months (%)
II-8
346
R.J. Shiller et al.
12 Why Did the Nikkei Crash? Expanding the Scope of Expectations Data Collection
347
numbers of investors who think that the market will continue to go down for a while,
and who are waiting for the recovery to enter the market. It is not obvious how
to prove whether our respondents are thinking this way. The questions discussed
in the preceding section about expectations at various horizons might reveal such
thinking if the horizons asked about match-up with the dates at which the market is
expected to turn, but we will probably not be so lucky as to choose the right horizons
to ask about. We cannot ask for expectations at all horizons without exhausting
respondents. Moreover, when asked to forecast the stock price index at a number of
horizons, respondents may not even register their opinions about market dynamics:
it may be too hard for them to translate their opinions into numbers. People may give
us conventional or safe forecasts, even if they are themselves invested in thinking
about market turns. People may have complicated vague impressions about the
outlook for the market, even impressions that put them into two minds about the
market, so that they may give different-sounding answers to similar questions that
are posed differently.
A more interpretive method for deriving evidence on this speculative behavior
can be had by asking whether respondents would advise staying in the market for
the time being, even though they expect the market to drop, and conversely. Without
specifying the horizon of the associated forecasts, we allow the respondent to reveal
directly whether he or she is thinking in terms of short-term speculative advantage.
Respondents were asked about their own countries, questions II-3 and II-4:
II-3 “Although I expect a substantial drop in stock prices in [the US, Japan] ultimately, I
advise being relatively heavily invested in stocks for the time being because I think that
prices are likely to rise for a while. 1. True 2. False 3. No Opinion”
II-4 “Although I expect a substantial rise in stock prices in [the US, Japan] ultimately, I
advise being less invested in stocks for the time being because I think that prices are likely
to drop for a while. 1. True 2. False 3. No Opinion”
These questions, in contrast to the expectations questions displayed above, are
directly connected with investing strategy, and the stress on investing strategy in
these questions may call forth a different type of expectation. These questions have
been criticized as too long and too complicated; when a respondent answers “False”
to II-3 we do not know whether a decline is not expected or whether a decline is
expected but stocks are not thought likely to rise for a while. People who criticize our
questions along these lines seem to be assuming that the question is designed to elicit
well-defined expectations, while in fact the question is designed to discover whether
respondents are familiar with a sort of popular theory. We worked a great deal on
the wording of this question, but could not find a better way to ask respondents
about their bubble-enforcing attitudes. (We did ask them too about the date of the
presumed peak or trough in the market, to allow them more precision in answering.)
The proportions choosing answer 1 are shown in Table 12.2. It is striking that
quite often most of both the U.S. and Japanese respondents answered “true” to
one of questions II-3 or II-4. Thus, in a sense, most of our investors appear to be
either relatively in the market hoping to get out before it drops or relatively out
of the market hoping to get in before it rises, suggesting that the market is indeed
348
R.J. Shiller et al.
a very “bubbly” place. The answers also reveal that strategies differed very much
among investors; suggesting the importance of thinking about heterogeneity among
investors. Of course, the tendency to answer “true” may be exaggerated by selection
bias: those who have striking views about the outlook for the market may be more
likely to fill out our questionnaire.
In the answers to these questions, we do see a change in the behavior of Japanese
investors before and after the debacle in Japanese stock prices. Between 1989-II
and 1990-II, when most of the Nikkei crash occurred, we see dramatic changes in
the Japanese answers to these equations; there was substantially less evidence of a
positive bubble mentality, as indicated by fewer “True” answers to II-3 later. This
evidence is consistent with the notion that the Japanese stock market debacle might
have been caused by changed short-run expectations for prices.
Question II-5 was directed at learning directly about a concomitant of the kinds
of speculative booms that were widely reported about the booms preceding the 1929
crash and other booms: just that people seemed to be very excited about stock market
investing:
II-5 “Many people are showing a great deal of excitement and optimism about the prospects
for the stock market in the [United States, Japan] and I must be careful not to be influenced
by them. 1. True. 2. False. 3. No opinion.”
That people were getting excited about investing is so much a part of the story
people tell of these booms; if people are getting excited, one might think they would
know it and could report it to us. The proportions of respondents who answered
“True” about their own country are shown in Table 12.2. Time variation shows
no clear relation in Japan to the Nikkei crash; moreover, our rejections of the null
hypotheses that the proportions are constant through time are least significant for
this question, when compared with all other questions we report here (see the 2
statistics in Table 12.2). Of course, the lack of relation of this answer to the Nikkei
crash and lack of statistical significance may be because of the words “I must be
careful not to be influenced by them.” Some respondents may have answered “false”
even when they agree with the former part of the question because they do not agree
with the later part.
Question II-6 asked respondents whether the trend in stock prices over the past 6
months was due to fundamentals or to investor psychology:
II-6 “What do you think is the cause of the trend of stock prices in [the United States,
Japan] in the past six months? 1. It properly reflects the fundamentals of the U.S. economy
and firms. 2. It is based on speculative thinking among investors or overreaction to current
news. 3. Other 4. No opinion.”
Respondents were asked about their own countries only. The proportions choosing response 2 in each country are given in Table 12.2. In Japan, the proportion
selecting answer 2 was relatively high from 1990-II to 1993-I. This period corresponds approximately to the high proportion of the answers “too low” in question
II-1 above in Japan. Thus, it is suggested that they think that the Nikkei became
too low because of speculative thinking among the investing public in this period.
In Japan, the percentage who chose, for II-6, answer 1 (fundamentals) was higher
12 Why Did the Nikkei Crash? Expanding the Scope of Expectations Data Collection
349
than the percentage who chose answer 2 (speculative thinking) at all times except
for 1990-II, the time of the most rapid decline in the Nikkei shown in the tables.
We should note that, based on our experience, investors seem to put much more
importance on psychology when asked to explain big moves in short periods of
time. Just after the biggest one-day stock market crash in history, October 19, 1987,
64 % of U.S. institutional investors (and 68 % of U.S. individual investors) (Shiller
1989) and 73 % of Japanese institutional investors (Shiller et al. 1991) thought that
the crash was due to investor psychology. Just after the 6.9 % one-day drop in
the Dow Jones Industrial Average on October 13, 1989, 77 % of U.S. investment
professionals 8 and 83 % of Japanese institutional investors chose psychology as an
explanation for the drop.
Question II-7 was phrased to get at a possibly time-varying parameter in a
feedback mechanism that feeds past price movements into current changes in
demand and hence into price movements, by asking how a past price change affects
people’s expectations for the future:
II-7 “If the [Dow, Nikkei] dropped 3 % tomorrow, I would guess that the day after tomorrow
the Dow would: 1. Increase. 2. Decrease. 3. Stay the same. 4. No opinion.”
Table 12.2 shows the proportion in each country who chose “Increase;” respondents were asked about their own country only. We note the striking fact that the
proportion expecting an increase was highest in Japan in 1989-II, right before the
peak in the market.
Stock market crashes are often thought to be caused by a feedback mechanism,
as initial price decreases engender pessimistic expectations and hence more price
decreases, but if we hold such a theory we must explain why the feedback is
not causing crashes every day. We would have an explanation if we understood
how response patterns change through time. Changes in response patterns to price
changes may be documented by changes in answers to this question. Our statistics
show less significance in this sample than was the case with most of the other
questions, but time variation in the proportion expecting to increase after an initial
decrease was significant at conventional levels. This suggests that it may be useful
to continue collecting such data. Of course, much more research is needed to know
how to interpret such feedback mechanisms. Further survey work should inquire
about other technical theories and trading rules (such as those concerning resistance
levels, moving averages, etc.) to see how feedback might change through time.
Question II-8 asks respondents for their subjective probability of a stock market
crash:
II-8 “What do you think is the probability of a catastrophic stock market crash, like that
of October 28, 1929 or October 19, 1987, in the next six months? (An answer of 0 %
means that it cannot happen, an answer of 100 % means it is sure to happen.) Probability:
______%”
8
See Robert Shiller and William Feltus, “Fear of a Crash Caused the Crash,” New York Times,
October 29, 1989.
350
R.J. Shiller et al.
Such subjective probabilities have obvious relevance to any theories that stock
market crashes are caused by fears of crashes. Fear of a crash was at its highest (see
Table 12.2) in Japan in our survey immediately after the most precipitous drop in the
Nikkei, 1990-II. This fact seems to be consistent with the notion that the Japanese
investors think the Nikkei became too low by speculative thinking in these periods,
as argued above.
Time variation in the answers to all questions except II-5 is highly significant in
both countries. There is even highly significant time variation in both countries in
answers to question II-8 about the risk of a sudden crash in this sample period when
there was no important one-day stock market crash.
5 Why Did the Nikkei Crash?
Our objective here was partly to illustrate a methodology that might allow us to
understand events like the Nikkei crash, and to demonstrate the variability through
time of the expectations and other parameters we assessed. Our surveys cannot be
expected to provide a complete understanding of the causes of the crash in the
Nikkei. A complete understanding cannot be obtained without first explaining such
mysteries as the cause of the run-up of the Nikkei before 1989, or the Japanese
tendency for very high (by world standards) price-earnings ratios; our surveys were
not designed to elucidate such matters. Nor do our surveys enable us to evaluate
the ultimate reasons why expectations and attitudes changed through time, or the
role in these changes of all of the factors the media have stressed in connection
with the crash, such things as expectations of the recession that depressed Japanese
corporate earnings after the crash in the Nikkei, the increasing value of the yen, and
policy actions of the Bank of Japan and the Ministry of Finance.
But our results do give us information about the kinds of changes in expectations that were associated with the crash in the Nikkei. We found that Japanese
expectations for long-run earnings growth (question I-3, Table 12.1) in Japan
became gradually less optimistic over the period 1989–1994. The earnings growth
expectations did not surge up in response to the decline in actual Japanese earnings
after 1990, which suggests that our respondents did not view the decline in earnings
as temporary. We did not directly ask whether respondents viewed the decline in
earnings as temporary, and so it is hard to say what they were thinking on this
matter when answering a question about long-run earnings growth; they may not
have given long-run earnings growth from the low current base of earnings.9 Still,
9
In our 1994-II Japanese survey, conducted after this chapter was written, we asked for 3-year
expectations in addition to the 10-year expectations in question I-3. The average annual expected
real earnings growth was 7.57 % over the next three years, versus 3.88 % over the next ten years.
This suggests that part of the earnings decline was thought of as temporary, to be reversed in a
relatively short period.
12 Why Did the Nikkei Crash? Expanding the Scope of Expectations Data Collection
351
our results may be regarded as consistent with the notion that the overall drop in the
Nikkei, the drop between the peak of the market at the end of 1989 and today, might
well be viewed as nothing more than a response to the decline in earnings that was
viewed as essentially permanent. The simplest story of the Nikkei crash is that it is
just another example of a market’s overreaction to earnings: it has been documented
before for the United States that much of the volatility of stock prices has this form,
as if people often fail to see that earnings movements may be transient, and do not
expect them to be in any sense mean reverting (see Shiller 1989; Barsky and De
Long 1993).
Still, the rough story of prices overreacting to earnings does not explain
everything. The earnings expectations data do not help us to explain the relatively
sudden initial crash of the Nikkei itself, the crash that occurred between the peak
of the market in 1989 and the end of 1990. What changed rather suddenly and
strikingly at the time of the crash were speculative attitudes, attitudes towards price
movements, not earnings growth or expectations of earnings growth.
The initial crash in the Nikkei between 1989-II and 1990-II was accompanied by
substantial changes in speculative factors as documented in our questions. Questions
II-3 and II-4 (Table 12.2) show marked changes between 1989-II and 1990-II in
opinions about whether it is advisable to buy for the short run. In 1989-II we saw
the greatest proportion ever, 39.1 %, of Japanese who thought that this was a time
when it was advisable to buy only for the short run; 1 year later this proportion
had dropped to 7.3 %. Over the same interval, the proportion who advised against
stocks in the short run despite an expected rise went up from 23.7 % to 55.3 %.
These changes in response to questions about short run speculation are important
evidence for a speculative element in the Nikkei crash.
Just before the crash of the Nikkei, in 1989-II, we see in answers to II-7 the
highest proportion ever, 42.8 %, of Japanese who thought that if prices dropped 3 %
in one day then the market would rise the next day. This impression of stability
for the market may have encouraged the high prices that the Nikkei reached just
before the crash. By early 1992, this proportion had fallen in half, to 20.8 %. The
relative lack of confidence in the resiliency of the market would seem to encourage
downward feedback loops, where price declines encourage further price declines,
and such loops may well have been part of the decline in the market.10
There was a sudden, sharp, upspike in 1990-I, just before the biggest onesemester decline in the Nikkei in our sample, in the proportion of Japanese
respondents who thought that the market was too high (question II-1, Table 12.2). In
1990-II, the date of the questionnaire immediately after the biggest 6-month decline
in the Nikkei, the highest proportion ever reported that they thought the trend in the
last six months was speculative (question II-6, Table 12.2).
These results paint a picture of a speculation-induced initial crash, from 1989
to 1990, in Japan. Still, the picture is not entirely clear. We do not know to what
10
For a discussion of the theory of feedback loops in price changes, and the implication of such
theory for the serial correlation properties of price changes, see Shiller (1990).
352
R.J. Shiller et al.
extent it was information of some sort about future earnings that stimulated the
initial crash; the information may have prompted changes in expectations for the
behavior of the market even though there were little changes in expected earnings
growth. We also cannot yet understand why answers to certain of our questions
showed little relation to the crash.
One fact that tempers our willingness to interpret the Japanese results in relation
to the Nikkei crash is that when one looks at U.S. data for the same time period,
there are sometimes important changes in answers to questions, even though the
U.S. market did not crash. For example, responses to questions II-3 and II-4 showed
just as dramatic movements in the U.S. as they did in Japan between 1989-II and
1990-II, even though the United States market experience was relatively uneventful.
This result should help clarify why it is important to collect parallel time series in
different countries.
On the other hand, it is in the comparisons with the United States that we see the
most striking evidence that something crudely speculative was at work in driving
the Nikkei. It is hard to imagine how we can reconcile the fact that those in Japan
usually thought that the Nikkei would rise in the next year about 20 % more than
those in the United States thought it would with any rational expectations model
of the stock market. Somebody was exhibiting bad judgment if opinions differed so
strikingly depending on where one sits.
Acknowledgments This research was supported by the Economics of Information and Risk
Research Fund of Osaka University, the Japan Securities Research Institute, the Russell Sage
Foundation and the U.S. National Science Foundation. This chapter is a revision of National
Bureau of Economic Research Working Paper No. 3613. The authors wish to thank the respondents
in the surveys for their participation, and Daniel Kahneman and Richard Thaler for their
suggestions. Opinions expressed are those of the authors and not necessarily those of the supporting
institutions.
Addendum: Was the Rise in American Stock Prices
in 1990s a Bubble?11
In the text, we analyzed the crash and subsequent slump of the Nikkei in the early
1990s, utilizing the results of our survey until 1994. In this appendix, using longer
results of the same survey we analyze whether the rapid rise in American stock
prices in the late 1990s is a bubble.
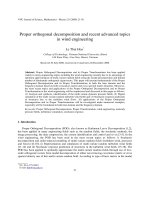
In Fig. 12.3, we plot the quarterly data of the Dow Jones Industrial Average
(DJIA) and Standard and Poor’s 500 Index (SP500), normalizing their values as
of the 1995Q1 to be 100. The indices rose gradually from 1990 to 1995, rose
rapidly until 2000, and then declined until early 2002. The magnitude of the decline
eventually reached about 30 % in the DJIA and about 45 % in the SP500, meaning
11
This addendum has been newly written for this book chapter.
12 Why Did the Nikkei Crash? Expanding the Scope of Expectations Data Collection
353
Fig. 12.3 Stock price indexes and fundamentals
that in 2 years they lost about half of the rapid gains they had made in the 5 years
since 1995.
A bubble is often defined as the gap between an asset’s price and its fundamental
value. Thus, once we know the fundamental value, the size of the bubble is known.
In Fig. 12.3, we also plot the GDP of the USA along with corporate profits. These
generally kept pace with stock indices until 1995; a gap a gap then opened up
between the two and grew until 2000, suggesting that the rapid rise in stock prices
after 1995 may have been a bubble. Fundamental value, however, is the present
value of the future earnings of a stock, not the current earnings. If investors have
optimistic expectations for future earnings, the fundamental value is high even if
the current earnings are low. Thus, we need information on investors’ expectations
of future earnings; our survey asks about these.
Our survey asks:
What do you think the rate of growth of real (inflation adjusted) corporate earnings will be
on average over the next 10 years?
We plot the result in Fig. 12.4. The average response from 1989 to 1994 was
5.35 %, and from 1995 to 1999 was 5.58 %, implying that expectations did not
change much between the two periods. This suggests that the fundamental value
did not change dramatically, so that the stock prices in the late 1990s contained a
bubble.
Now, let us try to estimate the size of the bubble using some assumptions. Let’s
assume that the time discount rate r is constant, that stockholders are aware of all
corporate earnings, and that stockholders expect that earnings will grow at a constant
rate g. In this case, the fundamental value P is
354
R.J. Shiller et al.
Fig. 12.4 Expectations of corporate earnings and inflation rate
Ä
Pt DEt
Ä
DEt
t
.1 C g/
t .1 C g/
C
C
1Cr
.1 C r/2
1Cg
r g
(12.1)
t
Here, t represents corporate earnings (profits) known as of period t.
Denoting the expected inflation rate at t as ft , the expected real growth rate of
corporate earnings as gˆ t , and the constant real discount rate as r,
O (12.1) can be
rewritten as
Pt D
1 C gO t C ft
rO gO t
t
(12.2)
To calculate the fundamental value based on (12.2), we need data on the expected
inflation rate, which is asked in our survey:
What do you think the inflation rate (rate of increase in the cost of living) in the US will be
on average over the next 10 years?
12 Why Did the Nikkei Crash? Expanding the Scope of Expectations Data Collection
355
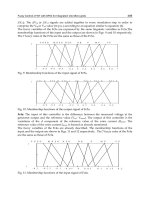
Fig. 12.5 DJIA and estimate fundamental value
The result is also plotted in Fig. 12.4, which shows a decline throughout the
period, from 4.5 % in 1989 to 3 % in the late 1990s.
Substituting in the survey results for gˆ t and ft and the actual value of corporate
profits at t-1 into (12.2), and using the assumption that r D 9 %, we calculate the
fundamental value P. We then adjust the value so the number at 1989-II equals the
value of the DJIA at that time, which allows us to compare the estimated value from
(12.2) with the historical DJIA. Specifically, we multiply the estimated fundamental
value by DJIA and divide by the estimated value at 1989-II, which implies that the
DJIA equaled the fundamental value in 1989-II.
The result is shown in Fig. 12.5. The figure reveals that DJIA was overpriced
throughout the period. However, until 1995-II, the overpricing was temporary and
was tended to disappear quickly. It was in 1996-I that the gap started to widen; the
bubble reached $4000 in 1999-I, whereas the fundamental value itself was $6000.
The successive rapid decline until 2002 precisely eliminated this bubble.
The estimated result depends on the assumption about the real discount rate.
Lower assumed values result in smaller bubbles. If we assume a rate of 7.5 % or
8.0 %, the fundamental value exceeds the actual value of the DJIA at 1995-I and
1998-I and II, implying that the DJIA was underpriced in these periods. Still, the
conclusion that a bubble existed in most of the periods, and that its size at 1999-I
reached $4000, is maintained under this different assumption.
We should be careful to note that the above estimation depends on various
restrictive assumptions, so that the estimation is merely an exercise. In addition to
356
R.J. Shiller et al.
the fact that (12.2) is based on restrictive assumptions, we did not estimate the value
of the discount rate, but simply assumed its value. However, there is a possibility
that we have underestimated the size of bubble. In the late 1990s, many argued that
the US economy went into a new super-productive phase. This argument may have
made people believe that future corporate earnings are high. If such a belief was
wrong, and their expectation of future earnings was unreasonably high, we should
say that ‘fundamental value’ itself, based on such an irrational belief, contained a
bubble.
References
Barsky RB, Bradford De Long J (1993) Why does the stock market fluctuate? Q J Econ 108:
291–311
Bates DS (1991) The crash of 87: was it expected? The evidence from the options markets. J Financ
46(3):1009–1044
De Bondt WFM (1991) What do economists know about the stock market? J Portf Manag 84:84–91
Feldstein M, Horioka C (1980) Domestic saving and international capital flows. Econ J 90:314–329
French KR, Poterba JM (1990) Japanese and U.S. cross-border common stock investments.
J Jpn Int Econ 4:476–493
French KR, Poterba JM (1991) Were Japanese stock prices too high? J Financ Econ 29:337–363
Katona G (1975) Psychological economics. Elsevier, North Holland, Amsterdam
Rabinow P, Sullivan WM (1979) Interpretive social science: a reader. University of California
Press, London
Shiller RJ (1989) Market volatility. M.I.T. Press, Cambridge
Shiller RJ (1990) Market volatility and investor behavior. Am Econ Rev 80:58–62
Shiller RJ (1995) Conversation, information, and herd behavior. Am Econ Rev, 85:181–185
Shiller RJ, Kon-Ya F, Tsutsui Y (1991) Investor behavior in the October 1987 stock market crash:
the case of Japan. J Jpn Int Econ 5:1–13
Shiller RJ, Kon-Ya F, Tsutsui Y (1996) Why did the Nikkei crash? Expanding the scope of
expectations data collection. Rev Econ Stat 78(1):156–164
Sternberg RJ (1987) Implicit theories: an alternative to modeling cognition and its development.
In: Bisanz J, Brainerd CJ, Kail R (eds) Formal methods in developmental psychology: progress
in cognitive development research. Springer, New York, pp 155–192
Ueda K (1992) Monetary policy under disequilibrium in the balance of international payments.
Toyo Keizai Shinpo Sha, Tokyo (in Japanese)
Chapter 13
Price Bubbles Sans Dividend Anchors: Evidence
from Laboratory Stock Markets
Shinichi Hirota and Shyam Sunder
Abstract We experimentally explore how investor decision horizons influence the
formation of stock prices. We find that in long-horizon sessions, where investors
collect dividends till maturity, prices converge to the fundamental levels derived
from dividends through backward induction. In short-horizon sessions, where
investors exit the market by receiving the price (not dividends), prices levels and
paths become indeterminate and lose dividend anchors; investors tend to form
their expectations of future prices by forward, not backward, induction. These
laboratory results suggest that investors’ short horizons and the consequent difficulty
of backward induction are important contributors to the emergence of price bubbles.
Keywords Stock price bubbles • Short-term investors • Backward induction •
Market experiments
JEL Classification Codes G12, C91
1 Introduction
This chapter uses a laboratory experiment to explore how investors’ decision
horizons affect the formation of stock prices. It has long been argued that speculation
by short-term investors induces price volatility. Speculators are concerned primarily
with capital gains; the dividends paid during their short investment horizon are
The original article first appeared in Journal of Economic Dynamics and Control 31:1875–1909,
2007. A newly written addendum has been added to this book chapter.
S. Hirota ( )
School of Commerce, Waseda University, 1-6-1 Nishiwaseda, Shinjuku,
Tokyo 169-8050, Japan
e-mail:
S. Sunder
Yale School of Management, 165 Whitney Avenue, New Haven, CT 06511, USA
e-mail:
© Springer Japan 2016
S. Ikeda et al. (eds.), Behavioral Interactions, Markets, and Economic Dynamics,
DOI 10.1007/978-4-431-55501-8_13
357
358
S. Hirota and S. Sunder
relatively insignificant. Expectations of capital gains depend on higher order
expectations susceptible to cascading or mass psychology of the market. In markets
populated by short-term investors, the argument goes, prices tend to lose their
dividend anchors, can take any value depending on such expectations, and are
therefore susceptible to price indeterminacy and bubbles.1
This conventional wisdom is not necessarily accepted in today’s finance textbooks. We teach that the prices of securities are determined by their fundamental
values—the sum of the discounted value of future dividends—irrespective of
investors’ time horizons. Even short-term investors are assumed to backward induct
from future cash flows to arrive at the fundamental value of securities at the present
time.
On the other hand, some theoretical research suggests that such backward induction may fail, and short-term speculative trading may give rise to bubbles. Rational
bubble models (Blanchard and Watson 1982; Tirole 1985) consider indeterminacy
of price levels of infinite maturity securities without terminal values. Short-term
investors have no values from which they can backward induct. In addition, recent
theoretical models argue that when investors have heterogeneous information and/or
their rationality is not common knowledge, short-term investors may find it difficult
to backward induct and security prices may diverge from their fundamentals (e.g.,
De Long et al. 1990a, b; Froot et al. 1992; Dow and Gorton 1994; Allen et al. 2006).
Unlike psychological theories of mass hysteria or limited cognition, these models
show that indeterminacy of security prices can arise because even rational investors
may not have the knowledge, beliefs, and coordination devices necessary for prices
to coincide with the fundamental values.
From these models, we conjecture that the difficulty of backward induction
originating in investor short-horizons is a primary source of price bubbles. However,
little empirical evidence exists to support this theoretical body of work. Since
fundamental values of equities are rarely known, empirical studies of price bubbles
using data from the field face the difficult challenge of separating bubbles from the
possibility that the fundamental model is misspecified.2
Laboratory experiments can address this problem by letting the experimenter
assign parameters to subjects to control the fundamental value. Smith et al. (1988)
showed that bubbles can arise in simple laboratory asset markets and conjectured
that investors may conduct speculative trades aiming to sell the security to others
at higher prices. Lei et al. (2001) experiment, however, rejected this conjecture. It
showed that bubbles arise even when investors cannot engage in speculative trades;
bubbles arise from errors in investors’ decisions themselves. In contrast to these
works, the objective of our experiment is to explore how investors’ decision horizons
1
In UK, “short-termism” is a charge leveled at the expectations of financial institutions from the
companies to which they provide capital. See Moore (1998) and Tonello (2006).
2
See, Stiglitz (1990), and Fama (1991). LeRoy (2003) also states in a recent survey article that
“One would like to see the development of empirical tests that could distinguish between bubbles
and misspecification”(p. 25).