DISTRIBUTION AND PACKAGING OF STUDENT FINANCI AIDI,: SOMEr EVIDEN~C FROM THE SURVEY 0F THE HIGH SCHOOL CLASS.OF 1972 potx
Bạn đang xem bản rút gọn của tài liệu. Xem và tải ngay bản đầy đủ của tài liệu tại đây (951.97 KB, 11 trang )
National
Longitudinal
Study
DISTRIBUTION
AND
PACKAGING
OF
STUDENT
FINANCI
AIDI,:
SOMEr
EVIDEN~C
FROM
THE
SURVEY
0F
THE
HIGH
SCHOOL
CLASS.OF
1972
NCES
77.252
U.S.
DEPARTMENT
OF
HEALTH,
EDUCATION.
AND
WELFARE
Joseph
A.
Califs
0, jr.,
Secretary
Education
Diiso
Mar
F.
BeM
,Assistant
Secretary
for
Education
National
Center
for
Education
Statistics
Marie
D.
Eldridge,
Administrator
NATIONAL CENTER
FOR
EDUCATION STATISTICS'
'The
purpose
of
the Center
shall
be
to
collect
and
disseminate
statistics
Ian
other
data
related
to
education
in
the
United
States add
in
other
nations.Th
Center
shall
. .
collect, collate,
and,
from
time
to
time,
report
full
and:
coam
plete
statistics
on
the
conditions
of
education
in
the
United
States;
conduct,
and~~
publish
reports on
specialized
analses
of
the
meaning
and
significance
of
such,
statistics;
.
and
review
and
report
on
education
activities
in
foreign,
cutris
-Section
406(b)
of
the
General
Education
Provisions
Act,
as
amiended
2
USC
122le-1),
U.S.
DEPARTMENT OF HEALTH
EDUCATION
AND
WELEARE
WASHINGTON:
1977
I . .,
.1
II
._
__
WI
__-___111_
-l-l1-11-,-",-,,. , ,-
.
-__.
- .
-11.
I ,
7- 7-` "-
'
I
1
117
17=
DISTRIBUTION
AND
PACKAGING
OF
STUDENT
FINANCIAL
AID:
SOME
EVIDENCE
FROM
THE
SURVEY
OF
THE
HIGH
SCHOOL CLASS
OF
1972
Alan
P.
Wagner,
College
Entrance
Examination
Board
and
Kenneth
A.
Tablet,
National
Center
for
Education
Statistics
This
report
examines
(1)
the
major
sources
of
Federal
postsecondary
financial
assistance
programs.
Federal
financial
aid
to students
in
their
first
year
of
(The
results
are
based
on
duplicate
counts,
since
postsecondary
education
in
the
academic
year
1972-
awards
are
often
given
as
a
package
by
the
school's
73, (2)
the
distribution
of
Federal
aid
by
various
stu-
financial-aid
office.)
Lower
socioeconomic
status
dent
and
institutional
characteristics,
and
(3)
the
dis-
(SES)
students
are
receiving
a
larger
percentage
of
tribution of
non-Federal
aid
that
students
may
get
Federal
aid
and
it
is
concentrated
in
the
college
work-
either
in
addition to
or
instead
of
Federal
aid. Data
study
and
loan programs
rather than
grants.
Similarly,
for
this
report
come
from
a
sample
of
10,189
respon-
although
Baks
represent
8.7
percent
of
the
popula-
dents
who
participated
in
the
first
followup
survey
of
tion
of
full-time freshmen,
they
are
receiving
13.0
the
Nationai
Longitudinal
Study
of
the
High
Scho
percent
of
the
Federal-aid
awards
and the
total
Class
of
1972
(NLS)
and
were
enrolled
full
time
average
amount
of
such
aid
exceeds
that
for
all stu-
during
the
1972-73
academic
year. dents.
On
the
other
hand,
Federal
grants
tend
to
be
awarded according
to student
ability,
since
the
largest
Distribution
of
Student
Aid
proportion
of
Federal
granlts
and
the
largest
average
amounts
are
given
to
those
in
the highest
achievement/
NLS
estimates*
indicate
that
52
percent
of
all
full-
ability
quartile.
time freshmen
received
some
kind
of
financial
aid
Columns
2
and
3
of
table
1
also
show
that
private
other
than
parental
support,
while
32
percent
partici- 4-year
students
and
those
attending
other/proprietary
pated
in
at
least one
Federal financial-aid
program.
schools
are
overrepresented
in
both
receipt~
of
aid
The
distribution
of
student
aid,
by type
and
source,
from
an;
'source
and
from
Federal
aid
as
well
For
is
displayed
in
figure
1.
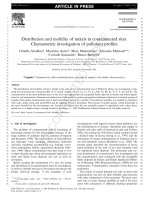
Among
the
four
types
of
stu-
example,
students
in
private
4-year
institutions
re-
dent
aid,
grants
and
scholarships
were
the most
corn- ceive
55.3
percent
of
Federal
aid
over
and
above
that
mion
kind
of
non-parental
support,
as
reported
by
expected
by
their
representation
in
the
population.
nearly
one-third
of
the
students.
On
the
other
hand,
For
2-year
public
institutions
and
vocational
schools,
the
most
prevalent widely
used
type
of
Federal
aid
the
exact
opposite
occurs;
they
receive
a
dispropor-
Wvas
a
student
loan, with
grants**
ranking
second.
tionately
low percentage
of
Federal
student
assis-
The
percentage
distribution
of
student
aid
is
tance,
particularly
grant
and
loan
awards.
This
sug-
shown
'in
table
1,
and
the
average
amount
of
such
aid
gests
that
their
students
may
either
lack
information
is
shown
in
table
2.
Both
tables
report
breakdowns
by about
the
availability
of
Federal
aid
or
that
such
ins~ti-
type
of
student
aid
and
by
SES
quartiles,
three
tutions
do
not
administer
extensive financial
aid
pro-
racial/ethnic
groups,
achievement/ability
quartiles,
grams
such
as
college
work-study.
and
six
institutional
types.
Federal
transfer
benefits
such
as
social
security
These
tables
reveal several
observations
among
the
and
VA
war
orphans
entitlements
are
received
by
characteristics
of
the recipients
of
the
three
types
of
only
5.2
percent
of
full-time
students
who
are
fresh-
*The
information
reported
is
derived
from
answers
to
selec-
men.
Even
though
such
benefits
are
more
prevalent
ted
questions
from
the
base-year
and
fir
st
followup
surv
eys
among
lower
SES
and
public
2-year
college
students,
for
the
National
Lon-g-it-u-dinal
Study
ofthe
High
School
Class_
higher
SES
and
private 4-year
college
students
tend
to
of392
(LS)andhas
eenweihte
to
eflct~atinal
receive
the
largest
average
amount
of
these
benefits.
population
estimates. The
base-year
survey
(spring
1972)
was
a
stratified,
2-stage
national
probability
sample
that
was
This
pattern
can be
explained
by
twQ
characteristics
to
involve
approximately
21,000 high
school
seniors in
1,200
of
the
distribution
formulas
in
the.
programs.
First,
schools. The
first
followup
survey
was
conducted
in
fall
1973.
noeusamasts;scndy:hlvlofsil
**The
impact
of
the
legislative
initiatives contained
in
the
Education
Amendments
of
1972,
including
the
Basic
Educa-
security
benefits
is
based
on.
past
earnings
of
the
tion
Opportunity
Grants program,
cannot
be
assessed.
.deceased
or disabled
insured
'worker
in
the
.family.
1
Financial
Aid
Packaging
The
financial
aid
received
by
a
student
often
comes
from
a
"package"
consisting
of
different
types
and
sources
of
aid.
Such
a
package
may
result
in
funds
from
Federal
and/or
non-Federal
sources, and
from
grants,
jobs,
loans, and
transfer
benefits
in
var-
ious
combinations.
The
composition
of
such
packages
is,
however,
subject
to
both
program
restrictions
and
institutional
policies.
Table
3
presents the
distribution
of
Federal
and
non-Federal
aid
among
different types
of
students.
Aid
recipients
are
cross-classified
by
four
sources
of
funds:
Aid
from
any source,
Federal
and
non-Federal
aid,
Federal
aid
only,
and
non-Federal.
aid
only.
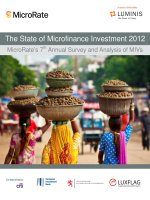
Figures
2
and
3
highlight
several
relationships
from
table 3.
35
Percent
30
Scholar-
of
ships
and
full-time
grants
freshmen
25
,2
O
15
10
5
Figure
2
illustrates
that
almost
one-half
of
the
reci-
pients
of
Federal
aid
also'
received
non-Federal
aid.
Thus, it may
be
that
Federal
program regulations
(including individual dollar
ceilings
and
matching
re-
quirements)
may
encourage
the
use
of
non-Federal
funds
for
certain
types
of
students
aided
under the
Federal
programs.
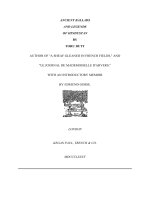
Figure
3
reveals
financial
aid
to be
sensitive
to
student
need
as
measured by
family
SES.
For
exam-
ple,
the
rate
of
aid
awarded
to
low
SES
students
is
approximately
twice
that
for high
SES.
Even
the
pro-
-portions
of
the
Federal
and
non-Federal
sources
used
in
packaging such
aid
reflect
SES
differences.
Among
high
SES
students,
38.8
percent
of
those
who
re-
ceived some
type
of
Federal
aid
received
non-Federal
aid
as
well,
whereas
the
same
comparison for
lower
SES
students
was
55.5
percent.
Aid
from
all
sources
Federal
aid
Figure
1I Share of
full-time freshmen
receiving
student
aid
by
type of
aid
and
source
(based
on
duplicated
counts)
2
.Figure
2 Share
of
full-time
freshmen
by
type
of
student-aid
package
High
SES
Students
Low
SES
Students
Figure
3 Share
of
1972-73
full-time
freshmen
in
selected
groups,
by
type
of
student-aid
package
. 3
Table
1I Percent
distributions
of
1972-73
full-time
freshman
student
financial-aid
recipients,
by
type
of
aid
and
by
student
characteristic
Freshman
students
receiving
aida
Student
characteristicsb
All
full-time
freshman
students
(1)
Receiving
Federal
aid
Total
Total
(2)
_(3)
Work-
Transfer
.Grants
study
Loans
benefits
SES
QUARTILE
Highest
Third
Second
Lowest
RACIAL/ETHNIC
GROUP-
White
Black
H-ispanic
ACHIEVEMENT/ABILITY
QUARTILE
Highest
Third
Second
Lowest
INSTITUTION
TYPE
Public
4
Public
2
Private
4
Private
2
Vocational
Other/Proprietary
100.0
27.0
25.7
23.5
23.8
100.0
88.6
*
8.7
2.7
*
100.0
21.3
31.2
23.2
24.2
.1100.0
43.3
27.7
21i.7
2.3
1.7
3
.3-
100.0
19.7
24.5
26.3
29.5
100.0
86.6
10.2
3.2
100.0
26.9
32.3
21.5
19.2
100.0
42.7
23.1
26.8
2.2
1.2
3.9
100.0
18.0
22.3
26.6
33.1
100.0
.183.3
13.0
3.7
100.0
27.8
33.0
20.4
18.8
100.0
41.6
17.2
33.7
.2.2
0.7
4.5
1
00.0
24.7
23.2
22.9
29.3
100.0
84.6
12.2
3.2
100.0
41.7
31.7
15.7
10.8
100.0
36.2
11.3
48.6
2.2
0.2
1.5
100.0
13.5
16.0
26.7
43.9
100.0
74.3
21.3
4.4
100.0
25.9
36.1
20.6
17.4
100.0
36.6
22.5
34.5
2.5
1.0
2.9
100.0
14.1
22.0
29.4
34.6
100.0
81.7
14.6
3.7
100.0
26.4
34.6
20.6
18.5
100.0
42.4
9.3
38.8
1.9
0.4
7.1
100.0
15.7
24.1
26,4
33.8
100.0
88.7
8.9
2.4
100.0
20.2
28.4
24.4
26.9
100
.Q
41.6
34.8
17.5
2.0
1.7
2.5
SOURCE
OF
DATA:
Base
Year
and
First
Followup
Surveys
of
the
National
Longitudinal
Study
of
the
High
School
Class
of
1972.
aBased
on
duplicated
count.
Student
may
have
received
more
than
one
type
of
FederalI
aid.
bStuident
characteristics
are
defined
at
the
end
of
this report.
Quartile
determinations
were
made
from
all
of
the
data.
NOTE
-Because
of
rounding,
details
may
not
add
t
o 100.0
percent.
4
Table
2 Average
amounts
of
aid
received
by
1972-73
full-time
freshman
student
financial
aid
recipients,
by
type
of
aid
and
by
student
characteristic
Student
characteristicsb
IAU
full-time
freshman
students
(1)
Freshman
students
receiving
Federal
aida
Total
(2)
Grants
(3)
Work-
study
(4)
Transfer
Loans
benefits
(5)
(6)
ALL
STUDENTS
SES
QUARTILE
Highest
Third
Second
Lowest
$1,098
1,065
1,007
1,108
1,181
RACIAL/ETHNIC
GROUP
White
.
1,056
Black
1,422.
Hispanic
1,121
ACHIEVEMENT/ABILITY
QUARTILE
Highest
1,171
Third
1,085
Second
1,072
Lowest
964
INSTITUTION
TYPE
Public
4
960
Public
2
636
Private
4
1,703
Private
2
1,007
Vocational
672
Other/Proprietary
1,664
$1,069
$
769
1,156
1,058
1,070
1,028
1,061
1,192
841
1,083
1,069
1,093
1,007
921
733
1,400
876
654
1,639
869
720
765
.731
728
1,065
701
783
779
774
615
618
400
982
51.7
600
1,655
$
477
$
906
468
447
475
487
468
518
406
453
465
472
502
481
510
441
455
684
671
986
966
908
837
933
803
782
798
888
977
1,031
784
779
938
835
546
1,397
5
$
888
1,201
901
864
758
898
718
510
766
894
991
792
934
666
1,139
967
416
1,298
SOURCE
OF
DATA:
Base
Year
and
First
Followup
Surveys
of the
National Longitudinal
Study
of
the
High
School
Class
of
197
2.
aBased
on
duplicated
count.
Students
may
have
received
more
than
one
type
of
Federal
aid.
bStudent
characteristics
are
defined
at the
end
of this
report.
Quartile
determinations
were
made
from
all
of
the
data.
Table
3 Percent
distributions
of
1972-73
full-time
freshman
students
receiving
financial
aid,
by
source
of
aid
and
by
student
characteristics
Student
character~isticsa_
Aid
from
any
source
(1)
ALL
STUDENTS
SES.
QUARTILE
Highest
Third
Second
Lowest
RACIAL/ETHNIC
GROUP
White
Black
Hispanic
ACHIEVEMENT/ABILITY
QUARTILE
Highest
Third
Second
Lowest
INSTITUTION
TYPE
Public
4
Public
2
Private
4
Private
2
Vocational
Other/Proprietary
52.6
37.2
49.6
58.6
68.2
51.0
68.3
65.7
62.6
52.9
49.2
44.4
51.7
44.7
63.3
53.8
41.1
62.9
Percent
of
total
full-time
freshmen
receiving
Federal
and
non-
Federal
Federal
aid
aid
only
(2)
(3)
14.8
8.1
11.3
16.6
24.9
13.4
25.2
27.2
21.7
16.3
11.5
8.2
14.6
7.9
26.6
14.6
4.4
15.7
17.4
12.8
16.4
19.7
22.0
16.6
28.1
19.5
17.3
16.2
16.8
18.0
16.5
12.6
22.5
18.6
11.9
29.1
6
Non-Federal
aid
only
(4)
20.4
16.3
21.9,
22.3
21.3
21.0
15.0
19.0
23.6
20.4
20.9
18.2
20.6
24.2
14.2
20.6
24.8
18.1
SOURCE
OF
DATA:
Base
Year
and
First
Followup
Surveys
of
the
NationalLongitudinal
Study
of
the
High
School
Class
of
1972.
aStudent
characteristics
are
defined
at
the
end
of
this
report.
Quartile
determinations
were
made
from
all
of
the
data.
Student
Characteristics
Definted:
SES
(Socioeconomic
Status):
An
index
composed
of
five
components:
1)
father's education;
2)
mother's
edu-
cation;
3)
parents'
income;
4)
father's
occupation;
5)
household
items.
RACIAL/ETHNIC
GROUP:
Collapsed
grouping
based on
respondent's
answer
to race/ethnic
question.
The
category
"Hispanic"
includes
those
who
answered
Mexican-American
or
Chicano,
Puerto
Rican,
or
other
Latin
American origin.
"Oriental
or
Asian-American"
andl
"Other"
were
excluded from
the
race/ethnic
distribution.
ACHIEVEMENT/ABILITY:
From
information
collected
in
the
Student's
School
Record
Information
Form
(SRIF).
Where
the high
school
grades
are
not
reported,
the-g-rade average
has
been
imputed
from
class
rank.
INSTITUTION
TYPE:
Collapsed
grouping based
on
the
postsecondary
institution's
own
assignment.
Sampling
Variability
Since
the
statistics
presented
are
based
on
a
sample,
they
may
vary
somewhat
from
the
figures
that
would
have
been
obtained
if
a
complete
survey,
or census,
had
been
taken
using
the
same
forms, procedures,
and
in-
structions.
The
difference
between
a
statistic
estimated
from
a
sample
and
its
corresponding
census value
is
due
to
chance. Sampling
or
chance
variation
is
measured
by the
standard
error.
The
chances
are
2
out
of
3
that
an
estimate from
a
sample will
differ
from
the
census
value
by
less
than
1 standard
error.
The
standard
error
does
not
include
the
effects
of
any
biases
due
to
nonresponse,
measurement
error,
processing
error,
or
other
system-
atic
errors
that
would
occur
even
in
a
complete
survey. The
standard
error
for
an
estimated
percentage
is
a
func-
tion
.of
the
sample
design,
the
sample
size,
and
the
percentage
itself.
Percentages
for
smaller
subgroups
are less
accurate
than
those
for
larger
subgroups,
and
those near
zero
or
100
percent
are
less
than
those
near
the
middle
of
the
range.
Given
the number
of
cases
listed
in
table
4
for,
the
various
student
characteristics,
the
sampling
error
of
the
reported proportions
can be
approximated
by
the formula
1
.18V,
~[p(l-p)/n]
,where
p
is
the
proportion
and
n is
the subgroup
size.
7
Table
4 Case
counts
and
non-response
rates
of
NLS
respondents
by
student
characteristicsa
All
full-time
respondents
Student
characteristics
Student
characteristic
non-response
Number
of
cases
All
full-time
respondents
with
source
information
(study
group)
Source
non-response*
Number
of
cases
ALL
STUDENTS
SES
QUARTILE
Highest
Third
Second
Lowest
RACIAL/ETHNIC
GROUP
White
Black
Hispanic
ACHIEVEMENT/ABILITY
QUARTILE
Highest
Third
Second
Lowest
INSTITUTION
TYPE
Public
4
Public
2
Private
4
Private
2
Vocational
Other/Proprietary
0%
1%
11
%
.17%
15%
10,189
10,089
2,612
2,439
2,246
2,801
9,053
7,571
1,150
332
18,491
1,856
.2,707
1,940
1,988
8,639
3,852
2,396
1,753
190
150
298
aSubset
of
all
fuli-timerespondents
who
also
listed
a
source
of
financial
support.
8
14%
14%
11
12
13
18
8,748
8,709
2,324
2,136
1,954
2,295
14%
13
21
17
14%
9
15
21
11%
11
12
9
12
18
12
7,806
6,618
913
275
7,309
1,692
2,396
1,649
1,572
7,701
3,447
2,099
1,602
167
123
263
U.S.
DEPARTMENT
OF
HEALTH,
EDUCATION,~
AND
WELFARE
'Education
Division
WASHINGTON,
D.C.
20202
OFFICIAL
BUSINESS
PENALTY
FOR
PRIVATE
USE,
$300.
POSTAGE
AND
FEES
PAID
U.S DEPARTMENT
OF
H.E.W.
HEW
391
I
FOURTH
CLASS
BOOK
RATE
U.S.
DEPARTMENT
OF
HEALTH,
EDUCATION,
AND
WELFARE
Education
Division
NCES
77-252