Distribution and mobility of heavy metals
Bạn đang xem bản rút gọn của tài liệu. Xem và tải ngay bản đầy đủ của tài liệu tại đây (437.75 KB, 17 trang )
ENPO 2364 Disk used No. pages 17, DTD=4.3.1
Version 7.5
ARTICLE IN PRESS
UNCORRECTED
PROOF
Distribution and mobility of metals in contaminated sites.
Chemometric investigation of pollutant profiles
Ornella Abollino
a
, Maurizio Aceto
b
, Mery Malandrino
a
, Edoardo Mentasti
a,
*,
Corrado Sarzanini
a
, Renzo Barberis
c
a
Department of Analytical Chemistry, University of Torino, Via P. Giuria 5, 10125 Torino, Italy
b
Department of Science and Advanced Technologies, University of East Piedmont, Corso Borsalino 54, 15100 Alessandria, Italy
c
Environmental Protection Agency of the Regional Government of Piedmont (ARPA Piemonte), Via della Rocca 49, 10123 Torino, Italy
Received 10 July 2001; accepted 9 November 2001
‘‘Capsule’’: Chemometrics allowed identification of groups of samples with similar characteristics.
Abstract
The distribution and mobility of heavy metals in the soils of two contaminated sites in Piedmont (Italy) was investigated, evalu-
ating the horizontal and vertical profiles of 15 metals, namely Al, Cd, Cu, Cr, Fe, La, Mn, Ni, Pb, Sc, Ti, V, Y, Zn and Zr. The
concentrations in the most polluted areas of the sites were higher than the acceptable limits reported in Italian and Dutch legisla-
tions for soil reclamation. Chemometric elaboration of the results by pattern recognition techniques allowed us to identify groups of
samples with similar characteristics and to find correlations among the variables. The pollutant mobility was studied by extraction
with water, dilute acetic acid and EDTA and by applying Tessier’s procedure. The fraction of mobile species, which potentially is
the most harmful for the environment, was found to be higher than the one normally present in unpolluted soils, where heavy
metals are, to a higher extent, strongly bound to the matrix. # 2001 Published by Elsevier Science Ltd. All rights reserved.
Keywords: Heavy metals; Contaminants; Soils; Mobility; Speciation
1. Aim of investigation
The problem of contaminated soils is becoming of
increasing concern for the environment because of the
large number of polluted sites in existence (Ferguson
and Kasamas, 1999). The main sources of soil pollution
are improper waste dumping, abandoned industrial
activities, incidental accumulation (e.g. leakage, corro-
sion), atmospheric fallout, agricultural chemicals (Allo-
way, 1994). Many contaminated sites date back to two
or three decades ago, when environmental legislation on
solid and liquid waste disposal was not as strict as
nowadays.
Before starting the reclamation of a site, the extent
and distribution of contamination must be investigated,
in order to identify the area to be treated and choose the
proper clean-up strategy. A few examples of such
investigations, with regard to heavy metal pollution, are
the determination of arsenic, chromium and copper in
Danish soils after spill of chemicals (Lund and Fobian,
1991), the evaluation of the heavy metal content around
a disused mine in Korea (Jeong et al., 1997) and the
assessment of arsenic contamination in Germany due to
ore and industrial sources (Bombach et al., 1994). The
present paper describes the characterisation of heavy
metal pollution in the soils of two sites formerly used
for industrial waste disposal. The horizontal and ver-
tical distribution of contaminants was investigated and
the concentrations were compared with the acceptable
limits imposed by Italian and Dutch legislation (Minis-
try of Housing, 1994; Ministerial Decree, 1999b) for soil
reclamation. A chemometric treatment of the data was
performed.
The toxicity of metals depends not only on their total
concentration, but also on their mobility and reactivity
with other components of the ecosystem. The most com-
mon way to study element mobility in soils is by treat-
ment with extractants of different chemical properties
0269-7491/01/$ - see front matter # 2001 Published by Elsevier Science Ltd. All rights reserved.
PII: S0269-7491(01)00333-5
Environmental Pollution & (&&&&) &–&
www.elsevier.com/locate/envpol
* Corresponding author. Tel.: +39-011-6707625; fax: +39-011-
6707615.
E-mail address: (E. Mentasti).
1
2
3
4
5
6
7
8
9
10
11
12
13
14
15
16
17
18
19
20
21
22
23
24
25
26
27
28
29
30
31
32
33
34
35
36
37
38
39
40
41
42
43
44
45
46
47
48
49
50
51
52
53
54
55
56
57
58
59
60
61
62
63
64
65
66
67
68
69
70
71
72
73
74
75
76
77
78
79
80
81
82
83
84
85
86
87
88
89
90
91
92
93
94
95
96
97
98
99
100
101
102
103
104
105
106
107
108
109
110
111
112
ENPO 2364 Disk used No. pages 17, DTD=4.3.1
Version 7.5
ARTICLE IN PRESS
UNCORRECTED
PROOF
(Nowak, 1995; Szulczewski et al., 1997; Rauret, 1998).
In this work the release of metals into water, dilute
acetic acid and EDTA was investigated, and the Tes-
sier’s partitioning scheme (Tessier et al., 1979) was
applied to selected samples.
The results obtained can be of use for the local
authorities to decide about the necessity of reclamation
of the two sites and the level of priority of the interven-
tion, with respect to the situation of other polluted areas.
Moreover, the data can be of interest to the European
Environment Agency for its activities of soil monitoring.
2. Description of the experimental procedures
2.1. Site description
The two investigated sites are located in northeast
Piedmont, Italy. The first one (hereafter called site A) is
in a flat area near the small town of Pieve Vergonte
(3000 inhabitants), in the province of Verbania, located
about 100 m from a small river. The zone stands on
alluvial deposits of the river. The top layers of the soil
are made of sand and silt. Groundwater flows at a depth
of about 5 m. The contaminated area, whose estimated
extension and volume are 5000 m
2
and 17,000 m
3
respectively, is made up of a mixture of industrial
wastes and soil. The original soil is almost absent in the
area and in its surroundings, because of repeated exca-
vations; the soil covering the area, probably carried
from nearby zones, is mainly made of gravel and sand.
The presence of debris, probably coming from copper
and brass foundries, can also be visually detected owing
to the presence of coloured (mainly blue-green) spots
due to metal salts and of small plastic strips, deriving
from wire coatings. The material was not placed in a
previously excavated area, but it forms an artificial relief
with respect to the surroundings. The zone where the
relief lies consists of three levels: the relief itself, an area
at ground level, at least twice as wide, and an excavated
basin about 7 m deep.
The other site (hereafter called site B) is located near
the town of Borgomanero (19,400 inhabitants), in the
province of Novara. The contamination occurred
because of the repeated floods of a small stream, which
today has a new course, caused by the insufficient size of
the stream bed with respect to the flow in rainy periods.
The stream collected wastewaters of local industries,
some of which operating in the electroplating field, and
its floods caused an accumulation of contaminants,
mainly of inorganic nature, in the soil. The extension of
the polluted area is estimated between 20,000 and
100,000 m
2
. The core of the contaminated zone is about
3000 m
2
wide: it is a flat, uncultivated area, covered by a
layer of black sludge about 1.50 m deep carried by
the floods, where a scant vegetation grows. The rest of
the area is covered by trees and spontaneous plants. The
land in the zone is made of alluvial deposits. The top
layer of the soil, down to a depth of from 0.6 to 2 m, is
composed of sand with silt and clay, with a low gravel
content. This layer gives a discrete impermeability to the
soil. Below there is an alluvial layer with sand and gravel,
down to groundwater which flows at 4–5 m depth.
Table 1 reports a brief description of the location of
the single sampling points, which were chosen in a ran-
dom fashion in order to cover the whole areas. A total
of 33 samples was collected at site A, both at different
points of the presumably most contaminated zone and
in the surroundings. Some were sampled from the sur-
face and others immediately below, at a depth of 10 cm.
One specimen was obtained in a hole (1 m deep) dug on
the relief. Two pieces of blue-green material were also
collected. For comparison, a sample from a park in the
city centre was considered. Fifteen samples were col-
lected at different depths on one side of the relief, down
to 330 cm. At site B 28 samples were collected from the
core of the contaminated zone and its surroundings,
both at the surface and 10 cm below. Also in this case,
one soil specimen from the nearby town nearby was
collected. Eleven samples were obtained from different
depths, down to 160 cm, from one point in the central
area of the core.
The collected samples, referred to as ‘‘soil’’ in this
paper, when coming from the most polluted areas of the
sites, were not strictly ‘‘soil’’ but rather a material cov-
ering the original soil, with the characteristics described
above (mixture of soil and debris at site A, black sludge
at site B).
2.2. Apparatus and reagents
Most metal determinations were performed with a
Varian Liberty 100 (Varian Australia, Mullgrave, Aus-
tralia) inductively coupled plasma–atomic emission
spectrometer (ICP–AES). The spectral interference of
Fe and V, which have an emission line close to that one
of La (379.478 nm), was taken into account by selecting
background correction positions outside the interfering
peaks. Alternatively, La can be determined at 407.672
nm. Standards for calibrations were prepared in ali-
quots of sample blanks.
Cadmium and lead, when present below the ICP–AES
detection limits, were determined with a Perkin Elmer
5100 (Perkin Elmer, Norwalk, Connecticut, USA) elec-
trothermal atomic absorption spectrometer (ETAAS)
equipped with Zeeman-effect background correction.
Sample dissolutions for the determination of total
concentrations were performed in tetrafluormethoxyl
(TFM) bombs, with a Milestone MLS-1200 Mega
(Milestone, Sorisole, Italy) microwave laboratory unit.
Analytical grade reagents were used throughout. Stan-
dard metal solutions were prepared from concentrated
2 O. Abollino et al. / Environmental Pollution & (&&&&) &–&
1
2
3
4
5
6
7
8
9
10
11
12
13
14
15
16
17
18
19
20
21
22
23
24
25
26
27
28
29
30
31
32
33
34
35
36
37
38
39
40
41
42
43
44
45
46
47
48
49
50
51
52
53
54
55
56
57
58
59
60
61
62
63
64
65
66
67
68
69
70
71
72
73
74
75
76
77
78
79
80
81
82
83
84
85
86
87
88
89
90
91
92
93
94
95
96
97
98
99
100
101
102
103
104
105
106
107
108
109
110
111
112
ENPO 2364 Disk used No. pages 17, DTD=4.3.1
Version 7.5
ARTICLE IN PRESS
UNCORRECTED
PROOF
Merck Titrisol stock solutions (Merck, Darmstadt,
Germany).
2.3. Procedures
All experiments were performed in triplicate and
blanks were run simultaneously. The relative standard
deviations of the results were typically below 10%.
Higher deviations were observed, for some data, for
extractions in water and acetate, owing to the low con-
centrations measured; in some cases also the total
concentrations in the polluted area at A site showed a
variability higher than 10%, especially for copper,
because of the heterogeneity of the samples.
The evaluation of pH and EDTA-extractable frac-
tions was performed according to the official methods of
soil analysis envisaged by the Italian legislation (Minis-
terial Decree, 1992). After completion of the experi-
mental work, a new revision of official methods was
issued (Ministerial Decree, 1999a), which in any case
only slightly differs from the previous one. The leaching
test with acetic acid was performed according to the
Italian official methods for sludge analysis (Water
Research Institute, 1985).
2.3.1. Sampling and pretreatment
Surface samples were obtained with a trowel (after
removing the top layer in contact with the atmosphere)
and stored in plastic bags. In-depth samples at site B
were collected with the aid of a motor-driven corer. The
samples were air-dried and, after breaking the agglom-
erates with a plastic hammer, sieved through a 2-mm
sieve and ground with a ball mill.
2.3.2. pH
Sample pH was determined in sample-water suspen-
sions (8 g of sample in 20 ml of water). The suspensions
were shaken and left standing overnight before the
measurement (Ministerial Decree, 1992).
2.3.3. Sample digestion for total metal determination
Aqua regia (5 ml) and 2 ml of hydrofluoric acid were
added to 100 mg of sample in TFM bombs and heated
in a microwave oven following the sequence: three steps
Table 1
Description of sample collection points
Site A sample Description Site B sample Description
A1 Basin B1 Site core
A2 10 cm below A1 B2 10 cm below B1
A3 Ground level B3 Site core
A4 10 cm below A3 B4 10 cm below B3
A5 About 5 m far from the site B5 Site core
A6 10 cm below A5 B6 Border of site core
A7 Ground level B7 10 cm below B6
A8 10 cm below A7 B8 Just outside site core
A9 Relief B9 10 cm below B8
A10 0 cm below A9 B10 Just outside site core
A11 Relief, 30 m far from A9 B11 10 cm below B10
A12 10 cm below A11 B12 Vertical profile, 0–15 cm
A13 Hole in the relief B13 Vertical profile, 15–30 cm
A14 Border of the relief B14 Vertical profile, 30–40 cm
A15 Coloured material from the relief B15 Vertical profile, 40–50 cm
A16 Coloured material from the hole B16 Vertical profile, 50–65 cm
A17 Vertical profile, 0–30 cm B17 Vertical profile, 65–80 cm
A18 Vertical profile, 30–50 cm B18 Vertical profile, 80–100 cm
A19 Vertical profile, 50–60 cm B19 Vertical profile, 100–115 cm
A20 Vertical profile, 60–100 cm B20 Vertical profile, 115–130 cm
A21 Vertical profile, 100–135 cm B21 Vertical profile, 130–145 cm
A22 Vertical profile, 135–155 cm B22 Vertical profile, 145–160 cm
A23 Vertical profile, 155–160 cm B23 About 5 m North to the site core
A24 Vertical profile, 160–190 cm B24 About 5 m South to the site core
A25 Vertical profile, 190–218 cm B25 About 5 m West to the site core
A26 Vertical profile, 218–238 cm B26 About 5 m East to the site core
A27 Vertical profile, 238–260 cm B27 About 200 m S-E to the site core
A28 Vertical profile, 260–280 cm B28 City centre
A29 Vertical profile, 280–300 cm
A30 Vertical profile, 300–320 cm
A31 Vertical profile, 320–330 cm
A32 About 400 m far from the site
A33 Centre of the town
O. Abollino et al. / Environmental Pollution & (&&&&) &–& 3
1
2
3
4
5
6
7
8
9
10
11
12
13
14
15
16
17
18
19
20
21
22
23
24
25
26
27
28
29
30
31
32
33
34
35
36
37
38
39
40
41
42
43
44
45
46
47
48
49
50
51
52
53
54
55
56
57
58
59
60
61
62
63
64
65
66
67
68
69
70
71
72
73
74
75
76
77
78
79
80
81
82
83
84
85
86
87
88
89
90
91
92
93
94
95
96
97
98
99
100
101
102
103
104
105
106
107
108
109
110
111
112
ENPO 2364 Disk used No. pages 17, DTD=4.3.1
Version 7.5
ARTICLE IN PRESS
UNCORRECTED
PROOF
of 5 min each (at a power of 250, 400, 500 W, respec-
tively) followed by a final 3 min step at 600 W. Then 0.7
g of boric acid were added and the bombs were further
heated for 10 min at 250 W. Finally the samples were
filtered and diluted to 100 ml (Bettinelli et al., 1989;
Aceto et al., 1994; Gulmini et al., 1994).
2.3.4. Available metal fraction
The extractant was a 0.02 mol dm
À3
EDTA solution
containing 0.5 mol dm
À3
CH
3
COONH
4
in 2.5% acetic
acid and brought to pH 4.65Æ 0.05. Twenty-five milli-
litres of the extractant were added to aliquots of 5.0 g of
sample. The suspension was shaken for 30 min, filtered
and the extract was analysed (Ministerial Decree, 1992).
2.3.5. Leaching tests
Leaching tests were performed with HPW and
CH
3
COOH. As to the former, a suspension prepared
and treated as described for pH measurement was cen-
trifuged and the supernatant was separated and analysed.
The leaching test with acetic acid was performed on a
suspension of 1.0 g of sample in 16 ml of HPW brought
to pH 5Æ0.2 by addition of 0.5 mol dm
À3
acetic acid.
The suspension was shaken for 24 h; the pH was peri-
odically checked and maintained at the original value.
Afterwards the suspension was centrifuged and the
supernatant was separated and analysed (Water
Research Institute, 1985).
2.3.6. Sequential extractions
The sample (1.0 g) was sequentially extracted with
different reagents according to the following procedure
(Tessier et al., 1979): (1) 8 ml of 1 mol dm
À3
MgCl
2
, for
1 h, at room temperature; (2) 8.0 ml of 1 mol dm
À3
CH
3
COONa, added with CH
3
COOH (pH 5.0), for 5
hours, at room temperature; (3) 20 ml of 0.04 mol dm
À3
NH
2
OH. HCl in 25% CH
3
COOH, for 6 h at 96Æ 3
C;
(4) 5.0 ml of 30% H
2
O
2
and 3.0 ml of 0.02 mol dm
À3
HNO
3
, for 5 h at 85Æ2
C, followed by addition (after
cooling) of 5 ml of 3.2 mol dm
À3
CH
3
COONH
4
in 20%
HNO
3
, dilution to 20 ml, and further extraction for 30
min at room temperature.
After each step the suspension was centrifuged, the
supernatant was separated and the solid phase was
added with the reagents for the subsequent extraction.
The extracts were diluted to 25 (first fraction), 50 (sec-
ond fraction) and 100 (next two fractions) ml, stabilised
by the addition of concentrated nitric acid (25, 50 and
100 ml respectively) and analysed in order to calculate
the element percentages extracted in each fraction. The
residual element percentages (fifth fraction) were com-
puted from the total concentrations by subtraction. The
mass balance was evaluated for a few samples by com-
paring the total metal content with the sum of the metal
percentages extracted in the five fractions after digestion
and analysis of the fifth fraction. The recovery was high
(i.e. > 90%) for Cd, Cr, Cu, Ni, Pb, Zn (i.e. the heavy
metals of greatest interest from the environmental point
of view) and Al, whereas Fe, Mn, Ti, V, Zr were par-
tially lost (recoveries ranged between 67 and 82%). Zir-
conium was mostly lost in the first extraction step,
manganese in the fourth one, whereas losses of the other
elements took place in all the first four steps, probably
during filtration of the surnatant.
2.3.7. Chemometric data treatment
Two unsupervised methods (Hierarchical Cluster
Analysis, HCA, and Principal Component Analysis,
PCA) and a supervised one (Discriminant Analysis, DA)
were applied to the data. The treatment was performed
with XlStat, an add-in package of Microsoft Excel.
HCA was run applying Ward’s method of agglom-
eration and squared Euclidean distance as similarity
measure. All variables were standardised by transform-
ing data into Z-scores (i.e. (xÀx
m
)/, where x
m
stands
for the average). Dendrograms were obtained.
As to DA, two classes were defined a priori, con-
sidering samples from sites A and B respectively. Uni-
variate ANOVA was used to calculate F-ratios and find
out variables with higher discriminating power. Prob-
abilities of class membership were calculated for all
samples.
3. Results and discussion
3.1. Total metal concentrations
Fifteen metals, namely Al, Cd, Cu, Cr, Fe, La, Mn,
Ni, Pb, Sc, Ti, V, Y, Zn and Zr, were determined.
Tables 2–3 report their concentrations and the pH
values, in samples collected at sites A and B respec-
tively. The corresponding ranges, averages and medians
are reported in Table 4; to allow an easier interpretation
of the results, calculations were performed for three
groups of data: (1) all samples except A15 and A16,
which consist of coloured material, and the vertical
profile; (2) all samples except A15, A16, the vertical pro-
file and the ones outside the most polluted area; (3)
vertical profile. Of course a detailed mapping of the
contamination cannot be achieved from the relatively
small number of sample points, but the results obtained
allow anyway to make some considerations about the
distribution and extent of the pollution in the areas.
It must be recalled that the considered elements are
present in unpolluted soils at what can be defined
‘‘background level’’, both as a result of natural phe-
nomena, such as the contribution of the parent material,
and of common anthropogenic activities (e.g. agri-
culture, traffic, etc.). We can suspect or confirm the pres-
ence of pollution when the concentrations are higher
than the typical values for soils found in literature and
4 O. Abollino et al. / Environmental Pollution & (&&&&) &–&
1
2
3
4
5
6
7
8
9
10
11
12
13
14
15
16
17
18
19
20
21
22
23
24
25
26
27
28
29
30
31
32
33
34
35
36
37
38
39
40
41
42
43
44
45
46
47
48
49
50
51
52
53
54
55
56
57
58
59
60
61
62
63
64
65
66
67
68
69
70
71
72
73
74
75
76
77
78
79
80
81
82
83
84
85
86
87
88
89
90
91
92
93
94
95
96
97
98
99
100
101
102
103
104
105
106
107
108
109
110
111
112
ENPO 2364 Disk used No. pages 17, DTD=4.3.1
Version 7.5
ARTICLE IN PRESS
UNCORRECTED
PROOF
exceed the levels present in the nearby areas: in fact in
some (albeit uncommon) cases high concentrations of
one or more elements have a natural origin, as in some
soils in California rich in selenium (Halloway, 1990).
In this study, in order to assess the presence and
extension of contamination, the concentrations of some
elements measured at the sites were compared with the
normal ranges and the most common values typically
present in soils (Halloway, 1990; Merian, 1991) and
with the maximum admissible levels in soils according
to Italian (Ministerial Decree, 1999a,b) and Dutch
(Ministry of Housing, 1994) legislations. These data are
collected in Table 5, which also reports, for comparison,
the mean content in the earth’s crust (Weast, 1974).
3.1.1. Site A
Abnormally high levels of Cd, Cu, Pb and Zn were
found at site A. In particular, the presence of copper is
related to the disposal of electric cables. The most pol-
luted zone is the relief, in which an overall increase of
these four elements and, to a lesser extent, of chromium,
manganese, nickel and zirconium can be observed. The
concentrations of these metals are smaller in the basin,
even if a contamination of cadmium, copper, lead and
zinc is present. Also the neighbouring zone under the
vegetation has relatively high levels of Cu, Pb and Zn.
The concentrations at the base of the relief usually fall
between the ones in the relief and under the vegetation.
The contents of Cr and Ni do not exceed the typical
ranges, but in many samples are above the common
values reported in Table 5 and, especially in the vertical
profile (whose behaviour will be discussed below), are
higher than in the surroundings: therefore an input of
these elements with the waste can be supposed. The
same hypothesis is valid for manganese, whose level in
the vertical profile, moreover, is higher than typical
values. Some samples on the relief (A9, A10, A12, A13)
are also rich in zirconium, which might have been con-
tained in the wastes as well.
The concentrations found a few hundred meters from
the site are not higher than the ones present in the
sample collected in the city centre, which can be
assumed to be unaffected by the waste disposal which
caused the contamination of the site; in both cases the
Table 2
Total metal concentrations (mg/kg) and pH at site A
Sample pH Al Cd Cr Cu Fe La Mn Ni Pb Sc Ti V Y Zn Zr
A1 6.41 62029 16.1 513 426 29092 16.5 737 32.4 301 9.42 3286 39.5 15.8 677 10.3
A2 6.65 65825 21.2 51.3 903 32223 16.6 915 40.5 955 10.3 3196 46.9 15.7 1388 < 10.0
A3 6.68 71971 12.6 110 3592 32972 20.1 1951 68.9 2505 11.0 3296 46.1 17.9 4576 < 10.0
A4 7.16 66443 28.7 102 8270 34185 22.1 2324 77.6 3869 10.2 3138 39.8 19.1 10143 12.0
A5 4.43 65692 3.21 112 1782 37422 23.4 1733 65.0 2867 8.89 3317 44.1 16.3 3918 10.9
A6 4.94 82704 1.21 73.0 744 41108 23.8 917 33.1 432 9.88 3724 44.0 16.1 1153 < 10.0
A7 6.84 69075 15.2 120 5219 33537 20.5 2169 81.0 4682 10.5 2992 42.7 18.2 7834 < 10.0
A8 7.00 70340 18.4 154 7895 33361 21.1 3095 102 5833 9.97 2855 39.9 16.2 13955 10.3
A9 5.52 68388 22.5 190 9957 44939 29.4 3155 185 11083 10.6 3753 45.7 22.1 14532 22.5
A10 5.70 67668 26.3 409 20059 36460 16.9 7313 496 20717 7.54 2565 51.0 12.9 30243 44.4
A11 6.16 62389 22.4 119 15371 40014 20.1 4792 148 9572 8.56 3160 38.0 16.4 20868 11.9
A12 5.43 61670 70.5 134 28172 39964 19.8 7688 290 13553 7.87 2354 31.4 17.1 47681 17.3
A13 6.04 36436 44.1 301 19835 30011 12.7 3050 223 22296 < 2.00 707 26.7 5.81 36963 29.3
A14 5.31 70304 3.11 59.0 2081 39121 27.9 1283 < 30.0 1176 11.3 3924 35.5 23.2 1789 < 10.0
A15 5.99 68293 52.1 200 27992 43949 23.7 4493 239 14750 9.41 2926 54.7 18.7 24850 21.4
A16 5.93 36420 18.4 155 171549 12011 7.62 1879 439 7196 4.97 1226 17.5 6.69 51557 22.3
A17 5.49 66822 126 254 37703 62085 13.4 20604 418 39094 6.39 1706 58.8 10.6 47271 22.6
A18 5.49 54202 160 191 43913 58835 9.99 44724 441 59217 5.30 1271 60.9 8.04 55417 20.6
A19 5.49 54150 34.8 329 26401 20493 16.4 8720 370 21239 5.33 1845 37.1 9.43 36788 53.3
A20 5.74 62791 46.2 499 33697 45163 13.7 2011 477 38014 4.47 1270 36.4 9.57 49912 58.2
A21 5.74 79315 37.3 531 26054 68781 16.7 4435 317 56797 4.78 1486 53.7 8.57 66547 66.3
A22 5.74 68348 44.6 279 13208 19066 14.7 3990 408 19657 5.71 2027 42.8 10.7 45221 64.8
A23 5.88 71978 120 459 22351 59650 15.4 10403 542 35613 4.50 1923 68.4 10.1 54422 46.3
A24 5.88 56434 77.8 302 22627 45086 13.9 18420 282 30069 4.93 1765 57.2 11.0 45304 41.7
A25 5.88 55615 46.3 483 28492 37571 9.4 17050 289 37050 3.00 1051 37.3 7.99 51774 48.7
A26 5.87 64672 62.4 386 26134 48444 14.3 13816 305 33045 4.85 1869 45.6 10.9 45108 39.2
A27 5.87 58161 45.6 311 21575 43769 11.57 10188 255 26449 4.89 1614 43.8 9.45 35475 32.5
A28 5.98 52281 37.7 352 21279 34177 10.2 11675 271 21279 3.44 1219 40.2 8.07 40064 41.0
A29 5.88 54322 48.4 259 20695 39293 12.9 7218 236 22613 4.82 1445 38.4 9.13 31020 31.0
A30 5.75 66399 39.6 356 22712 48785 18.3 6781 341 32283 4.90 1883 48.1 10.3 42636 44.0
A31 5.87 64248 27.8 337 21162 45689 16.7 7721 294 27291 5.58 1814 40.5 11.6 38733 41.1
A32 7.75 61730 < 7.50 47.2 41.8 32877 10.1 705 < 30.0 119 11.2 4115 36.8 16.9 108 < 10.0
A33 6.49 59380 < 7.50 63.8 73.6 45457 12.1 850 < 30.0 69.4 13.5 7600 66.2 14.1 255 < 10.0
O. Abollino et al. / Environmental Pollution & (&&&&) &–& 5
1
2
3
4
5
6
7
8
9
10
11
12
13
14
15
16
17
18
19
20
21
22
23
24
25
26
27
28
29
30
31
32
33
34
35
36
37
38
39
40
41
42
43
44
45
46
47
48
49
50
51
52
53
54
55
56
57
58
59
60
61
62
63
64
65
66
67
68
69
70
71
72
73
74
75
76
77
78
79
80
81
82
83
84
85
86
87
88
89
90
91
92
93
94
95
96
97
98
99
100
101
102
103
104
105
106
107
108
109
110
111
112
ENPO 2364 Disk used No. pages 17, DTD=4.3.1
Version 7.5
ARTICLE IN PRESS
UNCORRECTED
PROOF
contents of Cr, Cu, Pb, Ni, Mn and Zn are inside the
typical ranges.
Al, Fe, La, Sc Ti, V and Y concentrations do not
show a definite trend as a function of sampling position.
The level of iron on the relief is higher than at the base
and in the basin, but lower than in the city center: it is
likely that the disposed wastes contained iron, causing a
local increase in its concentration, even if the levels
reached are not abnormal. An input of lanthanum with
the wastes may have occurred, since its concentrations
are slightly higher at the site than in the city centre and
the surrounding area.
The pH is lower in the relief than in the surrounding
area (except under vegetation).
The concentrations of Cd, Cu, Mn, Ni, Pb, Zn and Zr
are lower in surface samples than 10 cm below, with a
few exceptions. In most cases the levels of La, Sc, Ti, V
and Y show the opposite behaviour. There is not a reg-
ular trend for Al, Cr or Fe.
The concentrations of Cd, Cr, Cu, Mn, Ni, Pb, Zn
and Zr in the vertical profile are similar or even higher
than the ones found on the relief surface, confirming the
presence of a bulk mass of disposed wastes. There is not
a regular trend in the concentrations as a function of
depth, with the exception of copper which tends to
decrease with increasing depth; in any case for many
elements (Cd, Cr, Cu, Ni, Pb, Zn, Fe, Zr and V) larger
fluctuations and generally higher concentrations are
observed in top layers than in deeper ones. The highest
value for Al, Cd, Cr, Cu, Fe, Mn, Pb, Zn and Zr is
between 30 and 135 cm, whereas the lowest in many
cases is below.
One of the pieces of material analysed (A15) has con-
centrations similar to ones of the relief, whereas the
other (A16) has a very high copper level and low con-
tent of Fe and of La, Sc, Ti, V and Y.
In general the metal distribution is heterogeneous,
owing to the heterogeneous mixing of the soil with par-
ticles coming from the waste.
From the above observations the metals can be divi-
ded into four groups: (1) Cd, Cu, Pb and Zn, which are
present at very high levels at the site; (2) Cr, Mn and Ni,
by which the site is supposed to be contaminated (see
also the discussion on legislation below), but to a lesser
extent; (3) Fe, La and Zr, in which an input from wastes
is supposed but whose level is not a sign of pollution; (4)
Al, Sc, Ti, V and Y whose concentrations in the pol-
luted area and in the surroundings are similar. There-
fore it can be presumed that the elements of the first
three groups have both geochemical and (to different
extents) anthropogenic sources, whereas the ones of
group four have mainly a geochemical origin.
Table 3
Total metal concentrations (mg/kg) and pH at site B
Sample pH Al Cd Cr Cu Fe La Mn Ni Pb Sc Ti V Y Zn Zr
B1 5.00 58931 4.75 3593 5753 29933 28.3 259 1418 687 9.07 4712 43.9 20.2 679 42.8
B2 4.06 58150 8.05 2880 4013 29246 33.9 251 741 864 8.61 5027 43.6 19.5 417 44.8
B3 5.17 50390 5.54 3016 5743 29022 27.4 265 1983 703 3.20 3808 40.9 19.8 1053 42.4
B4 4.51 48639 2.74 3160 5032 28635 26.8 230 1140 657 7.26 4105 40.9 17.1 598 40.5
B5 4.97 64379 0.98 312 3953 29966 32.5 281 969 533 8.02 4611 36.7 19.1 517 38.0
B6 5.80 64067 0.54 4523 7657 28501 41.7 259 1964 1162 9.86 6273 46.3 22.0 868 50.9
B7 6.08 64961 3.03 3905 4092 29487 24.4 240 1021 393 8.23 5172 50.0 12.1 723 54.2
B8 5.30 31514 0.17 2781 2485 19005 19.8 521 1471 675 5.46 3888 27.2 13.6 738 20.9
B9 5.66 59799 0.15 2101 1537 27674 23.8 328 856 244 8.53 4693 40.9 11.9 618 51.5
B10 5.22 61453 1.34 179 3151 34306 24.6 372 1142 621 7.32 4613 43.4 17.9 849 38.5
B11 4.96 55802 1.43 338 5778 30075 21.9 259 1272 751 5.79 5273 38.6 14.9 804 37.8
B12 4.41 63029 0.84 3123 3478 29412 31.8 265 697 156 9.50 4431 38.2 23.1 346 43.6
B13 3.92 67849 1.37 4683 3310 31394 31.7 258 648 159 9.79 5978 37.1 22.9 466 43.8
B14 3.81 88936 0.55 299 1019 39147 27.7 311 128 15.7 12.8 3947 46.3 16.7 191 60.3
B15 3.43 86985 2.96 140 787 36757 26.3 320 261 10.3 11.9 3741 55.0 16.9 393 65.5
B16 3.42 83775 2.87 199 1721 33967 23.2 348 412 10.3 11.7 3588 52.3 19.0 713 59.6
B17 3.99 81668 0.89 184 373 36370 31.6 455 1037 10.4 11.9 3689 47.2 20.5 957 45.0
B18 5.49 78555 0.22 128 80.0 37125 26.2 473 132 9.16 11.4 3691 51.7 18.4 147 47.0
B19 4.56 77734 0.61 860 1110 35784 28.8 391 406 57.6 11.3 3916 49.0 19.8 355 47.5
B20 5.63 72181 0.12 170 126 33379 25.3 404 98.0 11.7 10.4 3350 49.5 17.8 127 35.2
B21 6.05 73021 0.14 152 82.0 36502 19.2 437 179 8.33 12.1 3638 53.1 16.5 142 33.6
B22 5.74 71518 0.10 < 20.0 86.2 39333 17.4 624 158 5.59 11.5 3773 43.7 15.1 138 66.5
B23 5.75 50079 < 0.05 2958 2075 34372 24.5 269 863 664 < 2.00 5365 57.8 10.8 909 63.6
B24 4.16 45356 < 0.05 55.28 74.3 38252 29.2 337 33.0 21.0 3.18 3782 56.5 3.48 109 88.9
B25 4.17 41888 < 0.05 37.7 62.6 28110 17.8 394 30.1 293 3.88 3210 37.3 5.66 108 67.2
B26 5.24 54600 < 0.05 752 2148 27877 23.5 591 222 355 7.84 3344 32.3 13.5 853 48.7
B27 5.53 62844 1.14 49.7 26.8 30382 26.2 338 32.4 54.2 7.62 3574 48.4 10.9 103 87.0
B28 7.01 57323 < 0.05 68.3 20.6 43176 28.3 779 31.3 28.1 11.3 6038 23.8 18.9 125 36.8
6 O. Abollino et al. / Environmental Pollution & (&&&&) &–&
1
2
3
4
5
6
7
8
9
10
11
12
13
14
15
16
17
18
19
20
21
22
23
24
25
26
27
28
29
30
31
32
33
34
35
36
37
38
39
40
41
42
43
44
45
46
47
48
49
50
51
52
53
54
55
56
57
58
59
60
61
62
63
64
65
66
67
68
69
70
71
72
73
74
75
76
77
78
79
80
81
82
83
84
85
86
87
88
89
90
91
92
93
94
95
96
97
98
99
100
101
102
103
104
105
106
107
108
109
110
111
112
ENPO 2364 Disk used No. pages 17, DTD=4.3.1
Version 7.5
ARTICLE IN PRESS
UNCORRECTED
PROOF
3.1.2. Site B
High concentrations of Cd, Cu, Cr, Ni, Pb and Zn were
found at site B. In particular, the presence of Cr and Ni
could be due to an input from factories manufacturing
taps and fittings. The contamination is spread all over the
core of the site, and below the vegetation growing just
outside it. At a short distance from the core (points B23,
24, 25, 26) there is still a certain level of contamination,
but less pronounced than in the core; there are some
exceptions, such as the high levels of Cr, Pb and Zn in
sample B23. Metal concentrations are within normal
ranges about 200 m from the site and in the city centre.
No enrichment of Mn, Al, Fe, Sc, Ti, V or Zr in the
site is observed. A few samples (e.g. B2, B6) have a
relatively high concentration of lanthanum, but it is not
possible to say whether it is due to contamination.
A decrease in metal concentration from the surface to
the layer underneath was observed in many cases.
As to the vertical profile, the concentrations of Cd,
Cr, Cu, Ni and Pb, are higher in the top layers, and tend
to decrease below 40 cm. Many data in the lower layers
are above the common values (Table 5) but still within
the typical ranges, even if some local maxima are pres-
ent, such as for Ni (sample B17), Cd (B15–B16) and for
Cr, Cu and Pb (B19). The concentrations of zinc
increases down to 80 cm.
A general trend to higher values at depth than on the
surface is observed for Al, Fe, Mn, Sc, V and Y. The
concentrations of La and, partially, of Ti tend to
decrease with depth, whereas those of zirconium do not
show any trend. The pH value is lower than 4 at a depth
of between 15 and 80 cm: it is likely that this low value
is due to an input of acidic wastewater.
In general, the metals can be divided into two groups:
(1) Cd, Cr, Cu, Ni, Pb and Zn, whose concentrations
are heavily affected by anthropogenic inputs, and (2) Al,
Fe, Mn, Sc, Ti, V and Zr, which are mainly of geo-
chemical origin.
3.1.3. Legislation limits
The results were compared with the maximum
acceptable concentrations in soils reported in the
Table 4
Mean, median, ranges of total concentrations (mg/kg) at sites A and B
Site Mean
a
Median
a
Range
a
Mean
b
Median
b
Range
b
Mean
c
Median
c
Range
c
pH A 6.16 6.29 4.43–7.75 6.02 5.74 5.31–6.16 5.77 5.87 5.49–5.98
B 5.21 5.22 4.06–7.01 5.16 5.17 4.06–6.08 4.59 4.41 3.42–6.05
Al A 65128 66134 36436–82704 65781 62030 36436–70304 61983 62791 52281–79315
B 54716 57323 31514–64961 56190 58931 31514–64961 76841 77734 63029–88936
Cd A – 17.3 1.21–70.5 21.8 33.25 3.11–70.5 63.6 46.2 27.8–160
B – 0.98 < 0.05–8.05 2.61 1.43 0.15–8.05 0.97 0.61 0.10–2.96
Cr A 131 111 47.2–409 142 127 59.0–301 355 337 191–531
B 1806 2101 37.7–4523 2435 2880 179–4523 – 184 < 20.0–4683
Cu A 7776 4406 41.8–28172 8879 17603 2081–28172 25867 22712 13208–43913
B 3153 3151 20.6–7657 4472 4092 1537–7657 1107 787 80.0–3478
Fe A 36421 35323 29092–45457 36029 39543 3011–40014 45126 45163 19066–68781
B 30472 29487 19005–43176 28714 29246 1900–34306 35379 36370 29412–39333
La A 19.6 20.1 10.1–29.4 20.8 20.0 12.7–27.9 13.8 13.9 9.40–18.3
B 26.7 26.2 17.8–41.7 27.7 26.8 19.8–41.7 26.3 26.3 17.4–31.8
Mn A 2667 2060 705–7688 2937 3921 1283–7688 12517 10188 2011–44724
B 351 281 230–779 297 259 230–521 390 391 258–624
Ni A – 73.3 < 30.0–496 – 186 < 30.0–290 350 317 236–542
B 893 969 30.1–1983 1271 1142 741–1983 378 261 98.0–1037
Pb A 6252 3368 69.4–22296 7132 11563 1176–22296 33314 32283 19657–59217
B 512 621 21.0–1162 663 675 244–1162 41.2 10.4 5.59–159
Sc A – 10.1 < 2.00–14 – 8.22 < 2.00–11.3 4.86 4.89 3.00–6.39
B – 7.62 < 2.00–11.3 7.40 8.02 3.20–9.86 11.3 11.5 < 2.00–12.8
Ti A 3374 3241 707–7600 3019 2757 707–3924 1613 1706 1051–2027
B 4558 4613 3210–6273 4743 4693 3808–6273 3977 3741 3350–5978
V A 42.1 41.3 26.7–66.2 40.8 3305 26.7–38.0 47.3 43.8 36.4–68.4
B 41.7 40.9 23.8–57.8 41.1 40.9 27.2–50.0 47.6 49.0 37.1–55.0
Y A 16.5 16.4 5.81–23.2 16.6 16.8 5.81–23.2 9.70 9.57 7.99–11.6
B 14.8 14.9 3.48–22.0 17.1 17.9 11.9–22.0 18.8 18.4 15.1–23.1
Zn A 12255 6205 108–47681 13980 28916 677–47681 45713 45221 31020–66457
B 592 679 103–1053 715 723 417–1053 361 346 127–957
Zr A – 10.3 < 10.0–44.4 – 14.6 < 10.0–29.3 43.4 41.7 20.6–66.3
B 50.3 44.8 20.9–88.9 42.0 42.4 20.9–54.2 49.8 47.0 33.6–66.5
a
All samples excluding A15, A16 and the vertical profile (A1–A14 and A32–A33; B1–B11 and B23–B28).
b
All samples excluding A15, A16, vertical profile and the ones outside the most polluted area (A1–A14; B1–B11).
c
Vertical profile samples (A17–A31; B12–B22).
O. Abollino et al. / Environmental Pollution & (&&&&) &–& 7
1
2
3
4
5
6
7
8
9
10
11
12
13
14
15
16
17
18
19
20
21
22
23
24
25
26
27
28
29
30
31
32
33
34
35
36
37
38
39
40
41
42
43
44
45
46
47
48
49
50
51
52
53
54
55
56
57
58
59
60
61
62
63
64
65
66
67
68
69
70
71
72
73
74
75
76
77
78
79
80
81
82
83
84
85
86
87
88
89
90
91
92
93
94
95
96
97
98
99
100
101
102
103
104
105
106
107
108
109
110
111
112
ENPO 2364 Disk used No. pages 17, DTD=4.3.1
Version 7.5
ARTICLE IN PRESS
UNCORRECTED
PROOF
Italian legislation
6
for the reclamation of contaminated
sites and with Dutch intervention values (Ministry of
Housing, 1994), formerly known as C values (Table 5).
Italian limits depend on land use, and are lower for
public and private green areas and residential sites (‘‘A’’
limits) and higher for industrial areas (‘‘B’’ limits). At
site A, the levels of Cd, Cu, Pb and Zn exceed ‘‘A’’ and
‘‘B’’ limits in most samples; the concentrations of Cr
and Ni are higher than ‘‘A’’ limits, but below ’’B’’ ones.
Copper, chromium and nickel contents at site B are
above both limits in many samples, whereas lead and
zinc, and in some cases cadmium, are between ‘‘A’’
and ‘‘B’’ values.
All samples exceeding ‘‘A’’ and some of the samples
exceeding ‘‘B’’ levels have concentrations above Dutch
intervention values, which are intermediate between the
two Italian sets of limits, and are to be considered,
according to the official terminology, ‘‘seriously pol-
luted’’.
3.1.4. Chemometric processing
The results were processed by PCA and HCA, in
order to obtain a visual representation of the data set
and gain insight into the distribution of the pollutants
by detecting similarities or differences which would be
more difficult to identify only by looking at the tables.
As to PCA, both scores, which allow us to recognise
groups of samples with similar behaviour, and loadings,
which show the correlation among variables, were
evaluated and reported as biplots. The first three PCs
were computed, but only PC1 and PC2 gave useful
information. The data for the horizontal (including 10
cm depth) and vertical profiles were processed both
together and separately: the results of the separate
treatment will be described hereafter, and hints on the
joint processes, which provided little further informa-
tion, will be given. This paper reports some PC and
dendrogram plots, as an example, for this and the fol-
lowing sections. All other PCA and HCA plots are
available on request from the authors.
As to site A, the following observations can be made:
for the data set relative to the horizontal profile, the
variance explained by the first two PCs is 22 and 49%
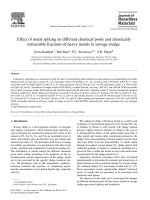
respectively (71% in all). The plot of PC1 vs. PC2 is
reported in Fig. 1a; in this figure, as well as in the
other PCA plots shown in the paper, the position of
the loadings is marked with a squared frame. Fig. 1a
shows a certain degree of similarity for samples A1–
A8, which were collected outside the relief, but still at
the site or very close to it. Samples A32 and A33,
collected outside the polluted area, are somewhat
apart but not very far from them. The specimens
from the relief (A9–A13, with the exception of A14)
are in other zones of the plot. They are distanced
from each other, owing to the heterogeneity of the
wastes. The combined plot shows that they are mainly
characterized by high concentrations of the polluting
elements. One of the pieces of material (A16) is com-
pletely isolated from the other samples, confirming its
different characteristics, and is strongly characterised
by its copper content;
the metals belonging to the first two above identified
groups, together with zirconium, are correlated, with
the exception of copper which stands alone. They
have opposite values of PC1 with respect to the other
Table 5
Typical concentration ranges and most common values present in soils, average abundance in the earth’s crust, acceptable concentrations in soils for
Italian legislation (A: limits for public and private green areas and residential use; B: limits for commercial and industrial use of soil), target and
intervention values for Dutch legislation (values in mg/kg unless otherwise stated)
Range Common values
a
Earth’s crust Limit (A) Limit (B) Target value Intervention value
pH 4–8.5
Al 81,300
Cd 0.01–2.0 0.2–1 0.15 2 10 0.8 12
Cr 5–1500 70–100 200 150 800 100 380
Cu 2–250 20–30 70 120 600 36 190
Fe 0.7–4.2% 50,000
La 18
Mn 20–10,000 1000 1000
Ni 2–750 50 80 120 500 35 210
Pb 2–300 10–30 (rural) 16 100 1000 85 530
30–100 (urban)
Sc5
Ti 4400
V 3–500 90 150 90 250
Y 2.5–250 28
Zn 1–900 50 132 150 1500 140 720
Zr 220
a
Values for agricultural soils
8 O. Abollino et al. / Environmental Pollution & (&&&&) &–&
1
2
3
4
5
6
7
8
9
10
11
12
13
14
15
16
17
18
19
20
21
22
23
24
25
26
27
28
29
30
31
32
33
34
35
36
37
38
39
40
41
42
43
44
45
46
47
48
49
50
51
52
53
54
55
56
57
58
59
60
61
62
63
64
65
66
67
68
69
70
71
72
73
74
75
76
77
78
79
80
81
82
83
84
85
86
87
88
89
90
91
92
93
94
95
96
97
98
99
100
101
102
103
104
105
106
107
108
109
110
111
112
ENPO 2364 Disk used No. pages 17, DTD=4.3.1
Version 7.5
ARTICLE IN PRESS
UNCORRECTED
PROOF
elements: this component may therefore be connected
to their origin. The pH is anticorrelated to most of
the pollutants;
two main groups can be identified from the dendro-
gram reported in figure 1b: one is made by most
samples from the relief and by the two pieces of
material; the second group contains the other samples
and it is possible to distinguish: (1) sample A33 (city
centre) which stands on its own; (2) group A3-A4-A7-
A8, coming from the ground level;
for the data regarding the vertical profile, the variance
explained by the first two PCs is 34 and 24 respec-
tively (58% in all). In the plot of PC1 vs. PC2 (not
shown) samples A17 and A18, corresponding to the
first two layers, stand out because of the high con-
centrations of Cd, Cu, Mn, Fe (for A17) and Zn (for
A18). A21 and A23 form a separate group due to the
high content of Al, Fe, Pb, La, Zn and Zr (for A21),
and Al, Fe, Cd, Ni, Ti, V and Zn (for A23). No sig-
nificant distribution can be identified for the other
samples, apart from the close resemblance of A20
and A24;
as to the loadings, the polluting elements are less
strictly correlated than in the horizontal profile, even
if they are in the same area of the plot and load posi-
tively on PC1, with the exception of Zr and Cr. pH is
anticorrelated to this groups of variables. V and Fe
behave like the pollutants, whereas Al, Sc, La, Ti and
Y are in other areas of the plot. It can be supposed
that PC1 is connected to the elements of mainly
anthropogenic origin and PC2 to the ones of a
mainly geochemical source;
HCA confirms the different characteristics of the first
two layers;
when the data for site A are processed all together,
the variance explained by the first two PCs is 50 and
19% respectively (69% in all). The samples for ver-
tical and horizontal profiles form two groups in the
plot of PC1 vs. PC2, the former being characterised
by their content in polluting elements; exceptions to
this distribution are A10 and A13, which show a
stronger similarity with the vertical samples, and A16,
the piece of material, which is isolated from the other
specimen. Two clusters corresponding to horizontal
and vertical (plus A10, A13, A16) profile samples are
also present in the dendrogram.
Data processing for site B gave the following results:
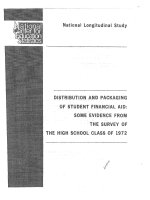
as to the horizontal profile, the variance explained by
the first two PCs is 38 and 19% respectively (57% in
all). According to the plot of PC1 vs. PC2 (Fig. 2a)
samples B1–B11, collected in the core or just outside,
and B23–B27, from the surroundings, form two
groups; samples B8 and B9, collected under the vege-
tation grown just outside the site core, have a stron-
ger similarity to the second group. Sample B28 from
the city centre is clearly differentiated from all the
others. Group B1–B11 is characterized by the pre-
sence of the polluting elements. Sample B6 stands out
because of its high content of Cr, Cu, La, Pb and Zn;
the correlation among the elements identified as pol-
lutants (Cd, Cr, Cu, Ni, Pb, Zn) is evident. Such ele-
ments are anticorrelated to Mn and Fe. A weak
correlation is also present among Al, La, Sc, Ti and
Y. The pollutants have high positive loading on PC1:
this component therefore takes account of the pollu-
tion of the site. On the other hand, PC2 is influenced
by the elements of mainly geochemical origin. Sur-
prisingly, pH is unrelated to the pollutants: a high pH
value would be expected to be connected to high
metal concentrations because it stabilises metal oxide
and hydroxide forms and reduces their mobility;
the dendrogram in Fig. 2b confirms the different
characteristics of specimen B28 and, apart from sam-
ples B23 and B26, the division between groups B1–
B11 and B23–B27. The closeness of most samples
coming from the core of the site (B1–B4), is also
apparent;
as to the vertical profile, the variance explained by the
first two PCs is 51 and 23% respectively (74% in all).
The scores on PC1 of the first two layers (B12 and
Fig. 1. Combined plot of scores and loadings obtained by (a) PCA
and (b) dendrogram for horizontal profile samples at site A (total
metal concentrations).
O. Abollino et al. / Environmental Pollution & (&&&&) &–& 9
1
2
3
4
5
6
7
8
9
10
11
12
13
14
15
16
17
18
19
20
21
22
23
24
25
26
27
28
29
30
31
32
33
34
35
36
37
38
39
40
41
42
43
44
45
46
47
48
49
50
51
52
53
54
55
56
57
58
59
60
61
62
63
64
65
66
67
68
69
70
71
72
73
74
75
76
77
78
79
80
81
82
83
84
85
86
87
88
89
90
91
92
93
94
95
96
97
98
99
100
101
102
103
104
105
106
107
108
109
110
111
112
ENPO 2364 Disk used No. pages 17, DTD=4.3.1
Version 7.5
ARTICLE IN PRESS
UNCORRECTED
PROOF
B13) are very different from those of the layers below.
A differentiation between groups B14–B17 and B18–
B22 (with sample B19 as an outlier) is also present;
the group of the polluting elements is more scattered
than in the horizontal profile, but it still has loadings
on PC1 of the opposite sign with respect to many
elements of a mainly geochemical source. PC1 is
almost unaffected by pH, which on the other hand
heavily loads on PC2. pH is anticorrelated to Cd and
Zn and, at a lower level, to Ni, La, Zr, Al;
HCA confirms the observations made above: the first
two layers from a separate cluster, and groups B14-
B17 and B18-B22 are again present, with sample B19
being closer to the former;
when all data for site B are considered together, the
variance explained by the first three PCs is 38 and
18% respectively (56% in all). The sampling locations
can be divided into three main groups: (1) the hor-
izontal profile in the site core or just outside it (B1–
B11), together with the first two layers of the vertical
profile (B12–B13), characterized by a high content of
contaminants; (2) the deeper layers of the vertical
profile (B14–B22); (3) the samples collected in the
surroundings of the site (B24–B27), excluding B23,
and in the city centre (B28). The corresponding den-
drogram showed a similar clustering.
The data for sites A and B were also treated together.
The variance explained by the first two PCs is 40 and
17% respectively (57% in all). Three groups are present,
corresponding to (1) most A samples, (2) B samples
from the horizontal profile, (3) vertical B samples and
some A ones. A samples are characterized by their con-
tent in Cu or Cd, Pb, Zn, Mn, and B ones by Cr and Ni.
Specimens from A and B sites are also differentiated in
the dendrogram.
Data processing with DA allowed us to identify all
samples as belonging to the expected classes (> 99.9%
probability), i.e. to the site of collection, except B20,
which was classified as ‘‘A’’ type, and B21, which was
assigned to the correct class but with 74.5% probability.
The two pieces of materials (A15 and A16) were exclu-
ded from the data set because they were not actually
‘‘soil’’ samples. The variables with the highest dis-
criminating power were Cd (F=31.79), Cu (F=36.50),
La (F=51.72), Pb (F=35.92), Ti (F=37.02), Zn
(F=50.28). The tabulated F value for a confidence level
of 95% is 4.00.
3.2. Mobility
Extraction studies were carried out in order to inves-
tigate the mobility of the metals and therefore their
possible release into the environment and their toxicity.
Experiments were carried out by extraction with
reagents of different chemical properties, in order to
identify fractions of analytes with different labilities.
Extractions with water and EDTA solutions were per-
formed on samples from the depth profiles. The first
layers at site A were mixed together (three by three) in
order to have a sufficient amount of specimen for all
experiments. The leaching test with acetic acid, per-
formed at pH 5.0 according to Italian official methods
of sludge analysis (Water Research Institute, 1985), was
applied only to site A, because the pH of the water sus-
pensions of most site B samples was already lower than
5.0. Tessier’s protocol was applied to two samples for
each site.
PCA and HCA were performed on the percentages
extracted in water, acetic acid and EDTA.
3.2.1. Leaching with water
The leaching test with pure water was performed in
order to evaluate the fraction of metals weakly bound to
the matrix, e.g. present as inorganic soluble salts. The
results can also give a preliminary indication on the
possible release of pollutants by rains, although of
course the laboratory experimental conditions are dif-
ferent from the on-site situation. Moreover, it is likely
that most of the very labile metal fraction has already
been leached over the years. The percentages of metals
solubilised by water, their median and ranges are
reported in Table 6. As can be seen, the extracted
Fig. 2. Combined plot of scores and loadings obtained by (a) PCA
and (b) dendrogram for horizontal profile samples at site B (total
metal concentrations).
10 O. Abollino et al. / Environmental Pollution & (&&&&) &–&
1
2
3
4
5
6
7
8
9
10
11
12
13
14
15
16
17
18
19
20
21
22
23
24
25
26
27
28
29
30
31
32
33
34
35
36
37
38
39
40
41
42
43
44
45
46
47
48
49
50
51
52
53
54
55
56
57
58
59
60
61
62
63
64
65
66
67
68
69
70
71
72
73
74
75
76
77
78
79
80
81
82
83
84
85
86
87
88
89
90
91
92
93
94
95
96
97
98
99
100
101
102
103
104
105
106
107
108
109
110
111
112
ENPO 2364 Disk used No. pages 17, DTD=4.3.1
Version 7.5
ARTICLE IN PRESS
UNCORRECTED
PROOF
Table 6
Percentages extracted in water
a
Sample Al Cd Cr Cu Fe La Mn Ni Pb Sc Ti V Y Zn Zr
Aa 0.007 0.524 < 0.005 0.169 < 0.001 < 0.004 0.022 0.579 0.019 < 0.088 < 0.001 < 0.055 < 0.032 0.041 < 0.093
Ab 0.002 1.162 < 0.003 0.056 < 0.001 < 0.003 0.122 0.234 0.006 < 0.100 < 0.001 < 0.057 < 0.031 0.512 < 0.048
Ac 0.002 0.457 < 0.003 0.033 < 0.001 < 0.004 0.015 0.127 0.005 0.140 0.003 < 0.062 < 0.031 0.333 < 0.066
A26 0.002 0.543 < 0.003 0.038 0.002 < 0.004 0.024 0.364 0.007 0.103 0.004 < 0.065 0.031 0.388 < 0.077
A27 0.001 0.654 < 0.004 0.040 0.001 < 0.004 0.019 0.149 0.007 < 0.102 < 0.001 < 0.052 0.040 0.333 < 0.092
A28 0.001 0.774 < 0.003 0.024 < 0.001 < 0.005 0.015 0.435 0.006 < 0.145 0.001 < 0.062 0.046 0.322 < 0.073
A29 0.001 0.666 < 0.005 0.036 0.001 < 0.004 0.037 0.154 0.007 < 0.104 0.002 < 0.070 0.056 0.364 < 0.097
A30 0.002 0.795 < 0.003 0.068 0.001 < 0.003 0.044 0.416 0.007 < 0.102 0.001 < 0.057 0.043 0.321 < 0.068
A31 0.002 1.267 < 0.004 0.040 0.001 < 0.003 0.045 0.486 0.005 < 0.090 < 0.001 < 0.057 0.032 0.325 < 0.073
Median (A) 0.002 0.666 < d.l. 0.040 0.001 < d.l. 0.024 0.364 0.007 < 0.102 0.001 < d.l. 0.032 0.333 < d.l.
Range (A) 0.001– 0.457–1.267 – 0.024– < 0.001– – 0.015– 0.127– 0.005– < 0.088– < 0.001– – < 0.031– 0.041– –
0.007 1.267 0.169 0.002 0.122 0.579 0.019 0.145 0.004 0.056 0.512
B12 0.016 5.742 0.008 1.274 0.014 0.107 0.457 2.511 0.060 < 0.053 0.005 < 0.065 0.099 2.850 < 0.069
B14 0.045 9.836 0.023 3.602 0.011 0.275 0.666 10.39 0.426 < 0.039 0.002 < 0.054 0.438 5.063 < 0.050
B15 0.339 1.319 0.081 9.898 0.231 2.816 2.194 25.29 0.397 0.065 0.004 < 0.045 3.780 31.30 < 0.046
B16 0.853 0.523 0.319 14.29 0.451 8.391 5.345 41.99 0.901 0.166 0.005 < 0.048 7.470 56.66 < 0.050
B17 0.038 8.136 0.041 0.702 0.092 0.199 8.747 42.62 0.116 < 0.042 0.112 < 0.053 0.254 30.82 < 0.067
B18 < 0.001 0.780 < 0.009 0.438 < 0.001 < 0.002 1.133 0.552 < 0.131 < 0.044 < 0.001 < 0.048 < 0.016 0.075 < 0.064
B19 0.007 7.561 0.008 0.250 0.017 < 0.002 4.169 7.980 0.040 < 0.411 0.004 < 0.051 0.050 4.986 < 0.063
B20 0.001 0.498 < 0.007 0.042 0.001 < 0.002 0.700 0.381 < 0.102 < 0.048 0.001 < 0.051 < 0.017 0.087 < 0.085
B21 0.001 0.534 0.012 0.029 < 0.001 < 0.003 0.494 0.693 0.144 < 0.041 < 0.001 < 0.047 < 0.018 0.092 < 0.089
B22 < 0.001 0.925 < 0.078 0.067 0.001 < 0.003 0.742 2.861 < 0.215 < 0.043 < 0.001 < 0.057 < 0.020 0.520 < 0.045
Median (B) 0.012 1.122 0.018 0.570 0.013 0.055 0.938 5.421 0.138 < d.l. 0.003 < d.l. 0.075 3.92 < d.l.
Range (B) < 0.001–0.853 0.498–9.836 < 0.007– 0.319 0.029–14.29 < 0.001–0.451 < 0.002–8.391 0.457– 0.381– < 0.102– < 0.039– < 0.001– – < 0.016– 0.075– –
0.853 9.836 0.319 14.29 0.451 8.391 8.747 42.62 0.901 0.166 0.112 7.470 56.66
a
Aak, samples A17–A19; Ab, samples A20–A22; Ac, samples A23–A25; d.l., detection limit.
O. Abollino et al. / Environmental Pollution & (&&&&) &–& 11
1
2
3
4
5
6
7
8
9
10
11
12
13
14
15
16
17
18
19
20
21
22
23
24
25
26
27
28
29
30
31
32
33
34
35
36
37
38
39
40
41
42
43
44
45
46
47
48
49
50
51
52
53
54
55
56
57
58
59
60
61
62
63
64
65
66
67
68
69
70
71
72
73
74
75
76
77
78
79
80
81
82
83
84
85
86
87
88
89
90
91
92
93
94
95
96
97
98
99
100
101
102
103
104
105
106
107
108
109
110
111
112
ENPO 2364 Disk used No. pages 17, DTD=4.3.1
Version 7.5
ARTICLE IN PRESS
UNCORRECTED
PROOF
fractions at site A are almost always below 1%. It must
be pointed out that these small percentages correspond
to significant absolute values: for instance, a percentage
of 0.32% of zinc extracted from sample A30 corre-
sponds to 137 mg/kg of the element. The highest
extractability is encountered for Cd, Cu, Mn, Zn, i.e. for
most elements identified as pollutants. There is not a
particular trend of the solubility with depth.
Many elements are solubilised at higher percentages
at site B than at site A. This is especially true for metals
identified above as pollutants (Cd, Cu, Ni, Zn), with the
exception of Cr and Pb. In many cases, the absolute
amount released is lower than at site A, owing to the
lower total concentrations present. The solubility of
the elements of mainly geochemical origin is in most
cases below 1%, with some exceptions for La, Mn, Y.
The highest percentages for the pollutants are encoun-
tered between 30 and 80 cm: it is possible that some of the
metals released by the rain from top layers precipitated
again as water was flowing through deeper layers.
When PCA was applied to the data obtained for site
A, the variance explained by the first two PCs was 36
and 23% respectively (59% at all). The plot of PC1 vs.
PC2 (Fig. 3a) shows that the extract from the first layer
(Aa) differs from the other ones for its high content of
Pb, Cu, Al and Ni. A similarity among the samples
between 238 and 300 cm (A27–A29) can be observed.
Few correlations among the variables are present, such
as Pb–Al–Cu–Ni (anticorrelated to pH), and Cd–Mn.
Therefore the solubility is not only related to the
(anthropogenic or geochemical) origin of the elements
but also to other factors, such as their chemical proper-
ties. The following clustering is observed in the dendro-
gram reported in Fig. 3b: sample Aa, which stands
alone; sample Ab (from 60 to 155 cm); samples A27–
A31 (from 238 to 330 cm); samples Ac–A26 (from 155
to 238 cm).
As to site B, the variance explained by the first two
PCs was 67 and 15% respectively (82% at all). Layer
B16 (50–65 cm) is clearly differentiated from the other
ones, owing to the higher percentages of the above
mentioned nine metals in the extract. The samples
below 80 cm (B18–B22, excluding B19) have a certain
degree of similarity, because of the low percentages
released and for their relatively high pH value, which
could explain the low element solubility. There is a
strong correlation among Al, Cr, Cu, Fe, La, Pb, Sc, Y
and Zn: the common factor underlying this behaviour is
not easy to identify, since the variables have different
chemical properties (e.g. charge or ease of hydrolysis)
and sources (i.e. mainly anthropogenic or geochemical).
The anticorrelation of these elements, as well as of Ni,
Mn, Ti, with pH can be due to the increase in mobility
with increasing acidity.
The clustering in the dendrogram confirms the differ-
ent features of the extract from sample B16 and the
similarity of the layers below 80 cm, except for sample
B19.
When data from both sites are treated together, the
variance explained by the first two PCs was 62 and 15%
respectively (77% at all). In the plot of PC1 vs. PC2
extracts of samples from site A are very close to each
other, reflecting high similarity, whereas the ones from
B are more scattered. Samples from the two sites are
separated from each other, even if deeper B layers
are close to the group of specimens from A. The variable
discriminating between the two groups of samples is
pH, which is higher in A and in the deep B samples than
in the first layers of the B profile. The groups emerging
from HCA are: (1) B16, (2) site A samples, close to deep
layer B ones and (3) the remaining B specimens.
3.2.2. Leaching at pH 5.0
The results of the leaching test at pH 5.0 for site A are
reported in Table 7. The extracted fractions are slightly
higher than the ones found with pure water, because the
slightly lower pH favours the dissociation of the existing
complexes.
The most extensively extracted metals were Cd, Cu,
Zn and Ni. In general, endogenous metals are more
strongly bound to the soil matrix, whereas the ones
introduced by anthropogenic activities are in a more
soluble form and therefore more easily released into the
environment and potentially more toxic. Moreover,
Fig. 3. Combined plot of scores and loadings obtained by (a) PCA
and (b) dendrogram for vertical profile samples at site A (extracts in
water).
12 O. Abollino et al. / Environmental Pollution & (&&&&) &–&
1
2
3
4
5
6
7
8
9
10
11
12
13
14
15
16
17
18
19
20
21
22
23
24
25
26
27
28
29
30
31
32
33
34
35
36
37
38
39
40
41
42
43
44
45
46
47
48
49
50
51
52
53
54
55
56
57
58
59
60
61
62
63
64
65
66
67
68
69
70
71
72
73
74
75
76
77
78
79
80
81
82
83
84
85
86
87
88
89
90
91
92
93
94
95
96
97
98
99
100
101
102
103
104
105
106
107
108
109
110
111
112
ENPO 2364 Disk used No. pages 17, DTD=4.3.1
Version 7.5
ARTICLE IN PRESS
UNCORRECTED
PROOF
bivalent elements are extracted more easily than tri- and
tetravalent ones. the latter probably form complex
anions, and/or stronger complexes with soil organic
matter, thus limiting their extractability; finally, their
ionic radii are smaller than their divalent counterparts
and are thus more likely to enter pores in the mineral
phases, penetrate between the layers in aluminosilicates
or become incorporated in the crystal lattice.
As to PCA, the variance explained by the first two
PCs was 45 and 22% respectively (67% in all). No cor-
relation among the elements identified as pollutants
exists. The values of the scores and the dendrogram
confirm the different behaviour of the first layer
(Aa) already observed in the extracts from water as well
as the similarity between samples Ac–A26 (from 155 to
238 cm).
3.2.3. Leaching with EDTA
The fraction of metals extracted by EDTA solutions
provides an estimate of the total pool of potentially
available species (Lund, 1990). It probably over-
estimates the bioavailable fraction, which is better
simulated by milder extractants such as neutral salts
(Rauret, 1998; Hani, 1990). The results obtained for
the two sites are reported in Table 8. As expected, the
values are higher than those found with the previous
extractants, since EDTA is a strong chelator which is
able to compete with most inorganic and organic
ligands contained in the samples. The increase in the
extracted percentages from water to EDTA is of at least
one order of magnitude for nearly all elements. The
order of extractability is Cu> Pb > Cd> Zn> Y > Ni>
Sc> Mn > La> Fe> Zr > Cr> V > Ti for site A, and
Pb> Cu> Cd> Ni> Zn > Y > Mn> La> Sc> Cr> V >
Fe> Al> Zr> T for site B. These trends are not rela-
ted to the values of the formation constants with
EDTA, which decrease in the order Zr> Fe> Cu > Ni>
Y> Pb > Zn> Cd> Al > La> Mn (Sille
`
n and Martell,
1979): the extractability therefore depends on how
strongly bound the elements are to the matrix. The
bivalent metals have higher extraction percentages than
the ones with higher oxidation states; moreover, also
with EDTA, as observed with the other extractants, the
most extensively released elements are the ones identi-
fied as pollutants; in this case also lead, whose solubility
in water was very low, behaves like the other pollutants.
According to our experience, the fractions of heavy
metals such as Cu, Pb and Zn, extracted by EDTA in
unpolluted soils are much lower (a few percentage
units), because they bind more to the soil matrix,
although the trend of the higher lability of bivalent
metals still exists. Cr, whose total concentration is also
influenced by the work of man, is only weakly released,
probably because of its inertness. Therefore the
observed trend is influenced by the chemical properties
of the single analytes and by their origin.
Table 7
Percentages extracted in acetic acid
a
Sample Al Cd Cr Cu Fe La Mn Ni Pb Sc Ti V Y Zn Zr
Aa 0.319 2.941 0.326 6.966 0.174 < 0.023 0.117 1.777 0.178 0.546 0.092 < 0.306 1.402 2.418 < 0.497
Ab 0.211 10.03 0.115 5.913 0.103 < 0.020 0.538 0.973 0.398 < 0.602 0.055 < 0.361 0.541 4.613 < 0.254
Ac 0.148 4.619 < 0.039 4.941 0.035 < 0.023 0.101 0.625 0.333 < 0.724 0.019 < 0.295 1.010 4.436 < 0.351
A26 0.145 5.125 0.057 5.265 0.033 < 0.021 0.134 1.344 0.354 < 0.619 0.015 < 0.351 0.985 4.784 0.408
A27 0.162 4.913 0.109 5.516 0.134 < 0.026 0.164 0.769 0.469 < 0.613 0.050 < 0.365 0.794 3.614 < 0.492
A28 0.116 6.732 0.108 4.652 0.062 < 0.029 0.155 1.808 0.461 5.087 < 0.004 < 0.398 1.004 4.692 < 0.390
A29 0.138 5.665 0.185 6.562 0.079 < 0.023 0.316 0.831 0.451 < 0.622 0.036 < 0.417 0.964 4.707 < 0.516
A30 0.187 6.562 0.096 6.147 0.082 < 0.016 0.460 1.191 0.390 < 0.612 0.029 < 0.333 1.018 2.603 < 0.364
A31 0.088 10.00 < 0.047 5.869 0.033 < 0.018 0.254 1.578 0.366 < 0.538 0.014 < 0.395 0.801 3.578 < 0.389
Median 0.148 5.665 0.108 5.869 0.079 < d.l. 0.164 1.191 0.390 <d.l. 0.029 < d.l. 0.985 4.436 < d.l.
Range 0.088–0.319 2.941–10.03 < 0.039–0.326 4.652–6.966 0.033–0.174 0.101–0.538 0.625–1.808 0.178–0.469 < 0.538–5.087 < 0.004–0.092 0.541–1.402 2.418–4.784 < 0.254–0.516
a
Aa=samples A17–A19; Ab, samples A20–A22; Ac, samples A23–A25; d.l., detection limit.
O. Abollino et al. / Environmental Pollution & (&&&&) &–& 13
1
2
3
4
5
6
7
8
9
10
11
12
13
14
15
16
17
18
19
20
21
22
23
24
25
26
27
28
29
30
31
32
33
34
35
36
37
38
39
40
41
42
43
44
45
46
47
48
49
50
51
52
53
54
55
56
57
58
59
60
61
62
63
64
65
66
67
68
69
70
71
72
73
74
75
76
77
78
79
80
81
82
83
84
85
86
87
88
89
90
91
92
93
94
95
96
97
98
99
100
101
102
103
104
105
106
107
108
109
110
111
112
ENPO 2364 Disk used No. pages 17, DTD=4.3.1
Version 7.5
ARTICLE IN PRESS
UNCORRECTED
PROOF
Table 8
Percentages extracted in EDTA
a
Sample Al Cd Cr Cu Fe La Mn Ni Pb Sc Ti V Y Zn Zr
Aa 0.781 5.020 0.752 28.32 0.524 0.764 0.183 2.685 10.18 2.468 0.023 < 0.096 4.953 5.739 0.292
Ab 1.080 14.62 0.765 35.36 0.956 0.723 0.793 2.351 6.130 3.028 0.032 <0.113 4.639 8.047 0.241
Ac 0.950 7.396 0.661 31.63 0.826 0.498 0.207 1.906 6.369 2.751 0.023 < 0.092 4.349 8.776 0.245
A26 0.954 7.159 0.686 29.41 0.714 0.515 0.332 3.410 5.695 2.494 0.029 < 0.110 4.263 9.043 0.393
A27 0.619 7.567 0.669 31.15 0.516 0.435 0.382 2.337 5.811 2.012 0.021 < 0.114 3.471 8.347 0.308
A28 1.023 10.39 0.634 31.71 0.664 0.584 0.414 4.059 6.626 2.791 0.022 < 0.124 4.498 10.90 0.196
A29 0.617 7.256 0.506 32.95 0.471 0.391 0.579 2.131 5.970 1.927 0.025 < 0.130 3.154 8.933 0.234
A30 0.605 9.844 0.632 33.96 0.762 0.447 0.411 1.988 6.762 2.490 0.027 < 0.104 3.259 5.329 0.254
A31 0.682 14.03 0.629 35.67 0.753 0.434 0.407 2.653 6.859 2.186 0.026 < 0.123 3.161 7.232 0.409
Mean (A) 0.812 9.254 0.659 32.24 0.687 0.532 0.412 2.613 6.711 2.461 0.025 < d.l. 3.972 8.038 0.286
Median (A) 0.781 7.567 0.661 31.71 0.714 0.498 0.407 2.351 6.369 2.490 0.025 < d.l. 4.263 8.347 0.254
Range (A) 0.605–1.080 5.020–14.62 0.506–0.765 28.32–35.67 0.471–0.956 0.391–0.764 0.183–0.793 1.906–4.059 5.695–10.18 1.927–3.028 0.021–0.032 – 3.154–4.953 5.329–10.90 0.196–0.409
B12 0.838 38.28 0.851 52.67 3.407 1.106 0.751 11.21 97.31 3.337 0.023 1.299 11.22 11.73 0.260
B14 0.711 30.42 1.772 42.00 3.313 5.332 1.002 20.94 92.69 5.564 0.300 2.762 12.12 8.681 0.357
B15 1.014 61.23 1.336 39.01 2.935 9.509 2.556 34.92 96.71 5.768 0.343 3.527 17.57 31.83 0.371
B16 1.805 67.94 2.442 37.54 1.884 3.322 5.704 53.88 83.33 5.256 0.068 5.010 16.68 58.63 0.413
B17 0.899 63.84 1.082 34.85 1.564 7.346 12.99 64.71 79.71 3.469 0.243 3.093 9.800 54.34 0.304
B18 0.765 24.31 0.580 26.13 1.697 7.058 13.15 33.26 88.87 3.786 0.187 2.708 9.788 13.73 0.167
B19 0.855 58.17 0.837 45.50 2.319 8.426 11.06 34.24 95.16 3.936 0.192 2.326 11.52 29.58 0.265
B20 0.921 2.586 0.653 40.56 2.082 6.371 8.564 26.12 84.07 4.314 0.190 1.988 9.213 13.51 0.284
B21 0.794 4.196 0.776 33.54 1.684 6.842 6.499 45.14 63.28 3.413 0.183 2.410 8.848 26.62 0.312
B22 0.668 4.078 8.442 40.12 0.964 3.621 3.349 39.49 16.46 2.428 0.165 1.582 5.660 26.09 0.161
Mean (B) 0.927 35.51 1.877 39.19 2.185 5.893 6.563 36.39 79.76 4.127 0.189 2.671 11.24 27.47 0.289
Median (B) 0.847 34.35 0.967 39.57 1.983 6.607 6.102 34.58 86.47 3.861 0.189 2.559 10.51 26.36 0.294
Range (B) 0.668–1.805 2.586–67.94 0.580–8.442 26.13–52.67 0.964–3.407 1.106–9.509 0.751–13.15 11.21–64.71 16.46–97.31 2.428–5.768 0.023–0.343 1.299–5.010 5.660–17.57 8.681–58.63 0.161–0.413
a
Aa, samples A17–A19; Ab, samples A20–A22; Ac, samples A23–A25; d.l., detection limit.
14 O. Abollino et al. / Environmental Pollution & (&&&&) &–&
1
2
3
4
5
6
7
8
9
10
11
12
13
14
15
16
17
18
19
20
21
22
23
24
25
26
27
28
29
30
31
32
33
34
35
36
37
38
39
40
41
42
43
44
45
46
47
48
49
50
51
52
53
54
55
56
57
58
59
60
61
62
63
64
65
66
67
68
69
70
71
72
73
74
75
76
77
78
79
80
81
82
83
84
85
86
87
88
89
90
91
92
93
94
95
96
97
98
99
100
101
102
103
104
105
106
107
108
109
110
111
112
ENPO 2364 Disk used No. pages 17, DTD=4.3.1
Version 7.5
ARTICLE IN PRESS
UNCORRECTED
PROOF
As observed for the release with water, the extrac-
tability of many elements is higher in site B than in site
A. The extracted percentages do not show a clear trend
based on depth in either site.
PCA and HCA were again performed. For the data
set about site A, the variance explained by the first two
PCs is 32 and 27% respectively (59% at all). Samples
Aa and Ab, corresponding to the first layers down to
155 cm, are far from each other, and from the deeper
layers, in the plot of PC1 vs. PC2. The distribution of
variable loadings is different from the one observed with
leaching in water or acetate, due to the different extrac-
tion mechanism involved. Cu, Zn, Mn and Cd are cor-
related, and anticorrelated to Pb. Trivalent elements lay
in one quadrant of the plot (together with Ti and Ni)
whereas the two other elements at high valence state, Zr
and V, are scattered elsewhere. Sample pH does not
seem to have a strong effect on most elements, probably
because extractability mainly depends on the pH of the
acetate buffer. Most variables have positive loadings on
PC2. HCA confirms the different characteristics of the
first layers.
For the data set on site B, the variance explained by the
first two PCs is 38 and 26% respectively (64% at all).
Variable loadings in Fig. 4a are scattered in the plots and
no clear explanation of the existing correlations in terms
of chemical or environmental behaviour exists. pH has
a negative loading on PC1, unlike most of the other
elements.
As to the scores, two main (loose) groups can be
identified, corresponding to the deepest layers (B18–
B22, excluding B19), mainly characterized by higher
pH, and the intermediate ones (B14–B17). The top layer
(B12) stands on its own for the high percentages of
extracted Cu, Pb and Fe.
A different clustering is visible in the dendrogram
(Fig. 4b), characterized by the presence of two main
groups, corresponding to the samples down to 65 cm
(B12–B16) and to the deeper ones respectively.
When data at A and B sites are considered together,
the variance explained by the first two PCs is 57 and
12% respectively (69% in all). Extracts from A and B
samples are clearly separated in the plot of PC1 vs. PC2,
the latter being more scattered and characterized by
higher metal percentages. Most parameters load heavily
on PC1, which alone carries more than half of the data
variability, so there seems to be one common factor
behind the results. Two clusters corresponding to site A
and B samples are also present in the dendrogram.
3.2.4. Sequential extraction
Speciation according to Tessier’s scheme (Tessier et
al., 1979) was determined on four samples: for each site
one sample came from the surface (A9 and B1) and the
other from a deeper layer (A20, 60–100 cm and B17, 65–
80 cm). The percentages of metals in the five fractions
are reported in Table 9. Of course, when considering
these data, the extent of metal recovery (see Section
2.3.6) must be taken into account. It must be borne in
mind that, as with any speciation scheme for soil, these
results are operationally defined, since the phenomena
of redistribution and adsorption usually take place dur-
ing extractions: in any case the partitioning of the
metals into five fractions gives an indication of their
reactivity and hence of their availability to the environ-
ment and their potential harmful effects.
Exchangeable elements are present at site A at very
low levels, typically < 1%. The amounts found in the
second fraction are higher, but generally below 5%, one
exception being represented by copper. The third frac-
tion mainly contains Cu, Zn and most Mn, but also
significant amounts of other elements such as Cd, Cr
and Fe. Low percentages (generally < 5%) are present
in the fourth fraction. The highest levels (> 90%) of
several elements are in the residual fraction, which on
the other hand contains only 20% or less of Cu and Mn.
In many cases the order of extractability in the frac-
tions is 1< 2 < 4< 3 < 5, but the fraction associated to
carbonates exceeds the one associated to organic matter
in several samples.
The metals in site B have a higher mobility than at site
A, since significative percentages of elements such as
Fig. 4. Combined plot of scores and loadings obtained by (a) PCA
and (b) dendrogram for vertical profile samples at site B (extracts in
EDTA).
O. Abollino et al. / Environmental Pollution & (&&&&) &–& 15
1
2
3
4
5
6
7
8
9
10
11
12
13
14
15
16
17
18
19
20
21
22
23
24
25
26
27
28
29
30
31
32
33
34
35
36
37
38
39
40
41
42
43
44
45
46
47
48
49
50
51
52
53
54
55
56
57
58
59
60
61
62
63
64
65
66
67
68
69
70
71
72
73
74
75
76
77
78
79
80
81
82
83
84
85
86
87
88
89
90
91
92
93
94
95
96
97
98
99
100
101
102
103
104
105
106
107
108
109
110
111
112
ENPO 2364 Disk used No. pages 17, DTD=4.3.1
Version 7.5
ARTICLE IN PRESS
UNCORRECTED
PROOF
Cu, Ni, Pb, Zn are present already in the first fraction.
Similar levels are contained in the fraction associated to
carbonates. The percentages in the third fraction are
generally higher than in the first two and decrease again
in the fourth one. The residual is very high for elements
of mainly geochemical origin, such as Al or Fe, and
lower for pollutants, e.g. Cu, Ni or Zn.
The extractability order is 1< 2< 3 < 4< 5or1< 2<
4< 3< 5 for most elements of mainly geochemical ori-
gin, whereas the pollutants are distributed in the five
fractions in a less regular way; their concentration in the
residue is sometimes lower than the one found in other
fractions, and the content in exchangeable metal is
higher than in fraction 2 or 4.
The element content in the first two fractions is rela-
tively high in comparison with the partitioning of metals
in unpolluted soils of Piedmont (unpublished data); in
such soils, most metals (with the exception of Al, Fe,
Mn, Ti) were undetectable in the first fraction and were
typically present at levels below 1% in the second one:
correspondingly, the percentage of residual metal was
higher. These differences are particularly apparent for
the metals identified as pollutants at the two sites, such
as Cu and Zn. Our findings are in agreement with the
results obtained by other authors (Li et al., 1995), who
applied Tessier’s scheme to clean and contaminated
soils (Li et al., 1995).
The high pollutant mobility favours their release into
the environment and hence their potential harmfulness.
4. Conclusions
The investigation on the two sites allowed us to iden-
tify the nature of the pollutants and to give a pre-
liminary indication of the extension of the
contamination. If a deeper understanding of the char-
acteristics of the area is required, the guidance devel-
oped by US-EPA for soil screening can be followed
(US-EPA, 1996). The sites have different characteristics
because of the different origin and history of the pollu-
tion. An hypothesis on the origin of each metal, i.e.
either (mainly) anthropogenic or (mainly) geochemical,
was made. The identified pollutants can be released into
the environment mainly through three pathways,
namely plant uptake, soil ingestion and leaching into
water. Site A is the most heavily contaminated, mainly
by Cd, Cu, Pb and Zn, whereas high concentrations of
Cd, Cr, Cu, Ni, Pb, Zn are present at site B. The levels
of some heavy metals at both sites were higher than the
acceptable limits reported in Italian and Dutch legisla-
tions for soil reclamation. The pollution seems to be
limited to the sites (or, in case B, to its immediate sur-
roundings) and does not involve the nearby soil. There
Table 9
Percentages extracted in the five fractions according to Tessier’s procedure
Sample Al Cd Cr Cu Fe La Mn Ni Pb Sc Ti V Y Zn Zr
A9
1st fraction 0.003 2.410 < 0.263 0.285 0.004 < 0.009 0.336 < 0.405 1.551 < 0.473 0.003 < 0.547 < 0.113 2.338 < 1.112
2nd fraction 0.254 4.305 < 0.537 35.74 0.103 < 0.017 1.469 3.196 8.265 0.993 0.009 < 1.093 1.787 16.70 < 2.224
3rd fraction 2.632 28.51 2.818 45.42 14.76 4.254 77.33 4.484 12.70 < 1.892 0.041 12.97 3.480 31.53 < 4.448
4th fraction 0.596 6.658 < 1.051 6.760 0.290 1.642 6.056 1.619 1.752 < 1.892 0.019 < 2.186 1.299 2.269 49.51
5th fraction 96.52 58.12 > 95.33 11.80 84.84 > 94.08 14.81 > 90.30 75.73 > 94.75 99.93 > 83.20 > 93.32 47.16 > 42.71
A20
1st fraction 0.012 1.407 0.110 0.245 < 0.001 < 0.018 1.140 < 0.157 0.483 < 1.250 < 0.006 < 0.687 < 0.261 3.292 < 0.430
2nd fraction 1.181 3.417 0.804 29.74 0.378 1.086 2.782 7.468 2.575 6.125 0.050 < 1.374 7.983 12.10 < 0.859
3rd fraction 14.53 11.29 18.45 42.94 39.93 19.13 71.91 < 0.629 1.560 12.50 0.193 < 2.747 17.88 24.17 < 1.718
4th fraction 4.773 1.585 0.275 6.873 2.191 1.871 4.762 < 0.629 0.330 < 5.000 0.040 3.879 < 1.045 2.164 < 1.718
5th fraction 79.50 82.30 80.36 20.20 > 57.50 > 77.90 19.41 > 91.117 95.05 > 75.13 > 99.71 > 91.31 > 72.83 58.27 < 95.28
B1
1st fraction 0.029 < 4.000 0.024 9.901 0.018 < 0.009 2.430 10.32 11.05 < 0.551 0.007 1.024 0.687 19.44 < 0.584
2nd fraction 0.175 14.74 0.631 18.03 0.237 12.88 0.824 3.652 8.604 < 1.103 0.018 < 1.138 5.302 7.704 < 1.169
3rd fraction 3.131 31.58 24.64 9.276 19.43 12.88 5.908 59.54 39.90 < 2.205 0.031 9.413 16.10 35.46 < 2.338
4th fraction 5.366 29.05 33.45 46.45 1.390 12.13 2.557 16.61 13.53 < 2.205 2.186 12.69 29.12 14.20 < 2.338
5th fraction 91.30 > 20.63 41.26 16.34 78.93 > 62.10 88.28 9.878 26.92 > 93.94 97.76 > 75.74 48.79 23.20 > 93.57
B17
1st fraction 0.053 13.28 < 0.272 6.220 0.178 < 0.008 10.00 43.11 5.366 < 0.421 0.006 < 0.530 1.112 43.36 < 0.556
2nd fraction 0.716 14.26 3.424 12.60 0.899 < 0.016 2.813 17.07 9.194 1.220 0.042 1.059 2.643 15.99 < 1.111
3rd fraction 7.003 23.27 27.77 2.603 8.433 7.122 6.330 23.82 41.42 2.473 0.298 14.30 7.752 27.69 < 2.222
4th fraction 1.493 7.617 2.391 10.70 2.128 3.870 2.747 4.446 10.70 1.682 0.076 2.119 4.812 3.197 < 2.222
5th fraction 90.74 41.57 > 66.14 67.88 88.36 > 88.98 78.11 11.55 33.32 > 94.20 99.58 > 81.99 83.68 9.760 > 93.89
16 O. Abollino et al. / Environmental Pollution & (&&&&) &–&
1
2
3
4
5
6
7
8
9
10
11
12
13
14
15
16
17
18
19
20
21
22
23
24
25
26
27
28
29
30
31
32
33
34
35
36
37
38
39
40
41
42
43
44
45
46
47
48
49
50
51
52
53
54
55
56
57
58
59
60
61
62
63
64
65
66
67
68
69
70
71
72
73
74
75
76
77
78
79
80
81
82
83
84
85
86
87
88
89
90
91
92
93
94
95
96
97
98
99
100
101
102
103
104
105
106
107
108
109
110
111
112
ENPO 2364 Disk used No. pages 17, DTD=4.3.1
Version 7.5
ARTICLE IN PRESS
UNCORRECTED
PROOF
is generally not a regular trend in the concentrations as
a function of depth.
Multivariate data treatment confirmed that the two
sites have different characteristics and allowed us to
identify, within each site, group of samples with similar
composition and correlation among elements.
Extraction studies showed that metal mobilities were
higher for site B than for site A. Moreover the mobility
of the contaminants was higher than in unpolluted soils:
therefore such contamintants are potentially more
harmful for the environment.
Acknowledgements
We thank the Ministero dell’Universita
`
e della
Ricerca Scientifica e Tecnologica (MURST Rome,
COFIN-2000) and the Italian National Research
Council (C.N.R., Rome) for financial support, and the
local Environmental Protection Authorities for their
cooperation and assistance in completing characteriza-
tion and sampling of the sites.
References
Aceto, M., Sarzanini, C., Abollino, O., Sacchero, G., Mentasti, E.,
1994. Distribution of minor and trace metals in Carezza Lake (Ant-
arctica) Ecosystem. Intern. J. Environ. Anal. Chem. 55, 165–177.
Alloway, B.J., 1994. Understanding our Environment: An Introduc-
tion to Environmental Chemistry and Pollution, second ed. In:
Harrison, R.M The Royal Society of Chemistry, Cambridge, pp.
144–145.
Bettinelli, M., Baroni, U., Pastorelli, N., 1989. Microwave oven sam-
ple dissolution for the analysis of environmental and biological
materials. Anal. Chim. Acta 225, 159–174.
Bombach, G., Pierra, A., Klemm, W., 1994. Arsenic in contaminated
soil and river sediment. Fresenius J. Anal. Chem. 350, 49–53.
Ferguson, C., Kasamas, H., 1999. Risk Assessment for Contaminated
Sites in Europe, vol. 2. Policy Framework, LQM Press Ed, Notting-
ham.
Gulmini, M., Ostacoli, G., Zelano, V., Torazzo, A., 1994. Comparison
between microwave and conventional heating procedures in
Tessier’s extractions of calcium, copper, iron and manganese in a
Lagoon Sediment. Analyst 119, 2075–2080.
Halloway, B.J., 1990. Heavy Metals in Soils. Blackie, London.
Hani, H., 1990. The analysis of inorganic and organic pollutants in
soil with special regard to their bioavailability. Intern. J. Environ.
Anal. Chem. 39, 197–208.
Jeong, J.H., Song, H.J., Jeong, G.H., 1997. Depth profiles and the
behaviour of heavy metal atoms contained in the soil around a Il-
Kwang disused mine in Kyung Nam. Anal. Sci. Technol. 10, 105–
113.
Li, X., Coles, B.J., Ramsey, M.H., Thornton, I., 1995. Chemical par-
titioning of the new national Institute of Standards and Technology
Standard Reference Materials by sequential extraction using ICP
AE Spectrometry. Analyst 120, 1415–1419.
Lund, W., 1990. Speciation analysis—why and how? Fresenius J.
Anal. Chem. 337, 557–564.
Lund, U., Fobian, A., 1991. Pollution of two soils by arsenic, chro-
mium and copper, Denmark. Geoderma 49, 83–103.
Merian, E., 1991. Metals and their Compounds in the Environment.
VCH, Weinheim.
Ministerial Decree, 1992. Italian Official Gazzette no. 121, 25 May
1992.
Ministerial Decree, 1999a. Italian Official Gazzette no. 248, 21 Octo-
ber 1999.
Ministerial Decree, 1999b. Italian Official Gazzette no. 293, 15
December 1999.
Ministry of Housing, 1994. Spatial Planning and the Environment.
Intervention and Target Values—Soil Quality Standards. The
Netherlands.
Nowak, B., 1995. Sequential extraction of metal forms in the soil near
a roadway in southern Poland. Analyst 120, 737–739.
Rauret, G., 1998. Extraction procedure for the dewtermination
of heavy metals in contaminated soil and sediment. Talanta 46,
449–455.
Sille
`
n, L.G., Martell, A.E., 1979. Stability Constants of Metal-Ion
Complexes. Part B. Organic Ligands, Pergamon Press, Oxford.
Szulczewski, M.D., Helmke, P.A., Bleam, W.F., 1997. Comparison of
XANES analyses and extractions to determine chromium speciation
in contaminated soils. Environ. Sci. Technol. 31, 2954–2959.
Tessier, A., Campbell, P.G.C., Bisson, M., 1979. Sequential extraction
procedure for the speciation of particulate trace metals. Anal.
Chem. 51, 844–851.
US-EPA, 1996. Office of Solid Waste and Emergency Response, Soil
Screening Guidance, User’s Guide, second ed. Washington DC.
Water Research Institute (IRSA), 1985. Analytical Methods for Slud-
ges. Physico-chemical Parameters, IRSA-CNR, Rome.
Weast, R.C., 1974. CRC Handbook of Chemistry and Physics, fifty-
fifth ed. CRC Press, Cleveland, OH. (Section F-188).
O. Abollino et al. / Environmental Pollution & (&&&&) &–& 17
1
2
3
4
5
6
7
8
9
10
11
12
13
14
15
16
17
18
19
20
21
22
23
24
25
26
27
28
29
30
31
32
33
34
35
36
37
38
39
40
41
42
43
44
45
46
47
48
49
50
51
52
53
54
55
56
57
58
59
60
61
62
63
64
65
66
67
68
69
70
71
72
73
74
75
76
77
78
79
80
81
82
83
84
85
86
87
88
89
90
91
92
93
94
95
96
97
98
99
100
101
102
103
104
105
106
107
108
109
110
111
112